Density is not Destiny: Covid in Cascadia

One of the densest cities in North America has recorded relatively few Covid-19 cases.

There’s a popular theory going around–unfortunately being propagated by the Governor of New York–that somehow density is to blame for the spread of Covid-19.  There’s little question that New York is the epicenter of the pandemic (pandemicenter?) and it is, famously, America’s densest city. But if density were the main factor, or even a consistent one, you would expect to find it driving the pandemic in other dense cities as well.

Blogger Aaron Carr–among others–have done a great job of graphically highlighting the simple fact that much denser cities around the world, particularly in Asia, have done a dramatically better job than New York in containing the virus. Tokyo, Taipei and Seoul, to name three, have far lower numbers of reported cases and deaths on a population-adjusted basis than does the New York Metro Area.  But of course, its tempting to dismiss the relevance of these examples, because they are, after all, other countries.

But we can find an equally good example close at hand, right here in North America.  Just across the 49th parallel, there’s a very dense metropolitan area that’s done as good a job as any US metro area in fighting the spread of the pandemic:  Vancouver BC.

For purposes of this essay, we’ll compare Vancouver with its two nearest US neighbors:  Seattle, which is slightly bigger and had an early and severe Covid-19 outbreak; and Portland which is slightly smaller, and has managed to record one of the lowest cumulative rates of reported cases per capita of any large US metro area (50th out of 53, at last count).

The three principal cities of Cascadia, Portland, Seattle and Vancouver have all been affected by the Corona Virus.

You’d think that if density fueled the Covid-19 pandemic, you’d find lots of cases here–and you’d be wrong. (Photo:  Global News)

Metro Seattle had the first case recorded in the US on January 21, 2020; Vancouver had one of the earliest cases in Canada on January 26.

Metro Vancouver is the densest city in Canada, with a density of more than 5,000 residents per square kilometer.  It’s the fifth densest large city in North America, and  in the US, only San Francisco and New York have higher densities.. Two-thirds of its residents live in multi-family housing.  In addition, Vancouver is a global gateway city with substantial tourist and business travel, close ties to Asia, and a large immigrant Chinese population.  Metro Vancouver has more than a quarter million residents who were born in China or Hong Kong. A high fraction of its residents use the city’s excellent transit system. A recent city report shows that a majority of all trips were made by walking, cycling or transit.

So, if your pet Covid-19 theories revolve around density, lots of Chinese people, and riding buses and trains, Vancouver ought to be a hotbed of infection.

But it’s not.  If anything, despite density, diversity and transit, Vancouver’s weathered the crisis extremely well.

Here we’ve tabulated data on the number of cases reported by the British Columbia Center for Disease Control (BCCDC). We’ve computed a rate of cases per 100,000 comparable to our estimates (based on US data compiled by the New York Times), for Portland, and Seattle.  In each case, we’ve adjusted for population by calculating the cumulative number of reported cases per 100,000 population.  Data for Portland and Seattle are for their respective US metropolitan areas; BC data is for the two provincial health authorities–Vancouver Coastal and Fraser–that serve the Vancouver Area.

Reported Covid-19 Cases per Capita, Selected Cities

Data for Vancouver is through April 16; Data for US cities is through April 17.

Vancouver’s rate of reported cases is slightly lower than metro Portland’s (45 vs 54 cases per 100,000); Seattle’s rate is higher (owing largely to the effects of the large and early outbreak in March).

We’ve also computed the number of newly reported cases per 100,000 population in the past day (April 16 for Vancouver; April 17 for the US cities).  Again, Vancouver has the lowest rate of reported cases of the three; and all these cities are well below the median values for large US metro areas (5 cases per 100,000).  For reference, the New York metro area recorded more than 50 new cases per 100,000.

Vancouver is in the same region, and roughly the same size as Portland and Seattle.  And it is far denser, and yet it has performed the best of the three in fighting the spread of the Corona virus.  It should be pretty compelling evidence that density is not a determining factor of whether one is vulnerable to the pandemic or not.

Why did BC do so well?

It’s unlikely that it was differences in travel restrictions and social distancing policies. British Columbia’s response to the pandemic was very similar to that of neighboring Washington State.  The province closed schools and bars on March 17, and extended its closure to dine-in restaurants on March 20.  Seattle closed its bars and restaurants on March 16, after closing most schools on March 11.

When it comes to the pandemic, density is definitely not destiny.  But that still leaves open a question of why BC did much better than Seattle and somewhat better than Portland.  Of course, the Canadian health care system’s more comprehensive and community focused model may be part of the reason.

This post has been revised to correct typographical errors.


The Covid Corridor: The pandemic is worst in the NE Corridor

The incidence of reported Covid-19 cases, and their daily growth is higher in the metros of NE corridor than the rest of the country.

The Northeast Corridor has all four of the cities with the highest rate of newly reported cases.

New Cases per 100,000 population, April 17

A new metric:  New cases per 100,000 population

For the past several weeks, we’ve been tracking the cumulative number of reported Covid-19 cases per 100,000 population in each of the nation’s 53 largest metropolitan areas.  Today, we tweak that measure just a bit to focus on the number of cases reported in the past day in each of these metro areas.  This daily increase measure signals what’s happening right now.  It can be a bit noisier due to day-to-day variations in reporting lags across metro areas, but the cumulative measure is now increasingly telling us about past reported cases, rather than what’s going on right now.

Here’s a bar chart showing the number of new cases per 100,000 on April 17 for each metro area with a million or more population.  New York had about 50 new cases per 100,000 population, about ten times the level reported in the median large metropolitan area (5 new cases). (Northeast Corridor metros are highlighted in red).

What’s striking about this chart is that all four of the metros with the highest number of new cases–New York, Boston, Providence and Philadelphia–are all in the Northeast Corridor.  The corridor also accounts for six of the top eight metros on this measure (adding Hartford and Washington).  Each of these metro areas is reporting new cases per capita at a rate 2-3 times higher (and in Boston’s case, 6 times higher) than the median large metro area in the US.

In contrast, some cities that had experienced an earlier surge in cases have seen a significant reduction in reported new cases.  Seattle had just 3.7 new cases per 100,000 on April 17, well below the median for large metro areas.

These data signal a wide disparity among metropolitan areas in the current spread of the Corona virus.  Some metropolitan areas are seeing very low levels of growth (seven metro areas had 2 or fewer new reported cases per 100,000 on April 17).  Meanwhile the pandemic seems much more pernicious and continues to spread at a much higher rate in other parts of the country.  While the New York metropolitan area  has (appropriately) drawn attention as the epicenter of the pandemic, it actually appears to be a problem that disproportionately affects the entire NE Corridor, from Washington to Boston.


What Covid-19 teaches us about how to fix freeways

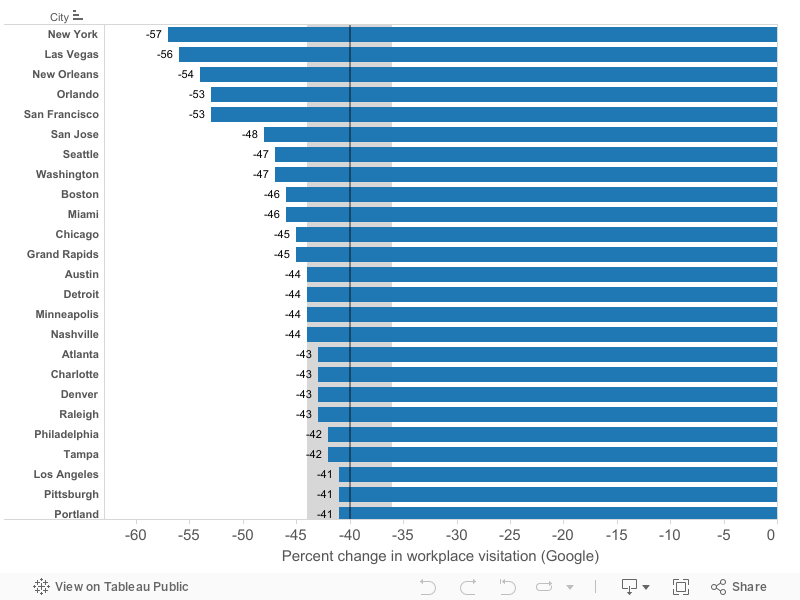
Limiting demand actually makes freeways work better

Portland’s I-5 North freeway now carries more cars, faster at the peak hour than it did prior to the pandemic.  Average speeds on I-5 between the Marquam and Interstate Bridges between 4:30 and 5:30 have doubled to more than 55 miles per hour–and the road is carrying about two percent more vehicles than before the pandemic.

If we’re willing to learn, this experiment shows us how to fight congestion and get a more efficient transportation system.

As everyone knows, traffic is moving much faster today than 6 weeks ago. Stay-at-home policies have reduced car travel by more than half in most of the nation’s large metro areas.

The pandemic traffic miracle: Freeways are carrying more cars, faster

With lower traffic volumes, cars are zooming along, with most freeway traffic in Portland regularly exceeding the posted legal speed limit.

So you might think that our freeways are carrying fewer cars at the peak hour than 6 weeks ago.  But you’d be wrong.  Actually, at the peak hour, between 4:30 and 5:30 PM, major Portland-area freeways are carrying just as many cars now (actually slightly more) than they were Pre-Covid-19.  And they’re going much, much faster.

Let’s take a close look at I-5 through North Portland, reputedly one of the most congested roadways in the State (and a place where the Oregon Department of Transportation wants to spent upwards of a billion dollars to widen a mile and a half of roadway).

We look at the area between the Rose Quarter and the Interstate Bridge (milepost 300 to milepost 309.  We pull together real-time traffic speed and volume data recorded by Portland State University’s PORTAL traffic counting program.  PORTAL measures traffic speeds and volumes. We look at peak hour travel volumes and speeds on weekdays, Northbound, between 4:30 and 5:30 PM between the Marquam Bridge (Milepost 300) and the Interstate Bridge (Milepost 308).

Let’s first look at the baseline:  What is traffic like on I-5 on a typical weekday?  We focus on the afternoon commute because its generally the worst and most regular traffic tie up.  Here’s the Portal data for I-5 for the five weeks prior to the implementation of social distancing measures, from February 3 to March 12, 2020. On a typical weekday, this stretch of freeway carried about 26,900 cars during this hour at an average speed of 25.6 miles per hour.

Now look at the post-Covid period.  Here are the data from March 13 to March 28.  To no one’s surprise, speeds are up, to an average of 53.6 miles per hour (on a stretch of freeway that is posted with a 50 mile per hour speed limit).  And the peak hour volume, from 4:30 PM to 5:30 PM:  It is 27,450 vehicles in this hour, not down, but up, about 2 percent from pre-Covid levels.

Post-Covid-19:  Speeds are up on I-5, and so is peak hour traffic volume

The simple but seemingly amazing fact is that the I-5 freeway is carrying more vehicles, faster, now at the peak hour than it did prior to Covid-19 travel restrictions. How can this possibly be the case?

What highway engineers know, but won’t tell you about congestion

It’s actually a well known fact that roads carry more traffic, faster, when they’re not allowed to become congested.  Freeways are subject to a kind of “tipping point”–they carry more and more traffic at reasonably high speeds (45-50 miles per hour) right up to a point where traffic flow becomes saturated, and one minor slowdown is rapidly propagated through the system, and the road declines in speed and–this is the important part–it loses capacity:  it actually carries fewer cars.

The reason that I-5 was so jammed up before the Covid-19 pandemic, and is so fast-moving (and is carrying even more vehicles) now, is entirely explained by the fact that we’ve kept traffic below that tipping point.  Here’s the data from PORTAL that shows, before and after, how this works.

BEFORE:  Tipping point hit at 2-3 PM, and speed falls until 6-7PM.  This is exactly the phenomenon we see on a daily basis on I-5.  Here’s a chart of typical daily traffic volumes from Midnight (0 hour) through the entire course of the day. These data are for I-5 Northbound from milepost 300 to 307, from February 10 to February 14.  The blue lines correspond to speed (measured on the left axis); the blue columns are traffic volumes, per hour, measured on the right axis).

As you can see, at about 2pm or 3 pm everyday, traffic volumes on I-5 North reach the saturation level, and travel speeds fall sharply to around 20 miles per hour.  They stay that way usually until between 6pm and 7pm, when traffic volumes fall enough (fewer cars and trucks entering from the South) to allow traffic to accelerate back up the the speed limit.

AFTER:  Traffic stays below the tipping point all day; speed averages 55-60 miles per hour all day.  This is the same chart as before, for the dates April 13-17.

Because the freeway never becomes saturated and doesn’t push past its tipping point, travel speeds stay high–and the road carries even more traffic at the peak hour (between 4:30 and 5:30 PM) than it did prior to the pandemic.

Notice that while peak hour volumes are up slightly, total daily traffic counts are, in fact, down.  Here we look at 24-hour traffic counts for milepost 307.9.  For the weekdays from February 17 through February 28, this stretch of I-5 Northbound averaged about 46,700 vehicles per day.  For weekdays of the week March 23 to 27, traffic volumes had declined to about 38,100 vehicles per day, a decline of about 18 percent.  What this almost one-fifth decline in traffic meant was that at no point during the day did the volume of traffic push the freeway past its usual “tipping point” that triggers congestion and prolonged slowdowns.

How is that possible? The science of freeways and congestion

Here’s the way freeways really work:  As long as everyone is moving at 45-50 miles per hour, the freeway works well, at it carries the maximum amount of traffic.  But once a freeway becomes even slightly over-loaded, traffic speeds fall abruptly, and–and this is critical–the freeway actually loses capacity (it carries fewer cars past a given point at any period of time).

The relationship between traffic volume and traffic-speed is “non-linear”.  When we chart traffic speeds against volumes, we get a curve showing how traffic jams form. Here’s an example from the Washington State Department of Transportation’s 2018 Congestion Report.  Speed is shown on the vertical axis; the volume of cars on trucks on the horizontal axis. Each dot corresponds to an observation of the number and speed of cars on this section of roadway. The shaded curve shows the statistical relationship fitted to the pattern of dots.

At low levels of volume (top left), traffic moves a long at a free flow speed (usually the speed limit, or slightly higher).  As traffic volumes increase (moving along that curve to the right), speeds decline slowly.  Once traffic becomes saturated–on this chart, between 1,500 and 2,000 vehicles per lane, per hour–we get to a point of instability, where the speed/volume relationship is erratic and the curve becomes backward bending.  The exact tipping point for any stretch of freeway will depend on a number of factors:  whether the road is straight or curved, the presence of on- and off-ramps and other factors. Once a road reaches and slightly exceeds its capacity, traffic suddenly slows, and the road then carries fewer cars.  The roadway tends to stay stuck in this lower part of the curve until traffic entering the freeway drops, and cars can accelerate and get to the upper part of the curve.

The reason we have recurring traffic jams is because there’s nothing to stop too many cars from getting on the freeway, and once they do, and push the freeway past its tipping point, the roadway tends to stay congested.  In fact, a lot of the “improvements” that highway engineers make (i.e. expanding the capacity of ramps), actually makes it easier for more cars to get onto the roadway, causing it to jam up sooner.  (As we documented at City Observatory, the widening of I-5 at Victory Boulevard a decade ago was associated with lower throughput over the I-5 bridges at the peak hour).

That’s why “removing bottlenecks” is a hopeless game of infinite whack-a-mole.  When you enable more cars to travel faster at one point, you simply overload the next downstream point even more quickly, and the traffic jams recur.  Its one of the reasons that widening freeways never reduces congestion; even when you have 23-lanes of freeway, as in Houston.

So the trick in making a freeway maximize its throughput is to keep traffic levels just below this tipping point.  And that’s exactly what the Covid-19 travel restrictions have done on freeways throughout the nation.  (It’s draconian and inefficient to be sure, but it shows how managing demand can make congestion disappear).

Policy implications: Managing demand is the key to reducing congestion

The experience of the past few weeks should be a powerful object lesson in how to effectively fight traffic congestion.  If we manage demand for the roadways at the peak hour to keep traffic volumes below the tipping point, we can get our existing roadways to carry even more traffic than they do now at speeds right up to (and even above) posted speed limits.

You’d think with this revelation in hand, highway departments- especially cash-strapped ones, like ODOT, that face a 20-30% decline in gas tax revenues – would be looking to figure out how to apply the demand management solution so aptly demonstrated here on a daily basis.  And remember, this doesn’t mean a dramatic reduction in total traffic, it just means keeping the volume at any one time from exceeding the freeways carrying capacity.

But what we hear from ODOT is just the sound of more bulldozers.  Even in the face of demonstrable evidence about how to solve congestion without spending a dime on concrete or asphalt, they’re reading to march forward with a billion dollar freeway widening project on I-5 at the Rose Quarter–one, which without pricing or other demand management will simply increase congestion and pollution.

What this really shows is that their protestations to the contrary, highway engineers actually don’t give a damn about traffic congestion.  Who builds a multi-billion dollar capital asset and then does nothing at all to manage its use, and in fact, allows it to regularly become monumentally inefficient by being overwhelmed by demand on a daily basis?  A whole range of measures are available to traffic engineers, if they chose, to make the system work more smoothly, and deliver a better experience for all users.  As economists have long pointed out, even a modest price for using the roadway at the peak hour would prompt some users to defer trips, take other modes, or take other routes, and would actually increase our well-being.

Congestion Pricing:  What the Covid-19 traffic experience demonstrates is that pricing the roadway would not be an additional cost for road users, but rather it would generate huge benefits in terms of faster travel and better utilization of the roadway.   Its a powerful argument for road pricing. A system of time-varying tolls for the freeway system would encourage some people to re-arrange their trip taking in a way that always kept the freeway from exceeding its tipping point.  In this way, pricing provides what the British call “value for money”–if you pay a peak hour charge, you get a road system that works better for you and everyone else.

Managing Demand:  Pricing may be the best and most powerful tool for making roads efficient, but its far from the only one.  Every freeway in the region is, by definition “limited access.”  Most freeway ramps in Portland have “ramp meters”–traffic signals that restrict the number of cars that can get on the freeway.  The logic of ramp metering is drawn from the same underlying observations about the unstable, non-linear speed volume relationship shown above.  Ramp meters are designed to keep too many cars from crowding onto the freeway all at once and producing these jams.  But most ramp metering is timid, with fixed intervals (one vehicle every 5-10 seconds, regardless of how backed up or free flowing the freeway is).  Tougher metering, including allowing traffic to back up on on-ramps in order to keep the freeway moving, would produce higher levels of traffic flow).  Likewise, the highway agency could consider simply closing some ramps at the peak hour.  One logical candidate is the I-5 Jantzen Beach on-ramp to Northbound I-5.  This short, sub-standard ramp essentially lets traffic from the Jantzen Beach shopping center clog up the flow of traffic onto the I-5 bridges and is a major source of the initial delays that trigger daily slowdowns.  It’s also no coincidence that the improvement in I-5 traffic conditions coincides with the big decline in shopping trips to Jantzen Beach.

Here, in the midst of the Covid-19 Pandemic is an illuminating natural experiment that shows how, with a little ingenuity in the form of demand management, we could make our transportation system work much, much better, both relieving the annoyance of daily congestion, and providing even more throughput on our expensive infrastructure. If we’re smart, we’ll learn from this experiment and choose to manage our road system in a way that provides benefits for everyone, rather than simply throwing more billions at wasteful road-widening projects that do nothing to resolve the fundamental cause of traffic congestion.

Why suburbs aren’t safer from the pandemic than cities

Whether you live in a city its suburbs, your metro area is the biggest geographic factor in variations in Covid-19 rates

Suburban incidence is lower, but there’s about a six-day difference between the reported rate of Covid-19 cases per capita between a city and its suburbs.

About 40 percent of suburbs of large metro areas have higher rates of reported cases per capita than found in the central cities of 40 percent of metro areas.

Earlier, we addressed some flames fueled by a recent New York Times article that implied that fear of the Covid-19 virus and possible future pandemics might prompt people to leave cities for the suburbs and rural areas. As we pointed out, that argument is based on the assumption that sprawling suburbs or distant rural areas are systematically less vulnerable to the spread of pandemics. Today, we provide some additional evidence, focusing on a metro-by-metro comparison of city and suburban per capita prevalence rates for the Covid-19 virus.

One of the mantra’s of the metropolitan movement a few years back was whether you lived in a city or a suburb, “we’re all in it together.”  Metropolitan advocates argued that suburbs had a strong self-interest in the (economic) health of their central cities because of the co-dependence between the urban and suburban portions of a metro area.  That’s a theme that deserves an explicit revival in the era of Covid-21—the pandemic doesn’t respect political boundaries within metro areas.

Covid-19 rates in cities and suburbs

There’s a fair amount of data right now that looks, in a highly aggregated way, at the variations in reported cases between central cities and their suburbs, and which attempts to ferret out the relationship between population density and the pandemic’s spread. But in our view, it makes little sense to combine data from all suburbs whether they’re in hard hit New York or Detroit) with data from suburbs in metro areas where the virus is far less prevalent (say Minneapolis or San Antonio).  And the same can be said of central cities.

If we want to compare the pandemic in cities and suburbs, we ought to do it within metropolitan areas, comparing the rates of reported cases in a metro area’s center to the rate of reported cases in that metro area’s suburbs.

There’s a good reason for doing this.  Keep in mind that these are contagious diseases after all, and contagion thrives on interaction. Cities are connected both globally (to other cities around the world) and locally, to their own neighborhoods and to surrounding suburbs and countrysides. Once established the primary transmission of the virus is highly localized.  The significant variations in prevalence are not between cities and suburbs within a metropolitan area, but rather among metropolitan areas.

Metro matters more than city or suburb

The following chart plots, for each of the 53 most populous US metro areas, the rate of reported Covid-19 cases per 100,000 population in cities and their surrounding suburbs.  On this chart, the vertical axis shows the rate of reported Covid-19 cases per 100,000 population in a metro area’s suburban counties, and the horizontal axis shows the number of reported cases per 100,000 in the central county (which we’ll refer to as “city” or “core county.”  (More details on our definitions below).


While suburbs have, on average, somewhat lower reported case counts per 100,000 population, most of the variation is explained by what metro you live in, not whether you’re in a city or suburb.  There’s about a 0.9  correlation (the R² is .86) between the city and suburban prevalence rate, and on average, the suburban rate is about 73 percent as high as the urban rate.  Because New York and New Orleans are outliers, we’ve zoomed in on metro areas with fewer than 500 cases per 100,000 (data are for April 14).  In general there’s a strong correlation.

Most metropolitan areas have higher rates of reported cases per capita in central counties.  Prominent exceptions to this pattern are Boston and Providence, where suburban counties have higher reported cases capita.

A note on definitions here:  because Covid-19 data are available nationally only on a county basis, we’ve used counties to define “central” and “suburban.”  In our rubric, the central county (which we’ll call “city”) is the county that is home to the principal (i.e. first-named) city in a metropolitan area).  So, for example, in Minneapolis-St. Paul, we treat Hennepin County, which includes Minneapolis, as the city, and all other counties in the metropolitan area as suburbs. Our analysis includes 48 of the 53 metro areas with one million or more population (i.e. all that have both city and suburban counties).

Many suburbs have rates higher than central cities; on average suburbs are less than a week-behind their center cities in cases per capita

What this means is that it really matters much more whether you live in a metro area with a high incidence of Covid-19 than whether you live in a city or a suburb.  For example, let’s use a cutoff of 100 reported Covid-19 cases per 100,000 (on April 14) as a benchmark.  Suburban counties in about 40 percent of large metros have higher rates of reported cases per capita than in the central cities of the a similar share of large metros. Slightly more than half of all central counties (29 of 53) had rates of reported cases higher than this level.  And 20 of 53 suburban areas rates higher than 100 per 100,000.  This means that central counties in 24 metro areas had lower rates of reported cases than in the suburban counties of 20 other metro areas.

Given the steady spread of the virus, how big is the difference between the city and suburb prevalence?  One way to think about this, given the rapid daily growth in the number of reported cases, is to consider how many days behind the central county suburban counties are in the progression of the pandemic.  In the aggregate for large metro areas the median city rate of about 91 cases per 100,000.  The suburbs of those cities have an average rate of about 67 cases per 100,000.  At an average daily growth rate of about 5.1 percent in cases (which was the average daily rate for the week ending April 14, there was, on average, about an six day difference between the time the central city experienced a given rate of prevalence and its surrounding suburbs equalled that rate of prevalence.

There may be a variety of reasons why cities might have higher rates of reported cases. Cities may have more vulnerable populations, and higher concentrations of people with limited access to medical care. Its been widely noted that there have been severe outbreaks in correctional facilities and nursing homes, which may be disproportionately concentrated in central counties. It’s also worth noting that what region of the country your metro is located in is likely to strongly influence your risk, regardless of whether you live in a city or suburb.  As we’ve noted, reported cases per capita are higher in metros throughout the Northeast Corridor, and in two of these metros—Boston and Providence—there are higher rates of cases per capita in the suburbs than the central city.

Finally, we need to note that some of what’s driving our analysis (and that of others) is different definitions of what constitutes “urban,” “suburban” and “rural” counties.  Some of our friends and colleagues—Bill Bishop at Yonder, Jed Kolko of Indeed. and Bill Frey at the Brookings Institution—come to somewhat different conclusions about the urban/suburban/rural pattern of Covid-19 cases.  We’re taking a close look at all the differing definitions–and their implications–which we’ll address in a future commentary.

Regional Pandemic Hotspots: NE Corridor and Great Lakes

Originally published April 12; Revised and Corrected April 14

The Covid-19 pandemic is hitting two regions in the US much harder than others:  The NE Corridor and the Great Lakes

Metro areas in these regions have the highest rates of reported cases per capita, and the highest levels of growth

In contrast, incidence and growth rates are subdued in the South and West.

At City Observatory, we’ve been tracking the spread of the Covid-19 pandemic among the nation’s 53 largest metropolitan areas since the middle of March.  Our emphasis has been on identifying the incidence (reported cases per 100,000 population) and the growth (the daily growth rate averaged over the previous seven days), as a way of establishing which cities have been hardest hit, and which ones seem to be making progress in flattening the curve. Today, we step back and look at the regional geography of the incidence and growth of the pandemic:  What regional patterns do we observe in where the virus is spreading most rapidly.  As always, the usual caveats about the ambiguity of reported case data apply:  Testing isn’t done randomly, and is constrained by testing capacity, and is conditioned by medical necessity.  As a result, reported case data don’t necessarily accurately reflect the actual number of cases in a city or region.

The national pattern

Our core measure of the incidence of Covid-19 is the number of reported cases per 100,000.  We’ve mapped them for April 13 here:


Shaded areas depict each of the nation’s 53 most populous metropolitan areas (all those with a million or more residents).  Darker red shading indicates metro areas with the highest rates of reported cases per capita; the numbers superimposed on the shaded areas are the number of cases per 100,000 reported through April 13, 2020, according to the county level data compiled by The New York Times.  As this map makes clear, the pandemic has affected the entire nation, but the incidence of the virus seems much higher in some places than others.

There are a couple of somewhat isolated hotspots.  Seattle was the site of the first significant outbreak, and still ranks among the top twelve in cases per capita.  New Orleans has the second most serious outbreak of the disease (with about 1,048 cases per 100,000).  Interestingly, however, nearby metros are far less affected.  Portland (less than 200 miles from Seattle) has a rate of reported cases (41) that is in the bottom quartile of large metros; similarly Houston (350 miles from New Orleans) has a rate of reported cases (75) that is slightly below the median.

The Northeast Corridor

As The New York Times has said, New York City is the epicenter of the pandemic.  and a quick look at nearby metro areas suggests that proximity to New York City may be a factor explaining the spread of the virus. As this map focusing on the Northeastern United States makes clear, all of the metropolitan areas in the Northeast Corridor (i.e. between Washington and Boston) have above median levels of reported Covid-19 cases per capita.


Six Northeast Corridor metros rank in the top eleven for cases per capita:  New York is first, Boston is fourth, Philadelphia is fifth, and Hartford is seventh, Washington is ninth and Providence is eleventh. The following chart shows the top 12 metro areas for incidence of reported Covid-19 cases per capita on April 13.

What is particularly disconcerting about the high rates of reported cases per capita in the Northeast Corridor is that several of these cities are also seeing their rate of increase in the number of reported cases continuing to be higher than the national average.  Among all large metro areas, we estimate that the daily rate of increase for the week ending April 13 averaged about 6.9 percent.  While New York has lowered its rate of increase to this level, other NE Corridor metros are growing faster:  Boston and Philadelphia (10 percent), Providence (11 percent), Washington (12 percent) and Hartford (14 percent).  The combination of faster growth in reported cases and a higher incidence per capita puts them in the upper right hand quadrant of our classification of metros according the the incidence and growth of the virus.


The Great Lakes Region:  Detroit, Indianapolis, Chicago

Three metro area in the Great Lakes region have levels of reported Covid-19 cases per capita that are in the top ten of all large metro areas.  Detroit is third (478 per 100,000), Indianapolis is sixth (245) and Chicago is seventh (226).  Milwaukee’s rate (134) is above the median as well. Other nearby metro areas have rates of reported cases that are at or below the median, including Cleveland (82) , Grand Rapids (41), and Columbus (69).  Unlike the hard hit cities in the Northeast Corridor, the growth rate of reported cases in Detroit (6 percent), Indianapolis (6 percent) is slightly below the national average of 6.9 percent , and at 8 percent Chicago’s is still higher.


There appear to be emerging and persistent regional differences in the spread of the Covid-19 pandemic.  In general, metro areas in the West and South have seen lower incidence of cases, and in the past several weeks, slower growth in new reported cases than the rest of the country.  Meanwhile, as described here, cities in the Northeast Corridor and several cities in the Great Lakes region have experienced the highest incidence of reported cases, and continue to experience higher than average levels of growth.  At this point, we don’t have an explanation for this regional disparity, but as our knowledge about the pandemic grows, it bears closer investigation.

Note:  This post has been revised to include data for April 13.  The original post contained an incorrect estimate of cases per capita in the New York metropolitan area.  For more information, see our daily tabulation of metro area data.

A Note on Covid-19 Case Data

Reported case data correlate strongly with Covid-19 deaths, and provide a reasonable basis for assessing the geographic pattern of the pandemic across US metro areas.

A critical question in judging the state of the Covid-19 pandemic is understanding how many people have the virus, and how fast it is spreading.  Because of a shortage of testing capacity, because of medical prioritization of testing, and because we simply aren’t testing people randomly, we can’t be sure how many people actually have the virus, which is problematic because many who are infected are asymptomatic, and at the same time, contagious.  What that means is, that as some very sharp analysts like Nate Silver have pointed out, their are real limitations to the case data.

At City Observatory, we’ve been using the case data with open-eyes about the limits of the data. We’ve restricted our analysis of data to compiling metropolitan area estimates of the cumulative number of cases and the daily growth rate in reported cases (averaged over a 7-day period).  Our purpose with these estimates is to better understand the relative geographic incidence of the pandemic across large metro areas.  That’s a less challenging task that estimating the “true” number of infected persons.

Its highly likely that the reported cases in any metro area are influenced by testing capacity, medical decisions (i.e. not testing obviously sick persons when tests are in short supply), and other factors. There are also lags in daily reporting that may influence statistics.

The best way we have of validating the reliability of the case data for the purpose of geographic comparisons is to ask how well they correlate with other objective measures of the relative geography of Covid-19.  Arguably, reported deaths attributed to Covid-19, though far less numerous than cases, may be a more reliable measure, albeit a lagging one.  These mortality statistics are less likely to be affected by other factors (like lack of tests), and systematic under-counting.  As Nate Silver recommends, you’ve got to look beyond the case counts to more robust measures of how the diseases is progressing, which is what the death data tell us:

I hope you’ll be a more educated consumer of COVID-19 data instead of just looking at case counts ticking upward on cable news screens without context. That context includes not only reporting about the amount of testing, but also indications such as hospital strain, which are more robust since they aren’t subject to as many vagaries about how tests are conducted.

So, how do reported cases compare to deaths?  Here we plot the number of reported cases per 100,000 population against the number of reported deaths per 100,000 population for US metro areas with one million or more population.

There is an extremely strong correlation between the two figures: the coefficient of determination is 0.91.  The regression line implies an overall death rate of about 4 percent of reported cases.  As we’ve already stipulated, that’s not necessarily a valid estimate of the death rate for those infected, because testing may systematically under-estimate the total number of persons infected by the virus.  But this very high level of correlation suggests that, despite the vagaries of the testing process, the reported number of tests in a metropolitan area is a good predictor of the number of deaths due to Covid-19.

We get similarly strong correlations whether we look at state-level data (the coefficient of determination is also 0.91 between tests per capita and deaths per capita for states, and also for counties (restricting our sample to counties with a population of 100,000 or more produces an r-squared value of 0.82.

Other research finds similar symmetries among these data sources. Jeffrey Harris, in a new paper focusing on New York, examines the various indicators of the pandemic and concludes that there is sufficient evidence to conclude that the curve is flattening.  He writes:

As in the case of most pandemics, scientists and public officials don’t have complete, accurate, real-time data on the path of new infections. Despite these data inadequacies, there already appears to be sufficient evidence to conclude that the curve in New York City is indeed flattening.

His analysis shows that tests and cases closely track hospitalizations:

For what it’s worth, other analysts, including The New York Times (from which we draw our county-level data), Indeed’s Jed Kolko, and Yonder’s Bill Bishop and Tim Marrena, and the Marron Institute’s Solly Angel and his colleagues are also making use of these county level estimates to assess the relative geographic prevalence of the virus across the US.

There’s a lot case data can’t tell us about the true breadth of the pandemic and the actual number of people now infected.  But for the narrow purpose to which we’ve put the data at City Observatory:  estimating the variation in the pandemic’s prevalence across large metropolitan areas, we’re confident that it provides a good deal more signal than noise.


Who’s flattening the curve? Evidence from Seattle & San Jose

Seattle and San Jose had the first outbreaks of Covid-19 but now have the slowest rates of growth of any large US metro area

Their progress seems closely related to the fact that they’ve cut back on travel more than nearly every other metro area.

For the past several weeks, City Observatory has been compiling the data on reported cases of Covid-19 in the nation’s largest metro areas, and like everyone, looking for signs that we’re “flattening the curve”–reducing the explosive exponential rate of growth of the number of cases to levels that won’t overwhelm the nation’s (or any city’s) health care system.

There’s been a lot of attention focused–appropriately so–on the metro areas with the highest number of cases.  New York accounts for more cases (92,000) than any other metro area; but on a population adjusted basis, the pandemic has hit New Orleans about 60 percent harder.  Its rate of reported cases per 100,000 is 856, compared to about 523 in New York.

From the standpoint of understanding how to combat the pandemic, it may be more useful (and more hopeful) to look at metro areas that seem to have made progress in slowing the reported increase in the number of cases.  Just three weeks ago, Seattle and San Jose had the highest rates of reported Covid-19 cases of any large metros in the US.  On March 18, Seattle reported 21 cases per 100,000 residents and San Jose had 9 cases per 100,000, ranking them first and third among the nation’s large metros.

San Jose and Seattle are now slowest growing in reported cases

Today, just three weeks later, both cities have among the lowest rates of growth of the pandemic.  San Jose has the lowest rate of growth (about 5 percent on a daily basis over the past week) and Seattle the second lowest (about 6 percent daily over the past week).  San Jose has also managed to go from having the third highest rate of reported Covid-19 cases per capita, to having the 24th highest of 53 metro areas (essentially at the median).  Seattle is still well above average, but after having more cases per capita than any metro area, it now ranks seventh on this measure among large metro areas. The key has been lowering the rate of increase in the number of cases. The following chart shows Seattle (pink) and San Jose (red) compared to New Orleans, New York and Indianapolis, which have all had higher rates of increase, and have managed slower declines in daily growth.


It’s helpful to look at the incidence (cases per 100,000) and the growth rate at the same time. Our analysis of metro area performance is distilled into this matrix, which shows the incidence of reported cases per capita (on the horizontal axis) and the rate of daily growth in reported cases over the past week in the vertical axis.  Ideally, you want your metropolitan area to be in the lower left-hand corner of this chart (low incidence, and relatively slow growth).  San Jose arguably has the second best performance after Minneapolis on our combined measures.  Seattle, as noted, has the second lowest rate of growth.

This is evidence that Stay-at-Home is working

Why have these two cities performed so (relatively) well?  Part of the reason may be the effectiveness of the stay-at-home policies in these two metro areas.  As we examined earlier, location services company Cuebiq is using cell-phone data to measure changes in travel behavior among US counties.  We’ve compiled that data for the principal counties of US metro areas as an indicator of how much travel has declined since the advent of stay-at-home policies in March.  According to our analysis of Cuebiq’s data, Seattle (King County) and San Jose (Santa Clara County) rank number one and number two as the two counties with the biggest declines in travel compared to the typical annual volume.

Seattle and San Jose also rank near the top of the charts according to Google’s parallel measure of visitation of workplaces.  The two cities ranked fifth and sixth respectively, out of the 53 most populous metropolitan areas in reducing workplace related travel.  The strong performance of these cities probably reflects some combination of the effectiveness (and relatively early implementation of these policies) and the fact that with strong high tech sectors and a large well-educated workforce, its likely that a relatively high fraction of workers were readily able work at home.

These are some dark days in the Covid-19 pandemic.  It’s a hopeful sign that two cities that were among the first-hit by the virus have improved their relative position so much in just a few weeks. There’s still a huge amount of work to be done, but their experience suggests that limiting travel and practicing social-distancing can blunt the pandemic’s spread.

Notes

The charts and information presented here on published data from state health departments, aggregated by The New York Times. Please use caution in interpreting these data. It is likely that in some areas, the number of cases is under-reported due to the lack of available testing capacity, or pressing medical conditions.  There are widespread differences in the number of tests administered relative to the size of the population in each state, and tests are not given randomly, and may be restricted solely to persons with symptoms, likely exposure or high risk in some states.  As a result, the ratio of reported to unreported, undiagnosed cases may vary across geography.  Moreover, changes in reported numbers of cases from day to day or week to week may reflect changes in the availability or application of testing over time, rather than the true rate of growth in the number of persons affected. The fact that some places are performing relatively better than others due to reported case data does not mean that the Covid-19 pandemic is under control, or that stay-at-home policies and social distancing are no longer needed.


Staying at home: Estimates for large metro areas

How well are “stay at home” and “shelter in place” policies working in different metro areas?

Big data” from smartphones gives us a picture of how we’re dialing back on travel in response to “stay-at-home” orders to combat the Covid-19 pandemic. We’ve compiled the data from Google and Cuebiq on the variations in travel behavior in the nation’s largest metro areas.

  • Google reports that since mid-February, workplace visits have declined by between a third and a half in nearly all large US metro areas 
  • Cuebiq estimates that its total travel index has fallen by between 25 and 95 percent in large US metro areas, with the typical metro experiencing a decline of about 55 percent.

We’re currently analyzing these data, but have some early observations:

  • Hard hit cities (New York, New Orleans) have big travel declines.
  • Well-educated, tech-oriented cities have consistently high travel declines, possibly reflecting the ability of many workers to work remotely
  • Tourism centers have (Las Vegas, Orlando) have seen declines in travel

Metro areas ranked by decline in travel (Cuebiq)

Cuebiq estimates how much travel has changed in each county in the US compared to the year earlier.  By its estimates, all metro areas have seen declines in its travel index.  Declines range from less than 25 percent in Virginia Beach and Jacksonville to more than 95 percent in New York, Seattle, Portland, San Francisco and Seattle.  The typical large metro area has seen a decline of about 55 percent compared to the year earlier.  (We use data for the most central county in each metro area as a proxy for overall change in travel in that metropolitan area).

Metro areas ranked by decline in workplace visiting (Google)

Google estimates how much visiting to workplaces had changed between the middle of February and the end of March.  By its estimates, workplace visits have declined in all metro areas.  Declines range from as little as 33 percent in Jacksonville, Memphis and Phoenix to more than 50 percent in New York, New Orleans, and San Francisco.  The typical large metro has seen a decline of about 40 percent compared to February.  (We use data for the most central county in each metro area as a proxy for overall change in travel in that metropolitan area).

Comparing the Google and Cuebiq estimates

There are obvious differences in definitions, methodology and measures between Google and Cuebiq.  As the above summary suggests, the percentage decline in travel as measured by Cuebiq is considerably greater in magnitude than the percentage change in workplace visitation as measured by Google.  The following chart shows the estimated change in the travel index for each metro (per Cuebiq) compared to the average change in workplace visitation (per Google).

Overall, there’s a reasonable correlation between the two measures.  Cities that rank high on the Google index, also rank high on the Cuebiq index.  Statistically, the coefficient of determination (R2) between the two series is .19.

Some Initial Findings

Hard hit cities show big declines.  New York and New Orleans show large declines on both indices.  New Orleans ranks first in cases per 100,000, and has the third largest decline in workplace visitation according to Google.  Cuebiq estimates that New York has seen a 95 percent reduction it its travel index; Google ranks it number one for reduction in workplace visitation. It seems likely that the higher level of concern in these areas due to the prevalence of reported cases gives people strong incentives to avoid travel.

Well-educated, tech-oriented cities seem to have high levels of travel reduction.  The top of both the Google and Cuebiq lists are dominated by the nation’s tech centers including San Jose, San Francisco, Seattle, Portland, San Diego, Denver, Washington.  This may reflect a high level of awareness and concern about the Covid-19 pandemic, and the ability and proficiency to work remotely. The lower-left hand corner of our scatter chart comparing the Google and Cuebiq estimates (which represents cities with the biggest declines on both indices, is populated by this well-educated tech centers.

The hit to tourism is apparent:  Las Vegas and Orlando are striking outliers in our analysis of the Google data, with large declines in total travel (which may directly reflect lower visitor counts) and indirectly, from layoffs in accommodations, food service, travel, and entertainment businesses.  The industry sector with the largest declines in employment appears to be accommodations and food service; it’s no surprise that metro areas heavily dependent on these industries would experience larger declines in associated travel.

These are just our first initial impressions:  We’ll be digging into this data in future commentaries, so stay tuned.

About the Data

This commentary draws on two sources of data:  Google’s “community mobility reports” and Cuebiq’s “mobility index”.  Both of these reports are based on these company’s analyses of data from smart phone and other device users.  Cuebiq tracks the trips we take, and has an index of total daily travel per person (really, per device) for the nation’s counties.  It’s unclear whether this is a distance measure or a count of trips, or some other measure. Google has aggregated and anonymized user location data to measure (apparently) the amount of time we spend or number of trips we make to various locations.  (We say “apparently” because Google’s explanation of its measures and methodology is quite vague.)  It, too, reports data for counties.

Because we focus on metropolitan areas, we used data for the central county in each large metropolitan area as an indicator for the entire metropolitan region.  Unfortunately, in our view, neither Google nor Cuebiq enable users to download their county level data in a machine readable format, such as CSV.  Consequently, assembling these county level estimates requires laboriously clicking through their interfaces (Tableau for Cuebiq and PDF for Google) and manually transcribing the data, and then entering it into a database for analysis.  (Our apologies if there are any transcription errors:  they could be avoided, and this data would be of infinitely greater value if both companies would release machine readable versions of their reports.  In the public interest, we call on them to do so at their earliest opportunity).

Google Community Mobility Reports

Google has started publishing “Community Mobility Reports” that tap the location data from smart phones to measure the approximate number of trips we take to various destinations.  Data are available at the county level (subject to minimum data requirements), and are available for six broad categories  destinations such as retail, recreation, work, home, and parks.  As this screenshot for Portland’s Multnomah County shows, work trips are down about 41 percent, retail trips are down more than 60 percent and grocery/pharmacy trips are down about 30 percent compared to a pre-pandemic baseline.


Google produces separate estimates for the percentage change in “visiting” at each of six categories of destinations between February 16 and March 29.  Google’s six categories are workplaces, retail shops, grocery and drugstores, parks, transit centers, and residences.  Google’s data show universal decreases for time spent at work, in stores of all kinds and in transit centers.  They show an increase in time spent in residences.  The pattern for time spent in parks varies across metropolitan areas (and over time, within metropolitan areas) with a wide range of increases and decreases.Its a very exiting and useful dataset, but inexplicably, Google has chosen to make it available only as a series of state-by-state PDF files, which make it extremely tedious for linking to other research.

Cuebiq Mobility Index Analysis

We examine Cuebiq‘s estimates of the total percentage change in its travel index between what it calls the “delta versus yearly average” (unclear whether this is 2019, 2020 or some other base period), and the estimated index for the current week (in this case the week ending March 30).  Cuebiq’s estimates show a pattern of universal declines in travel for all metro areas we examined.


What cities tell us about the trajectory of the pandemic

Each metro area represents a different instance of the Covid-19 pandemic; we can use the varied experiences and timing of the virus in each metro area to better understand where we’re headed.

Seattle is 10 days to 2 weeks ahead of the rest of the country and signals our possible future trajectory

Growth rates are falling, and are down about half over the past two weeks.  If Seattle’s experience is indicative, we can hope that the daily growth rate in the typical large metro area falls from about 16 percent today, to about 8 percent by Mid-April.  This decline would increase the doubling time in the number of cases from doubling every 4.3 days to doubling every 8.6 days.

Minneapolis-St. Paul has done the best job of avoiding the pandemic; it has the lowest rate of reported cases per 100,000 of any US metro area, and is maintaining a relative low growth rate

At City Observatory, we’ve been tracking the growth of the Covid-19 pandemic across the nation’s metropolitan areas for the past two weeks. We’ve taken the data that’s usually reported at the county level (or aggregated to the state level) and produced estimates for each of the nation’s 53 largest metro areas (those with a population of one million or more).  Each metro area represents a distinct instance of the pandemic, and by observing the similarities and differences between the experiences of these metropolitan areas we can gain some insights about where we might be headed.  This commentary explores some possible themes.

Declining growth rates

The key to “flattening the curve” is to lower the rate of growth of new cases of Covid-19.  Our attention should be greatly focused on lowering this rate of increase.  Here we’ve tracked the average daily increase over the past week for the 53 largest metro areas; each line represents a metropolitan area.  The good news, especially in the past ten days, is that all of these lines are sloping down:  every metro area is experiencing lower daily growth over the past week than it was two or more weeks ago.  The big question going forward is whether we can continue this progress, and how quickly we can drive the growth rate even lower.


Pay particular attention to the red dotted line on this chart.  Here, we’ve tracked the median growth rate of these 53 metro areas (essentially, what is the growth rate that half of all metro areas are above and half below, on a given day).  On March 21, the median metropolitan area had experienced about a 36 percent daily increase in cases over the past week.  By April 3, two weeks later, the daily growth rate in the median metro area over the past week had declined to about 16 percent.  That’s a very positive development.  The key question is whether it is likely to be sustained. Digging deeper, perhaps we can find an answer.

Seattle:  The leader of the pack

The first death to Covid-19 was in Washington and Seattle emerged as the nation’s , and Seattle became the nation’s first hotspot in early March.  Through the first half of March, Seattle had the highest rate of reported cases in the nation.  It was also one of the first places to implement stay-at-home policies. According to travel tracking firm Inrix, Seattle recorded a sharp decline in traffic levels on March 5, fully nine days before nearly every other large metropolitan area..  So in important key respects, Seattle is a week or two ahead of the rest of the nation’s cities, both in experiencing the spread of the virus and in implementing counter-measures.  What can we learn from its experience walking point in the pandemic?

Here’s our same chart as above, with the values for all but one metro area faded out, and with Seattle’s daily growth values highlighted.  You can see that at the start of this period, Seattle’s growth rate was about 15 percent, and that by April 3, the growth rate had declined to about 7 percent.  In a sense, on March 21, Seattle was almost where the median metropolitan area is today.  Seattle had about 38 cases per capita (the median metro on April 3 had 41).  Seattle’s daily growth rate over the previous week was 15 percent, compared to the median metro on April 3, which had a growth rate of 16 percent).

Seattle’s experience may foreshadow the path that other cities are likely to follow.  As a hypothetical, we consider what happens if other US cities, on average, tend to follow Seattle’s path in the next few weeks.  If Seattle’s trajectory is a guide, we should expect the average daily growth rate in cases over the previous week to fall from about 16 percent to about 8 percent by mid-April.  The slower growth rate lengthens the amount of time it takes for the number of cases to double; at 16 percent the doubling period is a little over four days; at 8 percent that extends to about eight days.  If Seattle’s experience is a guide, many US cities will have between 100 and 200 reported cases 100,000 population in mid-April.

Also, because Seattle is ahead of the curve, the experience their bears careful watching.  Do daily growth rates continue to to decline, or will the downward trend flatten out?  If Seattle continues to see declines in its daily growth rate, that would be a very positive sign for the rest of the nation.

Who’s doing well?

One of our most useful analytical tools is this four-quadrant diagram showing the incidence of reported Covid-19 cases in each metro area (per 100,000 population) and the average daily growth rate in the number of cases over the past week.  Our diagram puts the rate of incidence on the horizontal axis (metros with more cases per capita to the right), and areas with faster increases in cases in the past week on the vertical axis (metros experiencing faster growth are at the top).  The horizontal and vertical lines on the chart show the average incidence and growth rate for the 53 largest metro areas.

Metros in the upper right hand corner have both a higher incidence of reported cases and are experiencing faster growth–this is the red zone.  Metros in the lower left hand corner have both lower incidence of cases and slower growth than average.  These cities are–at least at the time we collected the data–are suffering less from the pandemic than other cities.

The metro in the lower left-hand corner of our chart is Minneapolis-St. Paul.  It arguably has managed (for whatever reason) to keep its incidence low and avoid a rapid growth in the number of cases.  As we try to understand the factors that influence the spread of the virus, we might want to consider what distinguishes the Twin Cities from other American cities.  (And maybe its just that reserved Minnesotans have been perfecting the art of social distancing for decades).  More seriously, Minnesota also ranks extremely high on measures of social capital according to Robert Putnam, (as, for that matter, does Portland, which is also in the lower right hand corner of our chart.)

In addition to Minneapolis St. Paul, other cities that have relatively low rates of reported cases per capita and slower than average growth include Portland, San Jose, San Francisco, Sacramento, Raleigh and Austin.  It’s not clear what characteristics these places have in common, but it may be worth noting that nearly all have above average rates of educational attainment and strong technology industries.

Who’s been worst hit:  New Orleans and New York

Our quadrant diagram makes it clear where the virus has hit hardest.  New York not only has a huge number of cases (62,000 on April 3), but even allowing for the large population of the New York metro area, it has the highest or second highest rate of reported cases per capita.  New Orleans has essentially the same rate of reported cases as of April 3, roughly 570 per 100,000.

These hard hit cities, it seems, should also be the subject of close scrutiny.  What is it about New York and New Orleans that caused the virus to spread as rapidly as it did.  As we’ve noted, both cities had roughly the same rate of reported cases as Seattle on March 20, but since that date, have gone in very different directions.  Seattle had been implementing stay-at-home policies ahead of both of these cities, which is probably a major contributor to their differing trajectories.

In an important sense, the experience of each large US metro area represents a slightly different experiment with the Covid-19 virus.  It strongly behooves us to carefully study the varied timing and paths of the pandemic in each of these places to better understand how to bring the virus under control

The state of the pandemic by metro area

Updated April 29 with data through April 28. 

In geographic terms, the Corona Virus has become the Northeast Corridor Virus:  NE Corridor metros account for 6 of the 8 hardest hit large metros, and have 6 of the 8 highest rates of reported new cases per capita.

#1 NY Metro, #3 Boston, #5 Philadelphia, #6 Hartford, #7 Providence, #8 Washington, rank of large metro areas by cases per 100,000 through April 28.

Among the 53 metro areas with a million or more population:

City Observatory presents here its estimates of the prevalence and recent growth of reported Covid-19 cases in large US metropolitan areas.  We update this page regularly with the most recent available data.  The data on this page was last updated with data on counts of cases through April 28, 2020.  Caution should be used in interpreting these figures.  Case data can vary from the actual incidence of Corona virus infections due to differences in testing regimes and availability across jurisdictions, as well as other factors.  We believe that metro area levels and trends may be a useful geography for understanding the spread and intensity of the pandemic:  most published data are available at only the state or county level.  States are too large to accurately capture the the incidence of the pandemic; and counties are often too variable and too small.  Metro areas capture labor markets and commuting sheds, and are defined consistently, making them more appropriate geographic units for judging the spread of the virus.  As is our common practice at City Observatory, our focus is on metro areas with populations of 1 million or more.

Metro areas ranked by reported Covid-19 cases per 100,000 population

The following chart shows the number of reported cases of Covid-19 cases per 100,000 population is US metropolitan areas with a population of 1 million or more as of April 28, 2020.  Metropolitan data are computed by aggregating county level data available from The New York Times.  Metropolitan areas are ranked highest to lowest according to the number of reported cases per capita.


New York, New Orleans Detroit and Boston have the highest number of cases per capita of US metro areas.  New York has the highest rate of cases per 100,000 population (1,921). New Orleans’s rate is currently 1,251 cases per 100,000. Boston (916) and Detroit (676) rank third and fourth in cases per capita.  The median large metropolitan area has about 164 cases per 100,000 population.

Map of metro areas, reported Covid-19 cases per 100,000 population

The following map illustrates the relative number of reported Covid-19 cases per capita among large US metropolitan areas.  Darker red colors indicate metro areas with the highest reported incidence of cases.  Numbers on each metro area represent cases per 100,000 on April 28.

Our regional analysis shows that the Northeast Corridor has emerged as a significant hotspot for the pandemic, with reported cases per capita and recent growth in the number of reported cases both exceeding the average for all metro areas.

How many new cases?

As our efforts to limit the spread of the pandemic proceed, a key variable is how many new cases are reported each day. This is a somewhat noisy data series because of variability and lags in reporting processes in different places, so these daily number should be interpreted with caution.  This analysis counts the number of new cases reported in the last day per 100,000 population.

As before, we’ve ranked metropolitan areas bases on cases (here new cases) per 100,000 population.  These data are for new cases reported on April 28. The median large metropolitan are reported about 4.8 new cases per 100,000 population, with half of metro areas reporting between 2.8 and 7.1 new cases per 100,000.  The highest rate per 100,000 population of newly reported cases were in Providence (33) Boston (27), Grand Rapids (26) and Philadelphia (25).  Four of the five highest rates of newly reported cases were metro areas in the Northeast corridor.

Growth Rates

A less noisy but somewhat more lagging indicator is looking at the average daily percentage increase in the number of cases over the past week.  We track this indicator over time to see which cities have made progress in reducing the growth rate of the number of reported cases.  This chart shows growth rates for the metro areas with the greatest prevalence of reported Covid-19 cases.

Rates are trending down for nearly all cities, but still must continue to fall further to blunt the pandemic.

Prevalence versus Growth

The severity of the pandemic in any location can be summarized by looking at two factors:  the overall cumulative number of cases per capita and the current rate of growth in the number of reported cases. Here we’ve plotted the current prevalence of reported cases in each metropolitan area (shown on the horizontal axis) against the growth rate of reported cases in the past week in that metropolitan area (on the vertical axis).  The number of cases in each metropolitan area is proportional to the size of the circle representing each metro area.  You can mouse-over individual circles on the chart to fully identify each metro area, and see the underlying data for numbers of cases, cases per 100,000 and the growth rate in cases over the last week.

We’ve used the means of the two variables (growth rate (3.5 percent daily) and number of reported cases per 100,000 (269), to divide the chart into four quadrants. These quadrants help sort out which metro areas are experiencing the crisis to a greater or lesser degree.  Metro areas in the upper right hand quadrant are clearly most afflicted:  they have both higher than average rates of cases per capita and are growing faster than the average metro area (in the past week).  The lower right hand quadrant identifies metro areas with relatively higher rates of reported cases per capita, but slower rates of increase.  Ideally, one wants to be in the lower left hand quadrant (low number of cases per capita, low growth rate).  The upper left hand quadrant is uncertain, but with cause for concern:  these cities (so far) have lower rates of cases per capita, but are seeing the virus spread faster than in the average metro area.  Over time, the strategy of flattening the curve should lead individual metropolitan areas to progress from the upper left hand quadrant (low rates and fast growth) to the lower right hand quadrant (higher than average rates but a slower rate of growth).

To make this picture a bit clearer, we’ve shortened the horizontal scale to exclude cities with the highest numbers of cases per capita.  This chart makes it clearer which cities are in which quadrants.

Notes and revisions

This post updates and supersedes our earlier posts with data through April 28. Data for our analysis comes from The New York Times database of county level reported Covid-19 cases.

The charts and information presented here on published data from state health departments, aggregated by The New York Times. Please use caution in interpreting these data. It is likely that in some areas, the number of cases is under-reported due to the lack of available testing capacity, or pressing medical conditions.  There are widespread differences in the number of tests administered relative to the size of the population in each state, and tests are not given randomly, and may be restricted solely to persons with symptoms, likely exposure or high risk in some states.  As a result, the ratio of reported to unreported, undiagnosed cases may vary across geography.  Moreover, changes in reported numbers of cases from day to day or week to week may reflect changes in the availability or application of testing over time, rather than the true rate of growth in the number of persons affected.

Covid-19 Prevalence by Metro Area (April 17 data)

REVISED April  18; Data through April 17, 2020

Among the 53 metro areas with a million or more population:

City Observatory presents here its estimates of the prevalence and recent growth of reported Covid-19 cases in large US metropolitan areas.  We update this page regularly with the most recent available data.  The data on this page was last updated with data on counts of cases through April 17, 2020.  Caution should be used in interpreting these figures.  Case data can vary from the actual incidence of Corona virus infections due to differences in testing regimes and availability across jurisdictions, as well as other factors.  We believe that metro area levels and trends may be a useful geography for understanding the spread and intensity of the pandemic:  most published data are available at only the state or county level.  States are too large to accurately capture the the incidence of the pandemic; and counties are often too variable and too small.  Metro areas capture labor markets and commuting sheds, and are defined consistently, making them more appropriate geographic units for judging the spread of the virus.  As is our common practice at City Observatory, our focus is on metro areas with populations of 1 million or more.

Metro areas ranked by reported Covid-19 cases per 100,000 population

The following chart shows the number of reported cases of Covid-19 cases per 100,000 population is US metropolitan areas with a population of 1 million or more as of April 17, 2020.  Metropolitan data are computed by aggregating county level data available from The New York Times.  Metropolitan areas are ranked highest to lowest according to the number of reported cases per capita.


New York, New Orleans Detroit and Boston have the highest number of cases per capita of US metro areas.  New York has the highest rate of cases per 100,000 population (1,469). New Orleans’s rate is currently 1,120 cases per 100,000. Detroit (563) and Boston (538) have the next highest rates of reported cases. Philadelphia (347) and Providence (309)  rank fifth and sixth; Hartford (306) is seventh.  Seattle, which had the most reported cases per 100,000 of any metro in Mid-March is now twelfth (204).  The median large metropolitan area has about 96 cases per 100,000 population.

Map of metro areas, reported Covid-19 cases per 100,000 population

The following map illustrates the relative number of reported Covid-19 cases per capita among large US metropolitan areas.  Darker red colors indicate metro areas with the highest reported incidence of cases.  Numbers on each metro area represent cases per 100,000 on April 14.

Our regional analysis shows that the Northeast Corridor has emerged as a significant hotspot for the pandemic, with reported cases per capita and recent growth in the number of reported cases both exceeding the average for all metro areas.

Growth rates in the number of cases

The key strategy in fighting the Covid-19 pandemic is using social distancing to slow the rate of transmission of the virus.  A key indicator of whether we are “flattening the curve” is whether the growth rate of the number of cases is increasing or decreasing.  The following chart shows the growth in the number of cases for selected metropolitan areas from March 27 through April 17.

The growth rates of the four cities with the highest rates of reported cases per capita paint divergent and interesting patterns of the pandemic.  For a time, Seattle had the highest rate of cases per capita of any US city.  That has changed in the past two weeks.  New York, New Orleans, and Detroit have surpassed Seattle.  On March 19, Seattle, New York and New Orleans all had nearly the same number of reported cases per 100,000 (about 30 per capita).  Since then, their growth paths have diverged:  New Orleans has grown most rapidly, followed by New York; Seattle’s growth has been subdued.  Meanwhile, over that same period of time, the growth of cases in Detroit has increased sharply:  On March 18, Detroit had just 1.4 reported cases per 100,000 population, essentially the same as the median of all large metro areas.  By March 29, that had increased to 108 cases per 100,000; the third highest rate among large US metro areas.

To put the spread of the pandemic in context, it is worth noting on March 16, no large US metro had a prevalence of reported Covid-19 cases of more than 15 per 100,000 population (Seattle was 12.2).  Today, all of the nation’s largest metro areas have a reported prevalence of more than 15 cases per 100,000.  Over the past few weeks,  it appears that there’s about two weeks difference between the worst afflicted metro, and the typical large metro.  Whether that continues to be the case depends on the efficacy of social distancing and other measures.

Growth Rates

To more readily compare changes in growth rates over time for individual metropolitan areas, we’ve charted the average daily growth rate over the past week for the period from March 15 to April 17. This chart shows which cities have made progress in reducing the growth rate of the number of reported cases.  This chart shows growth rates for the metro areas with the greatest prevalence of reported Covid-19 cases in March.


Notice that Seattle has succeeded in driving down its average daily rate of increase in cases over the previous seven days, and now has the second lowest rate (2 percent) of daily increase of any large metro area (San Jose’s growth over the past week has also been about 4 percent).  New Orleans has had the lowest rate of increase over the past week, but Louisiana data has exhibited some day-to-day variability. Rates are trending down for nearly all cities, but still must continue to fall further to blunt the pandemic.

Prevalence versus Growth

Slowing or stopping the spread of the virus depends on steadily decreasing the growth rate in the number of cases.  This is especially important as the prevalence of the virus becomes more widespread.  Here we’ve plotted the current prevalence of reported cases in each metropolitan area (shown on the horizontal axis) against the growth rate of reported cases in the past week in that metropolitan area (on the vertical axis).  The number of cases in each metropolitan area is proportional to the size of the circle representing each metro area.  You can mouse-over individual circles on the chart to fully identify each metro area, and see the underlying data for numbers of cases, cases per 100,000 and the growth rate in cases over the last week.

We’ve used the means of the two variables (growth rate (5.1 percent daily) and number of reported cases per 100,000 (185), to divide the chart into four quadrants. These quadrants help sort out which metro areas are experiencing the crisis to a greater or lesser degree.  Metro areas in the upper right hand quadrant are clearly most afflicted:  they have both higher than average rates of cases per capita and are growing faster than the average metro area (in the past week).  The lower right hand quadrant identifies metro areas with relatively higher rates of reported cases per capita, but slower rates of increase.  Ideally, one wants to be in the lower left hand quadrant (low number of cases per capita, low growth rate).  The upper left hand quadrant is uncertain, but with cause for concern:  these cities (so far) have lower rates of cases per capita, but are seeing the virus spread faster than in the average metro area.  Over time, the strategy of flattening the curve should lead individual metropolitan areas to progress from the upper left hand quadrant (low rates and fast growth) to the lower right hand quadrant (higher than average rates but a slower rate of growth).

To make this picture a bit clearer, we’ve shortened the horizontal scale to exclude the five cities–New Orleans, New York, Detroit, Boston and Indianapolis–with the highest numbers of cases per capita.  This chart makes it clearer which cities are in which quadrants.

Notes and revisions

This post updates and supersedes our earlier posts with data through April 14. Please note that we have begun using The New York Times database of county level reported Covid-19 cases effective April 1. All of the data used in this commentary, dating back to January, 2020, is from the NY Times database. Numbers presented in this commentary may differ from estimates presented in previous commentaries because of differences in reporting and aggregation decisions between the two data sources.

We have corrected an error in earlier posts than under-stated the incidence per capita of reported cases in the New York Metropolitan area; New York had the incidence of reported cases, not the second highest as we reported earlier. The correct rate per 100,00 for April 12 was 1194, and not 688 as we originally reported. This error affected earlier posts as well. The method we used to compute the rate per 100,000 by aggregating county data for the New York metropolitan area was incorrect. City Observatory regrets this error.

The charts and information presented here on published data from state health departments, aggregated by The New York Times. Please use caution in interpreting these data. It is likely that in some areas, the number of cases is under-reported due to the lack of available testing capacity, or pressing medical conditions.  There are widespread differences in the number of tests administered relative to the size of the population in each state, and tests are not given randomly, and may be restricted solely to persons with symptoms, likely exposure or high risk in some states.  As a result, the ratio of reported to unreported, undiagnosed cases may vary across geography.  Moreover, changes in reported numbers of cases from day to day or week to week may reflect changes in the availability or application of testing over time, rather than the true rate of growth in the number of persons affected.

Covid-19 Prevalence by Metro Area (April 8 data)

SUPERSEDED:  Please see latest data here.

Original post below is for archival purposes.

REVISED April 9; Data through April 8, 2020

Among the 53 metro areas with a million or more population:

  • The situation in New Orleans is the worst of any large metro area: Its rate of reported cases is now 50 percent higher than in New York and the number of reported cases is increasing 30 percent faster than in the typical metro area.
  • New Orleans, New York, Detroit, Boston and Indianapolis have the highest incidence of pandemic among large metros.
  • New Orleans, Detroit, Boston, Philadelphia and Indianapolis have higher than average incidence, and are experiencing faster than average growth in cases
  • The typical (median) large metropolitan area had a rate of about 64 reported cases per 100,000
  • Half of all metropolitan areas had between 40 and 116 cases per 100,000.
  • The mean rate of increase in the number of cases in large metro areas has increased by about 11 percent per day in the past week.
  • For more information, read our analysis of what the varying experience of different cities tells us about the trajectory of the pandemic, and our explainer on how to interpret these charts.

City Observatory presents here its estimates of the prevalence and recent growth of reported Covid-19 cases in large US metropolitan areas.  We update this page regularly with the most recent available data.  The data on this page was last updated with data on counts of cases through April 8, 2020.  Caution should be used in interpreting these figures.  Case data can vary from the actual incidence of Corona virus infections due to differences in testing regimes and availability across jurisdictions, as well as other factors.  We believe that metro area levels and trends may be a useful geography for understanding the spread and intensity of the pandemic:  most published data are available at only the state or county level.  States are too large to accurately capture the the incidence of the pandemic; and counties are often too variable and too small.  Metro areas capture labor markets and commuting sheds, and are defined consistently, making them more appropriate geographic units for judging the spread of the virus.  As is our common practice at City Observatory, our focus is on metro areas with populations of 1 million or more.

Metro areas ranked by reported Covid-19 cases per 100,000 population

The following chart shows the number of reported cases of Covid-19 cases per 100,000 population is US metropolitan areas with a population of 1 million or more as of April 8, 2020.  Metropolitan data are computed by aggregating county level data available from The New York Times.  Metropolitan areas are ranked highest to lowest according to the number of reported cases per capita.

The progression of the pandemic in March. Our bar chart that shows the growth in the prevalence of reported Covid-19 cases in each metropolitan area since March 1. The controls in the upper left hand corner of the chart allow you to play, stop and examine the animation.

New Orleans, New York, Detroit and Boston have the highest number of cases per capita of US metro areas.  New Orleans’s rate is currently 887 cases per 100,000.  New York (564),  Detroit (384) and Boston (260) have the next highest rates of reported cases. Indianapolis (186) has passed Philadelphia (181) for the fifth most cases.  Seattle, which had the most reported cases per 100,000 of any metro in Mid-March is now seventh (157 cases per 100,000)  The median large metropolitan area has about 64 cases per 100,000 population.

Map of metro areas, reported Covid-19 cases per 100,000 population

The following map illustrates the relative number of reported Covid-19 cases per capita among large US metropolitan areas.  Darker red colors indicate metro areas with the highest reported incidence of cases.  Numbers on each metro area represent cases per 100,000 on April 7.

Growth rates in the number of cases

The key strategy in fighting the Covid-19 pandemic is using social distancing to slow the rate of transmission of the virus.  A key indicator of whether we are “flattening the curve” is whether the growth rate of the number of cases is increasing or decreasing.  The following chart shows the growth in the number of cases for selected metropolitan areas from March 10 through April 8.


The growth rates of the four cities with the highest rates of reported cases per capita paint divergent and interesting patterns of the pandemic.  For a time, Seattle had the highest rate of cases per capita of any US city.  That has changed in the past two weeks.  New York, New Orleans, and Detroit have surpassed Seattle.  On March 19, Seattle, New York and New Orleans all had nearly the same number of reported cases per 100,000 (about 30 per capita).  Since then, their growth paths have diverged:  New Orleans has grown most rapidly, followed by New York; Seattle’s growth has been subdued.  Meanwhile, over that same period of time, the growth of cases in Detroit has increased sharply:  On March 18, Detroit had just 1.4 reported cases per 100,000 population, essentially the same as the median of all large metro areas.  By March 29, that had increased to 108 cases per 100,000; the third highest rate among large US metro areas.

To put the spread of the pandemic in context, it is worth noting on March 16, no large US metro had a prevalence of reported Covid-19 cases of more than 15 per 100,000 population (Seattle was 12.2).  Today, all of the nation’s largest metro areas have a reported prevalence of more than 15 cases per 100,000.  Over the past few weeks,  it appears that there’s about two weeks difference between the worst afflicted metro, and the typical large metro.  Whether that continues to be the case depends on the efficacy of social distancing and other measures.

Growth Rates

To more readily compare changes in growth rates over time for individual metropolitan areas, we’ve charted the average daily growth rate over the past week for the period from March 8 to April 8. This chart shows which cities have made progress in reducing the growth rate of the number of reported cases.  This chart shows growth rates for the metro areas with the greatest prevalence of reported Covid-19 cases in March.

Notice that Seattle has succeed in driving down its average daily rate of increase in cases over the previous seven days, and now has the second lowest rate (6 percent) of daily increase of any large metro area (San Jose’s growth over the past week has been about 5 percent).  Rates are trending down for nearly all cities, but still must fall much further to blunt the pandemic.

Prevalence versus Growth

Slowing or stopping the spread of the virus depends on steadily decreasing the growth rate in the number of cases.  This is especially important as the prevalence of the virus becomes more widespread.  Here we’ve plotted the current prevalence of reported cases in each metropolitan area (shown on the horizontal axis) against the growth rate of reported cases in the past week in that metropolitan area (on the vertical axis).  The number of cases in each metropolitan area is proportional to the size of the circle representing each metro area.  You can mouse-over individual circles on the chart to fully identify each metro area, and see the underlying data for numbers of cases, cases per 100,000 and the growth rate in cases over the last week.

We’ve used the means of the two variables (growth rate (11 percent daily) and number of reported cases per 100,000 (108), to divide the chart into four quadrants. These quadrants help sort out which metro areas are experiencing the crisis to a greater or lesser degree.  Metro areas in the upper right hand quadrant are clearly most afflicted:  they have both higher than average rates of cases per capita and are growing faster than the average metro area (in the past week).  The lower right hand quadrant identifies metro areas with relatively higher rates of reported cases per capita, but slower rates of increase.  Ideally, one wants to be in the lower left hand quadrant (low number of cases per capita, low growth rate).  The upper left hand quadrant is uncertain, but with cause for concern:  these cities (so far) have lower rates of cases per capita, but are seeing the virus spread faster than in the average metro area.  Over time, the strategy of flattening the curve should lead individual metropolitan areas to progress from the upper left hand quadrant (low rates and fast growth) to the lower right hand quadrant (higher than average rates but a slower rate of growth).

To make this picture a bit clearer, we’ve shortened the horizontal scale to exclude the four cities–New Orleans, New York, Detroit and Boston–with the highest numbers of cases per capita.  This chart makes it clearer which cities are in which quadrants.


Notes and revisions

This post updates and supersedes our earlier posts with data through April 8. Please note that we have begun using The New York Times database of county level reported Covid-19 cases effective April 1. All of the data used in this commentary, dating back to January, 2020, is from the NY Times database. Numbers presented in this commentary may differ from estimates presented in previous commentaries because of differences in reporting and aggregation decisions between the two data sources.

The charts and information presented here on published data from state health departments, aggregated by The New York Times. Please use caution in interpreting these data. It is likely that in some areas, the number of cases is under-reported due to the lack of available testing capacity, or pressing medical conditions.  There are widespread differences in the number of tests administered relative to the size of the population in each state, and tests are not given randomly, and may be restricted solely to persons with symptoms, likely exposure or high risk in some states.  As a result, the ratio of reported to unreported, undiagnosed cases may vary across geography.  Moreover, changes in reported numbers of cases from day to day or week to week may reflect changes in the availability or application of testing over time, rather than the true rate of growth in the number of persons affected.

Covid-19 Prevalence by Metro Area (April 2 data)

UPDATED April 3, 2020

Among the 53 metro areas with a million or more population:

  • New Orleans, New York, Detroit, Boston and Seattle have the highest incidence of pandemic among large metros.
  • New Orleans rate of reported cases has surged past New York; Seattle’s rate of new cases has declined to the lowest level among large metro areas; 
  • Detroit, Boston, Philadelphia, Miami and Indianapolis have higher than average incidence, and are experiencing faster than average growth in cases
  • New Orleans had the highest level of reported cases per 100,000:  514
  • The typical (median) large metropolitan area had a rate of about 36 cases per 100,000
  • Half of all metropolitan areas had between 23 and 65 cases per 100,000.
  • The number of cases in the typical (median) metro area has increased by about 18 percent per day in the past week.
  • The typical metro is only about 1-2 weeks behind leading cities in the progression of the virus.
  • For more information on how to interpret these charts, read our explainer.
  • Important Note:  Beginning  April 1, we have changed our source of data for county level estimates to those produced by The New York Times; the number of reported cases differs from estimates produced by our previous source.

City Observatory presents here its estimates of the prevalence and recent growth of reported Covid-19 cases in large US metropolitan areas.  We update this page regularly with the most recent available data.  The data on this page was last updated with data on counts of cases through April 2, 2020.  Caution should be used in interpreting these figures.  Case data can vary from the actual incidence of Corona virus infections due to differences in testing regimes and availability across jurisdictions, as well as other factors.  We believe that metro area levels and trends may be a useful geography for understanding the spread and intensity of the pandemic:  most published data are available at only the state or county level.  States are too large to accurately capture the the incidence of the pandemic; and counties are often too variable and too small.  Metro areas capture labor markets and commuting sheds, and are defined consistently, making them more appropriate geographic units for judging the spread of the virus.  As is our common practice at City Observatory, our focus is on metro areas with populations of 1 million or more.

Metro areas ranked by reported Covid-19 cases per 100,000 population

The following chart shows the number of reported cases of Covid-19 cases per 100,000 population is US metropolitan areas with a population of 1 million or more as of April 2, 2020.  Metropolitan data are computed by aggregating county level data available from The New York Times.  Metropolitan areas are ranked highest to lowest according to the number of reported cases per capita.

The progression of the pandemic in March. Our bar chart that shows the growth in the prevalence of reported Covid-19 cases in each metropolitan area since March 1. The controls in the upper left hand corner of the chart allow you to play, stop and examine the animation.

New Orleans, New York, Detroit and Boston have the highest number of cases per capita of US metro areas.  New Orleans’s rate is currently 514 cases per 100,000.  Local reporting confirms that there was a big jump in reported cases in New Orleans from April 1 to April 2. New York (497), and Detroit (203) have the next highest rates of reported cases. Boston (134) has surpassed Seattle (115) for the fourth highest rate of reported cases per 100,000.  The median large metropolitan area has about 36 cases per 100,000 population.

Map of metro areas, reported Covid-19 cases per 100,000 population

The following map illustrates the relative number of reported Covid-19 cases per capita among large US metropolitan areas.  Darker red colors indicate metro areas with the highest reported incidence of cases.  Numbers on each metro area represent cases per 100,000 on April 2.

Growth rates in the number of cases

The key strategy in fighting the Covid-19 pandemic is using social distancing to slow the rate of transmission of the virus.  A key indicator of whether we are “flattening the curve” is whether the growth rate of the number of cases is increasing or decreasing.  The following chart shows the growth in the number of cases for selected metropolitan areas from March 10 through April 2.

The growth rates of the four cities with the highest rates of reported cases per capita paint divergent and interesting patterns of the pandemic.  For a time, Seattle had the highest rate of cases per capita of any US city.  That has changed in the past two weeks.  New York, New Orleans, and Detroit have surpassed Seattle.  On March 19, Seattle, New York and New Orleans all had nearly the same number of reported cases per 100,000 (about 30 per capita).  Since then, their growth paths have diverged:  New Orleans has grown most rapidly, followed by New York; Seattle’s growth has been subdued.  Meanwhile, over that same period of time, the growth of cases in Detroit has increased sharply:  On March 18, Detroit had just 1.4 reported cases per 100,000 population, essentially the same as the median of all large metro areas.  By March 29, that had increased to 108 cases per 100,000; the third highest rate among large US metro areas.

To put the spread of the pandemic in context, it is worth noting on March 16, no large US metro had a prevalence of reported Covid-19 cases of more than 15 per 100,000 population (Seattle was 12.2).  Today, nearly all (51 of 53) of the nation’s largest metro areas have a reported prevalence of more than 15 cases per 100,000.  Over the past few weeks,  it appears that there’s about two weeks difference between the worst afflicted metro, and the typical large metro.  Whether that continues to be the case depends on the efficacy of social distancing and other measures.

Growth Rates

To more readily compare changes in growth rates over time for individual metropolitan areas, we’ve charted the average daily growth rate over the past week for the period from March 8 to April 2.  This chart shows which cities have made progress in reducing the growth rate of the number of reported cases.  This chart shows growth rates for the metro areas with the greatest prevalence of reported Covid-19 cases in March.

Notice that Seattle has succeed in driving down its average daily rate of increase in cases over the previous seven days, and now has the lowest rate of daily increase of any large metro area.  Rates are starting to trend down for most other cities, but still must fall much further to blunt the pandemic.

Prevalence versus Growth

Slowing or stopping the spread of the virus depends on steadily decreasing the growth rate in the number of cases.  This is especially important as the prevalence of the virus becomes more widespread.  Here we’ve plotted the current prevalence of reported cases in each metropolitan area (shown on the horizontal axis) against the growth rate of reported cases in the past week in that metropolitan area (on the vertical axis).  The number of cases in each metropolitan area is proportional to the size of the circle representing each metro area.  You can mouse-over individual circles on the chart to fully identify each metro area, and see the underlying data for numbers of cases, cases per 100,000 and the growth rate in cases over the last week.

We’ve used the means of the two variables (growth rate (18 percent daily) and number of cases per 100,000 (64), to divide the chart into four quadrants. These quadrants help sort out which metro areas are experiencing the crisis to a greater or lesser degree.  Metro areas in the upper right hand quadrant are clearly most afflicted:  they have both higher than average rates of cases per capita and are growing faster than the average metro area (in the past week).  The lower right hand quadrant identifies metro areas with relatively higher rtes of cases per capita, but slower rates of increase.  Ideally, one wants to be in the lower left hand quadrant (low number of cases per capita, low growth rate).  The upper left hand quadrant is uncertain, but with cause for concern:  these cities (so far) have lower rates of cases per capita, but are seeing the virus spread faster than in the average metro area.  Over time, the strategy of flattening the curve should lead individual metropolitan areas to progress from the upper left hand quadrant (low rates and fast growth) to the lower right hand quadrant (higher than average rates but a slower rate of growth).

To make this picture a bit clearer, we’ve shortened the horizontal scale to exclude the three cities–New Orleans, New York and Detroit–with the highest numbers of cases per capita.  This chart makes it clearer which cities are in which quadrants.

The charts and information presented here on published data from state health departments, aggregated by The New York Times. Please use caution in interpreting these data. It is likely that in some areas, the number of cases is under-reported due to the lack of available testing capacity, or pressing medical conditions.  There are widespread differences in the number of tests administered relative to the size of the population in each state, and tests are not given randomly, and may be restricted solely to persons with symptoms, likely exposure or high risk in some states.  As a result, the ratio of reported to unreported, undiagnosed cases may vary across geography.  Moreover, changes in reported numbers of cases from day to day or week to week may reflect changes in the availability or application of testing over time, rather than the true rate of growth in the number of persons affected.

Notes and revisions

This post updates and supersedes our earlier posts with data through April 1. Please note that we have begun using The New York Times database of county level reported Covid-19 cases effective with this post. All of the data used in this commentary, dating back to January, 2020, is from the NY Times database. Numbers presented in this commentary may differ from estimates presented in previous commentaries because of differences in reporting and aggregation decisions between the two data sources.

Covid-19 Prevalence by Metro Area (April 1 data)

NOTE:  This post has been superseded with more recent data: click here.

Among the 53 metro areas with a million or more population:

  • New York, New Orleans, Detroit, Boston and Seattle have the highest incidence of pandemic among large metros.
  • Seattle’s rate of new cases has declined to the lowest level among large metro areas; Boston’s cases per 100,000 have surpassed Seattle
  • Detroit, Boston, Philadelphia, Miami and Indianapolis have higher than average incidence, and are experiencing faster than average growth in cases
  • New York had the highest level of reported cases per 100,000:  440
  • The typical (median) large metropolitan area had a rate of about 32 cases per 100,000
  • Half of all metropolitan areas had between 20 and 53 cases per 100,000.
  • The number of cases in the typical (median) metro area has increased by about 19 percent per day in the past week.
  • The typical metro is only about 1-2 weeks behind leading cities in the progression of the virus.
  • For more information on how to interpret these charts, read our explainer.
  • Important Note:  We have changed our source of data for county level estimates to those produced by The New York Times; the number of reported cases differs from estimates produced by our previous source.

City Observatory presents here its estimates of the prevalence and recent growth of reported Covid-19 cases in large US metropolitan areas.  We update this page regularly with the most recent available data.  The data on this page was last updated with data on counts of cases through April 1, 2020.  Caution should be used in interpreting these figures.  Case data can vary from the actual incidence of Corona virus infections due to differences in testing regimes and availability across jurisdictions, as well as other factors.  We believe that metro area levels and trends may be a useful geography for understanding the spread and intensity of the pandemic:  most published data are available at only the state or county level.  States are too large to accurately capture the the incidence of the pandemic; and counties are often too variable and too small.  Metro areas capture labor markets and commuting sheds, and are defined consistently, making them more appropriate geographic units for judging the spread of the virus.  As is our common practice at City Observatory, our focus is on metro areas with populations of 1 million or more.

Metro areas ranked by reported Covid-19 cases per 100,000 population

The following chart shows the number of reported cases of Covid-19 cases per 100,000 population is US metropolitan areas with a population of 1 million or more as of April 1, 2020.  Metropolitan data are computed by aggregating county level data available from The New York Times.  Metropolitan areas are ranked highest to lowest according to the number of reported cases per capita.

The progression of the pandemic in March. Our bar chart that shows the growth in the prevalence of reported Covid-19 cases in each metropolitan area since March 1. The controls in the upper left hand corner of the chart allow you to play, stop and examine the animation.

New York, New Orleans, Detroit and Boston have the highest number of cases per capita of US metro areas.  New York’s rate is currently 440 cases per 100,000.  New Orleans (345), and Detroit (176) have the next highest rates of reported cases. Boston (116) has surpassed Seattle (107) for the fourth highest rate of reported cases per 100,000.  The median large metropolitan area has about 32 cases per 100,000 population.

Map of metro areas, reported Covid-19 cases per 100,000 population

The following map illustrates the relative number of reported Covid-19 cases per capita among large US metropolitan areas.  Darker red colors indicate metro areas with the highest reported incidence of cases.  Numbers on each metro area represent cases per 100,000 on April 1.

Growth rates in the number of cases

The key strategy in fighting the Covid-19 pandemic is reducing social distancing to slow the rate of transmission of the virus.  A key indicator of whether we are “flattening the curve” is whether the growth rate of the number of cases is increasing or decreasing.  The following chart shows the growth in the number of cases for selected metropolitan areas from March 1 through April 1

The growth rates of the four cities with the highest rates of reported cases per capita paint divergent and interesting patterns of the pandemic.  For a time, Seattle had the highest rate of cases per capita of any US city.  That has changed in the past two weeks.  New York, New Orleans, and Detroit have surpassed Seattle.  On March 19, Seattle, New York and New Orleans all had nearly the same number of reported cases per 100,000 (about 30 per capita).  Since then, their growth paths have diverged:  New York has grown most rapidly, followed by New Orleans; Seattle’s growth has been subdued.  Meanwhile, over that same period of time, the growth of cases in Detroit has increased sharply:  On March 18, Detroit had just 1.4 reported cases per 100,000 population, essentially the same as the median of all large metro areas.  By March 29, that had increased to 108 cases per 100,000; the third highest rate among large US metro areas.

To put the spread of the pandemic in context, it is worth noting on March 16, no large US metro had a prevalence of reported Covid-19 cases of more than 15 per 100,000 population (Seattle was 12.2).  Today, more than five-sixths (46 of 53) of the nation’s largest metro areas have a reported prevalence of more than 15 cases per 100,000.  Over the past few weeks,  it appears that there’s about two weeks difference between the worst afflicted metro, and the typical large metro.  Whether that continues to be the case depends on the efficacy of social distancing and other measures.

Growth Rates

To more readily compare changes in growth rates over time for individual metropolitan areas, we’ve charted the average daily growth rate over the past week for the period from March 8 to April 1.  This chart shows which cities have made progress in reducing the growth rate of the number of reported cases.  This chart shows growth rates for the metro areas with the greatest prevalence of reported Covid-19 cases in March.

Notice that Seattle has succeed in driving down its average daily rate of increase in cases over the previous seven days, and now has the lowest rate of daily increase of any large metro area.  Rates are starting to trend down for most other cities, but still must fall much further to blunt the pandemic.

Prevalence versus Growth

Slowing or stopping the spread of the virus depends on steadily decreasing the growth rate in the number of cases.  This is especially important as the prevalence of the virus becomes more widespread.  Here we’ve plotted the current prevalence of reported cases in each metropolitan area (shown on the horizontal axis) against the growth rate of reported cases in the past week in that metropolitan area (on the vertical axis).  The number of cases in each metropolitan area is proportional to the size of the circle representing each metro area.  You can mouse-over individual circles on the chart to fully identify each metro area, and see the underlying data for numbers of cases, cases per 100,000 and the growth rate in cases over the last week.


We’ve used the means of the two variables (growth rate (19% daily) and number of cases per 100,000 (54), to divide the chart into four quadrants. These quadrants help sort out which metro areas are experiencing the crisis to a greater or lesser degree.  Metro areas in the upper right hand quadrant are clearly most afflicted:  they have both higher than average rates of cases per capita and are growing faster than the average metro area (in the past week).  The lower right hand quadrant identifies metro areas with relatively higher rtes of cases per capita, but slower rates of increase.  Ideally, one wants to be in the lower left hand quadrant (low number of cases per capita, low growth rate).  The upper left hand quadrant is uncertain, but with cause for concern:  these cities (so far) have lower rates of cases per capita, but are seeing the virus spread faster than in the average metro area.  Over time, the strategy of flattening the curve should lead individual metropolitan areas to progress from the upper left hand quadrant (low rates and fast growth) to the lower right hand quadrant (higher rates but a slower rate of growth).

To make this picture a bit clearer, we’ve shortened the horizontal scale to exclude the three cities–New York, New Orleans and Detroit–with the highest numbers of cases per capita.  This chart makes it clearer which cities are in which quadrants.

The charts and information presented here on published data from state health departments, aggregated by The New York Times. Please use caution in interpreting these data. It is likely that in some areas, the number of cases is under-reported due to the lack of available testing capacity, or pressing medical conditions.  There are widespread differences in the number of tests administered relative to the size of the population in each state, and tests are not given randomly, and may be restricted solely to persons with symptoms, likely exposure or high risk in some states.  As a result, the ratio of reported to unreported, undiagnosed cases may vary across geography.  Moreover, changes in reported numbers of cases from day to day or week to week may reflect changes in the availability or application of testing over time, rather than the true rate of growth in the number of persons affected.

Notes and revisions

This post updates and supersedes our earlier posts with data through March 31. Please note that we have begun using The New York Times database of county level reported Covid-19 cases effective with this post. All of the data used in this commentary, dating back to January, 2020, is from the NY Times database. Numbers presented in this commentary may differ from estimates presented in previous commentaries because of differences in reporting and aggregaton decisions between the two data sources.

Covid-19 Prevalence by Metro Area (March 31 data)

UPDATED April 1, 2020

Among the 53 metro areas with a million or more population:

  • New York, New Orleans, Detroit, Seattle and Boston have the highest incidence of pandemic among large metros.
  • Seattle’s rate of new cases has declined to the lowest level among large metro areas; Boston’s cases per 100,000 are nearly equal to Seattle
  • Detroit, Boston, Philadelphia, Miami and Indianapolis have higher than average incidence, and are experiencing faster than average growth in cases
  • New York had the highest level of reported cases per 100,000:  436
  • The typical (median) large metropolitan area had a rate of about 28 cases per 100,000
  • Half of all metropolitan areas had between 18 and 46 cases per 100,000.
  • The number of cases in the typical (median) metro area has increased by about 19 percent per day in the past week.
  • The typical metro is only about 1-2 weeks behind leading cities in the progression of the virus.
  • For more information on how to interpret these charts, read our explainer.

City Observatory presents here its estimates of the prevalence and recent growth of reported Covid-19 cases in large US metropolitan areas.  We update this page regularly with the most recent available data.  The data on this page was last updated with data on counts of cases through March 31, 2020.  Caution should be used in interpreting these figures.  Case data can vary from the actual incidence of Corona virus infections due to differences in testing regimes and availability across jurisdictions, as well as other factors.  We believe that metro area levels and trends may be a useful geography for understanding the spread and intensity of the pandemic:   most published data are available at only the state or county level.  States are too large to accurately capture the the incidence of the pandemic; and counties are often too variable and too small.  Metro areas capture labor markets and commuting sheds, and are defined consistently, making them more appropriate geographic units for judging the spread of the virus.  As is our common practice at City Observatory, our focus is on metro areas with populations of 1 million or more.

Metro areas ranked by reported Covid-19 cases per 100,000 population

The following chart shows the number of reported cases of Covid-19 cases per 100,000 population is US metropolitan areas with a population of 1 million or more as of March 31, 2020.  Metropolitan data are computed by aggregating county level data available from USAFacts.org.  Metropolitan areas are ranked highest to lowest according to the number of reported cases per capita.

The progression of the pandemic in March. Our bar chart that shows the growth in the prevalence of reported Covid-19 cases in each metropolitan area since March 1. The controls in the upper left hand corner of the chart allow you to play, stop and examine the animation.


New York, New Orleans, Seattle and Detroit have the highest number of cases per capita of US metro areas.  New York’s rate is currently 436 cases per 100,000.  New Orleans (282), and Detroit (146) have the next highest rates of reported cases. Seattle, which in mid-March had the highest rate of reported cases is fourth (102), and Boston’s rate is now nearly as high (99). The median large metropolitan area has about 28 cases per 100,000 population.

Map of metro areas, reported Covid-19 cases per 100,000 population

The following map illustrates the relative number of reported Covid-19 cases per capita among large US metropolitan areas.  Darker red colors indicate metro areas with the highest reported incidence of cases.  Numbers on each metro area represent cases per 100,000 on March 30.


Growth rates in the number of cases

The key strategy in fighting the Covid-19 pandemic is reducing social distancing to slow the rate of transmission of the virus.  A key indicator of whether we are “flattening the curve” is whether the growth rate of the number of cases is increasing or decreasing.  The following chart shows the growth in the number of cases for selected metropolitan areas from March 13 through March 31.

The growth rates of the four cities with the highest rates of reported cases per capita paint divergent and interesting patterns of the pandemic.  For a time, Seattle had the highest rate of cases per capita of any US city.  That has changed in the past two weeks.  New York, New Orleans, and Detroit have surpassed Seattle.  On March 19, Seattle, New York and New Orleans all had nearly the same number of reported cases per 100,000 (about 30 per capita).  Since then, their growth paths have diverged:  New York has grown most rapidly, followed by New Orleans; Seattle’s growth has been subdued.  Meanwhile, over that same period of time, the growth of cases in Detroit has increased sharply:  On March 18, Detroit had just 1.4 reported cases per 100,000 population, essentially the same as the median of all large metro areas.  By March 29, that had increased to 108 cases per 100,000; the third highest rate among large US metro areas.

To put the spread of the pandemic in context, it is worth noting on March 16, no large US metro had a prevalence of reported Covid-19 cases of more than 15 per 100,000 population (Seattle was 12.2).  Today, roughly five-sixths (44 of 53) of the nation’s largest metro areas have a reported prevalence of more than 15 cases per 100,000.  Over the past few weeks,  it appears that there’s about two weeks difference between the worst afflicted metro, and the typical large metro.  Whether that continues to be the case depends on the efficacy of social distancing and other measures.

Prevalence versus Growth

Slowing or stopping the spread of the virus depends on steadily decreasing the growth rate in the number of cases.  This is especially important as the prevalence of the virus becomes more widespread.  Here we’ve plotted the current prevalence of reported cases in each metropolitan area (shown on the horizontal axis) against the growth rate of reported cases in the past week in that metropolitan area (on the vertical axis).  The number of cases in each metropolitan area is proportional to the size of the circle representing each metro area.  You can mouse-over individual circles on the chart to fully identify each metro area, and see the underlying data for numbers of cases, cases per 100,000 and the growth rate in cases over the last week.

We’ve used the means of the two variables (growth rate (19% daily) and number of cases per 100,000 (47), to divide the chart into four quadrants. These quadrants help sort out which metro areas are experiencing the crisis to a greater or lesser degree.  Metro areas in the upper right hand quadrant are clearly most afflicted:  they have both higher than average rates of cases per capita and are growing faster than the average metro area (in the past week).  The lower right hand quadrant identifies metro areas with relatively higher rtes of cases per capita, but slower rates of increase.  Ideally, one wants to be in the lower left hand quadrant (low number of cases per capita, low growth rate).  The upper left hand quadrant is uncertain, but with cause for concern:  these cities (so far) have lower rates of cases per capita, but are seeing the virus spread faster than in the average metro area.  Over time, the strategy of flattening the curve should lead individual metropolitan areas to progress from the upper left hand quadrant (low rates and fast growth) to the lower right hand quadrant (higher rates but a slower rate of growth).

To make this picture a bit clearer, we’ve shortened the horizontal scale to exclude the three cities–New York, New Orleans and Detroit–with the highest numbers of cases per capita.   This chart makes it clearer which cities are in which quadrants.


The table and map rely on published data from state health departments, aggregated by USAFActs.org. Please use caution in interpreting these data. It is likely that in some areas, the number of cases is under-reported due to the lack of available testing capacity, or pressing medical conditions.  There are widespread differences in the number of tests administered relative to the size of the population in each state, and tests are not given randomly, and may be restricted solely to persons with symptoms, likely exposure or high risk in some states.  As a result, the ratio of reported to unreported, undiagnosed cases may vary across geography.  Moreover, changes in reported numbers of cases from day to day or week to week may reflect changes in the availability or application of testing over time, rather than the true rate of growth in the number of persons affected.

Notes and revisions

This post updates and supersedes our earlier posts with data through March 31. In addition, we’ve corrected our aggregation of county-level data to fully include outlying counties in some metropolitan areas. Our earlier data omitted some counties and cities in Virginia which caused us to under-estimate the number of reported cases in Washington DC and Virginia Beach. Readers should use the figures in this report.

Anatomy of a rental marketplace

A new report from the DC Policy Center shows the inner-workings of the shadow rental market that is a key to housing affordability

Too often, our debates about housing policy are shaped by inaccurate pictures of how the housing market really works. A new report from the D.C. Policy Center provides a remarkably clear and detailed picture of the rental marketplace. And its richer and more complicated than accounted for in the usual oral tradition of housing markets.

The “shadow” market for rental housing. We generally assume that that there are two types of housing, rental and ownership. Rentals tend to be multi-family apartment buildings, single-family homes are owner-occupied. Rentals stay rentals;owner-occupied homes state owner-occupied, and never the twain shall meet. Except that lots of single-family homes do get rented; and some of them, even though once rented, get sold and occupied by a new buyer.  This fluid movement of homes in and out of the rental market is seldom mentioned in housing policy.  Taylor calls this the “shadow” market for housing.

The report makes two facts clear about the shadow housing market.  First, its a considerable part of the District’s rental housing stock.  Using detailed administrative data, Taylor calculates that there are more than 60,000 single family homes, condominiums, flats and other small scale rentals which represent about a third  of the District’s rental housing. Importantly, many of these units are in high opportunity neighborhoods, so if you’re a renter, and you’re looking to get a better environment for your kids, the “shadow” market may be the way you access such neighborhoods.

The other fact is that housing regularly moves in and out of the shadow market. Again, by laboriously constructing a longitudinal picture of the occupancy of individual houses–something that’s simply not available in most housing statistics–Taylor computes the share of the “shadow” housing that was rented in 2006 that is owner occupied today, also the share of the shadow housing we have today was owner-occupied in 2006.

Homeowners frequently move their units in and out of the rental market. One fifth of the 87,000 owner-occupied condominiums and single-family homes in 2006 had become rentals in 2019. Conversely, of the 39,500 condominiums and single-family homes that were rentals in 2006, nearly 15,000 (38 percent) were, as of September 2019, owner-occupied

Housing can and does move between these categories, in response to the incentives that owners have to rent housing versus selling it.

These two fundamentals shed a new light on how we think about rent control.  If you view the number of housing units in the rental market place as fixed (mostly big apartment buildings, owned by corporations or real estate trusts), its hard to imagine that the housing will be withdrawn from the rental market and occupied by its owners.  But that doesn’t hold for our shadow housing.  If renting out a single family home or condominium no longer seems like a viable or profitable proposition, the owner has lots of choices.  She (or someone from her extended family) can move into the house, or she can put it up for sale.

If you read the report carefully, you will see it puts the lie to one of the most pernicious and misleading terms in housing policy “naturally occurring affordable housing.”  The assumption that a lot of people have is that as housing ages it automatically must decline in price, and become more affordable. That’s only true if there’s an adequate supply of housing in the face of market demand.  If–as is the case in Washington–its hard to build new units, and there are lots of prospective renters who can pay top dollar, its highly likely that investors will fix up existing units rather than allow them to decline in quality (and rent).  As Brookings economist Jenny Schuetz explained at the Atlantic earlier this year, its entirely possible for housing to “filter up,” reducing the supply of affordable housing.

Taylor’s report provides additional nuance for understanding how this process unfolds.  Owners of shadow market rental homes and condos have choices about whether and how much to invest in upkeep, and what price point to seek in the rental market. They (and their extended family) are also potential occupants of the homes they own. And depending on the market, they can rent out their home as is, fix it up, occupy themselves, or sell it to another owner occupant.  The key point is that there’s nothing “natural” about the process by which an individual home becomes affordable (if it does). It’s all about the policy environment and the incentives.

All this is extremely salient to discussions about tightening rent control in the District of Columbia.  The District has had a modest form of rent control since the 1980s, restricting rent increases to the cost of living plus 2 percent, but with provisions to allow rent increases when apartments are vacant and when they’re rehabilitated. And the rent control doesn’t apply to newly built apartments. But there are moves afoot to reduce the allowable rent increase to just the cost of living, and to fix rents even when units become vacant.

Taylor’s report suggests that the policies could have a dramatic effect on the decisions of the shadow rental market owners.  By reducing the economic returns to renting, rent control is likely to prompt many owners  to take their units out of the rental market place, occupying them themselves, or selling them to new owner occupants. And importantly, rent control is likely to stem the flow of other units into the shadow market.  As Taylor’s work shows, there’s currently a regular influx of existing homes from ownership into rental status:  If that dries up, the city’s rental housing supply will shrink.

The conventional criticism of rent control is that it discourages the construction of new apartment buildings. But this report makes it clear that the effects on housing supply are more subtle and pervasive. Because of the fluidity of the shadow market, rent control can have a negative effect on the rental housing supply because it encourages some owners to take currently rented units out of the market, and also because it is likely to discourage others from entering the rental market.

The report provides, in passing, evidence for one other feature of the housing market that’s often overlooked. Most multi-family housing in cities gets built in spurts, in booms, and in between booms, very little is built. In DC there was a surge in housing construction in the twenties (grey), and again just before and after World War II, and then a decades long drought from 1950 through the turn of the century.  Only in the past decade has another housing construction boom occurred. The dearth of housing built from 1960 through 2000 is why the District has a shortage of “naturally occurring” affordable housing (and the bust is a good indication of why that term is so misleading).

While in the height of a boom, it seems like building may go on forever, that’s seldom the case. It takes a unique constellation of factors (a robust local economy, low interest rates, banks and developers willing to take a risk), which may be short lived.  The message to cities is that you have to make sure housing gets built in boom times, or it may not be built at all.

As an alternative to more stringent rent control, Taylor outlines a proposal for “inclusionary conversions” that would negotiate contracts with owners of existing rental units to maintain them at affordable rents.  The District would make payments to owners, who would be contractually obligated to provide below market rental units. The concept would help preserve the existing rental housing stock for low and moderate income households, and rather than imposing all of the costs on landlords, would spread them more broadly to the public, through tax abatements.

Finally, Taylor emphasizes a point that we thing is important to communities everywhere. We increasingly expect small scale landlords to play an important role in providing additional housing in cities, through liberalization of “missing middle” housing like duplexes, triplexes, fourplexes, and accessory dwelling units. But all these measures assume that we have willing investors and that being a landlord is a viable proposition, As Taylor writes:

. . . a substantive part of the District’s rental housing is dependent upon the willingness on the part of smaller landlords to keep their units in the rental market. Further, some of the policies the city is pursuing to increase housing supply (such as Accessory Dwelling Units or infill development) relies on convincing current homeowners to become landlords. The District’s rental housing policies, however, are generally focused on large rental apartments, and do not consider the constraints for and the capacity of smaller landlords in obtaining financing, meeting regulatory requirements, and working within the requirements of tenants’ rights laws. A broader rental housing policy that recognizes the importance of these smaller landlords in expanding the city’s housing supply would be a step in the right direction for the District of Columbia

If we’re really interested in promoting additional housing supply, and  assuring a wide range of rental options in neighborhoods throughout our cities, we should be paying much more attention to the size and fluidity of the “shadow” rental market.  This report shines a useful light on its crucial role, and is something every city should look to duplicate.

Yesim Sayin Taylor, Appraising the District’s rentals
The role of rental housing in creating affordability and inclusivity in the District of
Columbia, (Washington: D.C. Policy Center, 2020)


The Week Observed, April 3, 2020

What City Observatory this week

1.  Counting Covid- Cases in US Metro Areas.  We’ve been updating our metro area tabulations of the number of reported Covid-19 cases on a daily basis. You can find our latest tabulations here.

There’s a mixture of positive and negative developments. Seattle, the metro first hit hard by the pandemic, and among the first to institute social distancing, has seen its rate of new reported cases fall to the lowest level among the nation’s large metro areas–a still high 10 percent daily increase over the past week.

The more troubling developments are in New York which has, by far the nation’s highest incidence of reported cases (436 per 100,000 population on March 31, compared to the median large metro area, which as about 47 cases per 100,000), and in a number of cities where the rate of newly reported cases is growing faster than in the typical metro.  New Orleans and Detroit have elevated levels of reported cases per capita.  Cases are growing faster than the average large metro in Boston, Philadelphia, Miami and Indianapolis.

You can check back at our home page, www.CityObservatory.org–we’ll produce regular updates of our metropolitan tabulations of reported Covid-19 cases.

2.  An animated view of the spread of the pandemic.  We’ve used our daily metro level tabulations of reported cases per 100,000 population to produce an animated chart showing the growth of the pandemic from March 1 through March 31.  You can view it here:

Must read

Privacy and the public interest in a pandemic.  The New York Times has a provocative article discussing how we balance personal privacy rights of patients against the public interest in better understanding how to fight a deadly communicable disease. There’s wide variation among local health departments in releasing basic aggregated statistical data about the incidence and demographics of those who have contracted the Corona virus. Officials in Santa Clara County, California, for example refuse to release city specific data on the number of cases.  Meanwhile, other countries (like Korea) are making pinpointed data on the location of new cases publicly available.  What’s the right balance?  As we move from a period of mandatory, and nearly universal quarantine, to a regime of testing and tracking, we’re going to have to reconsider our assumptions about whether privacy should trump releasing data that could help save lives.  For what its worth, we routinely release pinpoint data on fatalities and injuries from traffic crashes (with personal information removed) to help understand, and try to minimize traffic deaths.  Should we do any less with a pandemic?

In the News

Urban Milwaukee reported on our analysis of Covid-19 cases by metropolitan area, as did the Milwaukee Sentinel Journal.

Willamette Week reported that the private developers of Portland’s convention center headquarters hotel made a $40 million profit, essentially cashing in on $74 million in public subsidies for the project. City Observatory’s Joe Cortright is quoted as saying the deal was structured to give all of the upside to the private sector, and provided only downside risk for the public sector.

The Week Observed, April 17, 2020

What City Observatory this week

1. Regional Patterns of Covid-19 Incidence.  The pandemic has struck every corner of the nation, but has clearly hit some areas harder than others. We’ve focused on those metro areas, like New Orleans and New York, that have the highest rates of reported cases per 100,000 population. But stepping back and looking at the national map of metro areas shows that there are some distinct regional patterns to this pandemic. One hotspot is the entire Northeast Corridor, from Washington to Boston.  Six metro areas in the corridor rank among the top 12 metros for incidence of reported Covid cases.  Three Great Lakes region cities, Chicago, Detroit and Indianapolis are also in the top ten. Meanwhile, aside from Seattle, rates in the West tend to be much lower than in other metro areas.

2. Updated Metro Area statistics on reported Covid-19 cases per capita.  We’ve continued the daily updates to our estimates of the number of reported cases per 100,000 population in each of the nation’s 53 largest metro areas.  A key part of our analysis has been tracking the relationship between the incidence of the virus with its rate of growth to show where we’re making progress in fighting the pandemic. Metros in the upper-right hand sector of our matrix have higher prevalence and higher growth; those in the lower left have lower prevalence and lower growth.

3. How useful are Covid-19 case data? According to the New York Times, as of April 14th, there were over 600,000 reported cases of Covid-19 in the US.  But, as we all know, the diagnosis of the virus has been hampered by a lack of testing capacity, and there are good reasons to believe that there are many undiagnosed cases.  While that hampers our ability to understand the scale of the pandemic, its less of a problem for judging its geographic concentration. We take a close look at the correlation between case counts and deaths (which are less influenced by testing capacity), and find that cases are a good proxy for deaths at the metro level.  That gives us confidence that the case data are a useful way of judging the relative severity of the pandemic in across metropolitan areas.

Must read

1. The Covid-19 recession will put a big dent in global greenhouse gas emissions.   Its hard to know at this point exactly how big the reductions will be, but we have a range of estimates that ballpark the likely change.  The Carbon Tax Center’s Charles Komanoff estimates that the Covid response (and recession) could reduce global carbon emissions by more than 20 percent, enough to lower the atmospheric concentration of CO2 by about 1 part per million compared to what it would otherwise be.


Other estimates suggest a smaller effect–a decline of about 4 percent in greenhouse gas emissions.  Which forecast is correct probably depends on the severity and duration of the Corona pandemic and its economic aftermath.

2. Jed Kolko’s statistical analysis of county-level Covid-19 death data.  Indeed economist Jed Kolko has a detailed regression analysis of the correlation between county characteristics and the rate of reported Covid-19 deaths.  He finds that the death rate has been higher in more populous and denser counties, specifically:

Death rates are higher in counties with a higher share of 60-plus, Black, Hispanic, or Asian residents, and in places where March 2020 was colder. Death rates are higher in denser counties and in more populous metros, but also in counties with a lower share of college-educated residents — and education, density, and metro size are all strongly positively correlated.

He reports that much of the effect of density on the observed results is attributable to the large number of cases in New York City and its surrounding counties, but he finds that the death rate still varies along the urban/rural continuum when one excludes New York City.

3. Todd LItman on cities and health. There’s a lot of speculation that pandemic-inspired health concerns will propel an exodus from cities. But a careful look at health data shows that cities are conducive to better health.  Todd Litman has, as usual, a methodical summary of the literature and data.  The key takeaway:

In fact, most people are far better off before, during and after a disaster living in an urban area that provides convenient access to essential services and activities than moving to an isolated rural area. Cities are significantly safer and healthier overall, resulting in lower mortality rates and longer lifespans than in rural area . . .  Rural residents have shorter lifespans due to higher rates of cardiovascular, respiratory and kidney diseases, unintentional injuries lung and colorectal cancer, suicide, diabetes, Alzheimer’s disease and birth defects. These urban-rural differences are even greater for poor and minority groups.

New Knowledge

Unless we price them correctly, autonomous vehicles will increase miles driven, pollution and congestion.  There’s a lot of debate about what the effect of autonomous vehicles might be on travel patterns and urban form.  A new report from researchers at the University of California Davis reports that how we price roads and vehicle use will likely have a major impact on the answer to this question.  They used a transportation demand model to test alternative scenarios, and found that the combination of AVs and unpriced roads would trigger an increase in vehicle miles traveled of 11 percent, but that a system of road pricing would actually lead to 7 percent less travel.
Caroline Rodier,. Miguel Jaller, Elham Pourrahamani, et al, Automated Vehicles are Expected to Increase Driving and Emissions Without Policy Intervention, March 2020, https://escholarship.org/uc/item/4sf2n6rs

In the News

Portland’s KXL radio interviewed City Observatory director Joe Cortright about the likely impacts of the economic downturn trigger by the Covid-19 pandemic.

The Chicago Tribune cited City Observatory’s report “Less in Common” in an article addressing the ways that the pandemic is likely to change our inter-personal relationships.


The Week Observed, April 24, 2020

What City Observatory this week

1. What the Covid-19 Shutdown teaches us about freeways. Everyone knows that speeds are up on urban roadways around the nation because of the stay-at-home orders to fight the pandemic. But there’s a hidden lesson here. In Portland, for example, one of the most regularly congested roadways is  not only moving twice as fast, but is actually carrying more traffic at the peak hour than before the pandemic. The reason? Stay-at-home has worked like a demand management policy to keep the traffic from reaching a “tipping point” where the freeway actually loses capacity.

This shows that actually managing freeways, through policies like congestion pricing–can move more traffic, faster. If highway engineers really cared about congestion, they’d be taking this lesson to heart, and better managing the multi-billion dollar assets they’ve built, rather than wasting billions on unneeded (and environmentally destructive) freeway widening.

2. Is Covid-19 the end of cities? We don’t think so. A New York Times story last weekend argued that city living had “lost its allure” and migration away from cities was likely to be accelerated by the pandemic.  We beg to differ on both these points. It’s true that cities aren’t growing as fast as they were in the middle of the last decade, but as we’ve pointed out before, this has less to do with diminished allure, than it does with the shortage of housing in cities, and our widespread failure to build enough to meet demand (and keep rents affordable).  So its not diminished allure, so much as unrequited ardor. And as we–and others–have pointed out, simple-minded claims of a connection between density and Covid-19 don’t seem to square with the facts. Plenty of extremely dense cities have managed to largely avoid the pandemic, and studies of the US evidence show little reason to believe that urban density is a key cause of its spread.

3. Suburbs aren’t immune from Covid-19. As the New York Times story implies, there’s a kind of working assumption that if one were to move from a higher density urban neighborhood to a lower density suburban one, you could minimize your risk of exposure to the virus. While in the aggregate, per capita reported cases seem to be somewhat higher in central counties than surrounding suburban ones, the difference isn’t large.

Our analysis of data for the largest metro areas shows it makes a lot more difference which metro you live in than it does whether you live in the suburbs or the central county:  there’s about a .9 correlation between city and suburban Covid-19 rates within large metro areas.  And in the aggregate, the rate of reported cases per capita in suburbs lags about 6 days behind the comparable rate in central counties.

4. A worthwhile Canadian example. Those who want to blame urban density for vulnerability to pandemics often dismiss the very low rates of infection in highly dense cities like Hong Kong, Taipei, Seoul and Tokyo as an Asian anomaly. But right hear in North America, we have a very dense city, with high transit ridership, that has a way below average rate of reported Covid-19 cases:  Vancouver, British Columbia.

We compare Vancouver’s experience with its two US neighbors, Seattle and Portland, and find despite greater density–and a much closer connection to China–Vancouver has the lowest rate of reported cases per capita of the three cities (and Portland’s rate, as we’ve noted is in the bottom five of all large US metros.

5. The Covid-Corridor?  We’ve been compiling and closely analyzing data on the incidence of Covid-19 in the nation’s 53 largest metro areas.  One alarming pattern is the relatively high incidence of cases in the Northeast Corridor. Its well know that the New York City metro area is the US epicenter of the pandemic, but nearby metros are also suffering disproportionally.

All four of the metros with the highest number of new cases–New York, Boston, Providence and Philadelphia–are all in the Northeast Corridor.  The corridor also accounts for six of the top eight metros on this measure (adding Hartford and Washington).  Each of these metro areas is reporting new cases per capita at a rate 2-3 times higher (and in Boston’s case, 6 times higher) than the median large metro area in the US.

Must read

The best visualization dashboard for state level Covid-19.  We’ve spent a lot of time looking at pandemic data.  There are many different data visualizations out there, but we think the best one for stat data is “91-DIVOC.”  It’s been put together by computer science professor Wade Fagen-Ulmschneider of the University of Illinois and uses the county level database assembled by Johns Hopkins University. It gives you a series of charts that you can easily customize (looking at cases, deaths, cumulative, weekly and daily data, and it also allows you to highlight and filter the data quickly and easily.  Here’s a snapshot showing new daily cases for all 50 states with Oregon highlighted.

Other dashboards contain much of the same information, but its often hard to pick out particular datapoints in a spaghetti of dozens of lines, and you’re often left to simply accept the choices made by the dashboard’s designer.  DIVOC-91 puts you in control:  it’s clean and fast.  Now if they had a dashboard for metro areas . .

In the News

Willamette Week wrote about our analysis of the impact of the Covid-19 shutdown on Portland-area traffic in their story, “The Biggest Bottleneck on the West Coast is handling traffic at double the normal rush hour speeds; Covid-19 has shown what could happen if tolls were placed on Portland highways.


The Week Observed, April 10, 2020

What City Observatory this week

1. What cities are showing us about the progression of the Covid-19 pandemic.  In an important sense, each large US metro area is a separate test case of the path of the Covid-19 virus. By observing the path of the pandemic in different cities, we can get a sense of how it ultimately may be tamed. We step back to look at the differing experiences of US metro areas, based on our tabulations of the number of reported cases per 100,000 over the past month.  Seattle provides some signs for hope:  It had the first serious outbreak, but since then has dramatically reduced the rate of new cases reported (it was also one of the first to enact social distancing measures).  At the other end of the spectrum, Minneapolis-St. Paul has managed to keep its rate of reported cases well below that of other large metro areas, and as seen a very low rate of growth.  Is there something about social capital, health care or some other aspect of the Twin Cities that help it fight the spread of the virus?

2. Where people are staying at home. The key strategy for blunting the growth of the Covid-19 pandemic is restricting travel and implementing social distancing.  But how well are these tactics working?  We have some insights from “big data” extracted from the electronic breadcrumbs left by cell phones and other smart devices.  City Observatory has extracted county level data for the principal counties in each of the nation’s 53 largest metro areas in order to gauge the relative degree to which different metro areas have cut-back on their travel in recent weeks.  Data from Google and Cuebiq show significant reductions in travel.  The declines have been most pronounced in a number of well-educated tech-centers (where presumably a large fraction of the workforce can work remotely).  In addition, workplace travel and total travel seem to be down significantly in tourist-oriented metros like Las Vegas and Orlando, reflecting these regions’ dependence on the hard-hit travel, recreation, accomodation and food-service sectors.

3. A subtle and detailed picture of rental housing markets.  The DC Policy Center has a new report looking at rent control policy in the nation’s capital. It’s got a lot to say about that controversial policy, but its signal contribution to the housing debate is a much more nuanced and detailed picture of the way housing markets really work. A substantial fraction of Washington’s rental housing is privately owned single family homes, condominiums and small apartment buildings, which the report describes as the “shadow” rental market. Owners of these smaller properties have a good deal of flexibility to choose to live in their own building, or to put it on the rental market. One of the overlooked side-effects of rent control is that it tends to prompt a sharp contraction in this “shadow” inventory, as owners can choose to occupy homes themselves, or sell their investment to a new owner-occupant. Either way, this can quickly shrink the housing stock, leading to more displacement and further pressure on the un-regulated portion of the market. Few cities have developed such a detailed picture of the characteristics of the rental housing market, but more should, especially before they consider sweeping changes in rental regulations.

4.  Updated data on the number of reported Covid-19 cases in the nation’s large metropolitan areas. On a daily basis, City Observatory has been updating its estimates of the number of reported cases of Covid-19 per 100,000 population in each of the nation’s 53 largest metro areas (all those with a population of one million or more).  There’s a wide range of results, if the reported data are accurate.  New Orleans leads the nation with roughly 20 times more reported cases per capita than the typical metropolitan area.

Must read

1. Evidence that the Covid-21 curve is already flattening in New York City.  MIT Economist Jefflrey Hariris has a snap analysis of data on reported cases, hospitalizations and deaths in New York City which suggests that the pandemic’s exponential growth curve is already starting to flatten.  This is a hopeful sign that social distancing measures are starting to take hold.

Harris, Jeffrey, “The Coronavirus Epidemic Curve is Already Flattening in New York City” National Bureau of Economic Research Working Paper No. 26917, April 2020.

2. Miami blocks construction of freeway due to environmental concerns, and limited traffic benefits. The Miami Herald reports that an administrative law judge has blocked efforts to proceed with construction of a new 14 mile, $1 billion expressway. A key part of her rationale:  the project would produce limited improvements in traffic conditions because it would induce additional demand for travel. The judge found:

“Not only does the data reveal that the improvements in West Kendall congestion would be … ’meager,’ but also they provide no support for a finding that the [expressway plan] will accomplish its second objective — improving the commute time to downtown and other employment centers,”

3. A blown opportunity to repurpose street space for humans.  Bike Portland’s Jonathan Maus calls to task the Portland Bureau of Transportation for not thinking more creatively and expansively about re-dedicating some of the public right of way that has been vacated by cars in the pandemic to make it available for people.  Sidewalks are generally so narrow throughout the city that its not possible for two people to pass while observing the six-foot social distancing rule.  Meanwhile, adjacent streets sit substantially unused by cars (and those that are driving seem more likely to be speeding).  Despite the growing demand for public space (and wider spacing among people), PBOT has done little.  As Maus writes,

With car use at all-time lows, we have a tremendous amount of excess road capacity. Our streets represent thousands of acres of public space that could be put to emergency use to ensure healthy mobility for all Portlanders — from the central city to the eastern city limits.  But instead of enacting simple and proven measures to seize this opportunity and improve conditions, PBOT and Commissioner Eudaly are keeping the status quo and hiding from reality.

The broader point may be this:  If we can’t find the political will to reallocate street space to active transportation, when car use is at a decades long-low, when people are walking and biking in increased numbers, and its literally a matter of life or death, what makes us think we’ll change anything when the world returns to “normal”–whatever, and whenever that is?

New Knowledge

How do recessions affect mortality?  It’s a virtual certainty that the US is now in an economic recession after more than a decade of growth. How will the loss of millions of jobs (hopefully, only temporarily) affect people’s health.  There are some interesting–and on the surface, contradictory–findings.  For individuals losing one’s job is associated with increased risk of death. Some estimates suggest that losing your job is the health-risk equivalent of being ten-years older.  The surprising counter-factual is that US mortality rates, calculated for the entire population, tend to go down in recessions, that is, on an age-adjusted basis fewer people die in a given year in a recession than otherwise.
On its face that doesn’t make sense, but a recent study looking at the aftermath of the Great Recession helps clarify the paradox. Studies undertaken in the past few years shed some light on the apparent contradiction.  As the author’s explain, their are negative consequences for those who are unemployed, but the slower economy more than offsets those mortality losses by improving the health of those who hang on to their jobs.
Our results indicate that in comparison with employed persons, the unemployed have a significantly increased hazard of death. Since the increase in this hazard is at least 73% (Table 1, model M1) and 1 extra year of age raises the hazard of death by approximately 7%, the health-damaging effect associated with being jobless is similar to the effect of about 10 extra years of age. However, each percentage-point increase in contextual unemployment reduces the hazard of death by approximately 9% (Table 1, model M3). The magnitude of this effect is slightly greater than that of reducing age by 1 year.
José A. Tapia Granados*, James S. House, Edward L. Ionides, Sarah Burgard, and Robert S. Schoeni,“Individual Joblessness, Contextual Unemployment, and Mortality Risk,” American Journal of Epidemiology, July 2014.

In the News

CityPages reported on our theory that Minneapolis-St. Paul’s low incidence of reported Covid-19 cases may be a result of “Minnesota Nice” the fact that the region has long practiced the art of social distancing. More seriously, the article discusses the contribution of high levels of social capital to forging an effective community response to the pandemic.

Richard Florida gave a shout out to City Observatory’s analysis of the geography of the Covid-19 pandemic at CityLab.


Is Covid-19 the end of cities? (Spoiler: No.)

The New York Times tells us that cities were “losing their allure” before the Covid-19 pandemic, and that now people are preparing to flee urban areas.  Sure, cities had a bit of a resurgence after 2000,

But by the mid-2010s, the growth slowed. Big cities had become expensive, with rents far out of the range of the middle-income American. The economy was changing too: Low-wage jobs, after adjusting for the local cost of living, paid about the same everywhere.

Then the virus hit, sharpening questions of affordability and lifestyle. Some argue it could accelerate the trend that was already underway.

The article goes on to quote an economic development official from Tulsa, Oklahoma (which pays $10,000 to people willing to move there), as saying fear of the pandemic could lead more people to come to his city. Another bit of evidence for the demise of big cities is an uptick in buyer interest for condominiums in South Florida.

The article’s conclusions hinge on two claims that are at best dubious:

The first is that cities are “losing their allure”—as evidenced by slowing rates of population growth in cities relative to suburbs.  Population isn’t rising as fast in cities now as it was a few years ago, ergo, people must not like cities anymore.

The second is that moving to the suburbs or rural communities is a way to escape the Covid-19 virus, or future pandemics, because “density.” In a sense, the associating fear of disease with density is reviving an old anti-urban meme:  the “teeming tenements” theory of public health. We’d all be somehow safer if we just lived on large lots in bucolic hamlets.

In our view, both these claims are wrong, and as a result, there’s no reason to be dour about the future of urbanism, or think that decamping from cities would do anything to lessen our individual or collective vulnerability to future pandemics. Let’s consider each, in turn.

Are people disenchanted with cities?

True, the nation’s cities were outpacing their suburbs in population growth in most of the last decade, and that pattern has slowed considerably. But the slowing rate of urban population growth is mis-intepreted.  If there were no constraints on the number of people who could live in cities, a simple-minded body count comparison would be a fair representation of revealed preference.  But as we’ve pointed out before, the real problem—as abundantly demonstrated by the housing shortage and rising rents—is that we’re bumping up against the limits of the number of people we can fit in cities, and aren’t building new housing (and great urban neighborhoods) fast enough to accomodate the demand.  The most powerful–and un-contradicted–bit of evidence is the increasing prices that people are paying to live in central locations and walkable neighborhoods.

The recent Bill Frey analysis cited in the New York Times article,  “An end of the decade of cities,” points to slowing population growth in urban counties relative to suburban ones. But this body count is too much demography and too little economics:  As long as there was slack in city housing markets, people could move there; if they’re not moving there as much now, its because we’ve used up all the slack (which is strongly indicated by rising prices in the city and the steepening of the urban rent gradient).  The reason why cities are so “expensive” as the Times says, is because demand is outstripping supply. Also, as we’ve frequently pointed out, its hard to accurately infer what’s happening in denser urban neighborhoods from looking at county data.

There are no reasons to doubt Census population counts, but there are good reasons to question the superficial claims that some have made that these population trends signal widespread  disenchantment with urban living or a newfound love of suburban tract homes.  Here’s why:

1.  Today’s young adults, especially those with college degrees are vastly more likely to choose to live in close-in urban neighborhoods today than their predecessors in earlier generations.  As our reports on the Young and Restless show, the number of well educated young adults is increasing twice as fast in close-in urban neighborhoods than the rest of metropolitan areas.

2.  Simply counting heads doesn’t reflect the demand for urban living.  High and rising rents and home prices in urban centers show demand is outstripping supply.  Higher relative prices for city homes v. suburban ones is the most powerful evidence of consumer preference for cities. As we’ve demonstrated in our posts on the “Dow of Cities” urban homes now command higher prices relative to suburban ones.  Same for walkable neighborhoods.

3.  Cities were able to grow population robustly up to the point where their housing market slack was exhausted.  Now city growth is limited by how fast we can add new housing, which is not fast enough. The failure of cities to grow as rapidly as suburbs really points to a shortage of supply, not a lack of demand.  You have to assume that housing is equally and essentially infinitely elastic in both cities and suburbs in order to interpret simple comparisons of population data as measure of revealed preference.

Rising rents and suburban growth mean we’re not doing enough of this.

4.  Ultimately, the policy implication of all this is not that Americans, especially younger ones, are disenchanted with cities and want more suburbs.  In fact, it’s exactly the opposite.  The unrequited demand for urban living indicated by high rents and home prices, and the complaints about having to move to suburbs to afford homes signals that policy needs to respond by creating more housing in cities.  When we finally make it as easy to build new housing in cities as we do in suburbs, for example, by allowing missing middle housing to be built, we’ll see urban population grow more rapidly.

Does density aggravate the pandemic?

The second part of the Times’s argument is that living in big, dense cities somehow makes people more vulnerable to the pandemic.  So, logically, people will flee to be safe.  In a sense, this is a warmed-over version of some old myths about the negative health implications of living in cities, the “teeming tenements breed disease” argument. As Todd Litman has neatly summarized, the health data are unambiguous:  city living is associated with lower rates of morbidity and mortality; the kind of sedentary lifestyle propagated in suburbs, is actually bad for your health.

When it comes to the Covid-19 virus, if there is a problem of over-crowding, it seems to be largely confined to nursing homes, prisons and cruise ships or aircraft carriers, not cities.

As we look around the world there are plenty of places far denser than typical American cities that have largely dodged the Corona-virus epidemic.  BloggerAaron Carr gives a nice synopsis of this observation.

New Zealand, South Korea, Germany, Taiwan, Thailand, Australia, Singapore, HK, Japan, Norway, Canada, + CA have a combined population of nearly 500m people, but 1,900 fewer COVID deaths than NYC. Density isn’t the problem. Failing to plan, prepare, and act early/aggressively is.

And, as we’ve pointed out in a detailed analysis comparing Vancouver, British Columbia with US cities, there’s little reason to believe that, even in North America, density drives the pandemic.  Vancouver is the third most dense city on the continent, and has a low rate reported cases.

Bloomberg’s Noah Smith makes that same point, and also notes that outbreaks have been common in suburbs:

California’s outbreak started in suburban Santa Clara county rather than San Francisco and is still more severe in the former. New York’s outbreak started in Westchester County, north of New York City. These epicenters are suburban areas that we don’t normally think of as being very dense. This suggests that social and professional networks, rather than random interactions on streets or in trains, are the main vectors by which diseases such as the coronavirus spread.

More specifically, a lot of people seem to think that one particular aspect of density–urban transit systems–contribute to the spread of the virus. There’s a working paper from MIT economist Jeffrey Harris that seems to imply a connection between transit ridership in New York City and the intensity of the pandemic in particular neighborhoods.  Alon Levy and Salim Furth have already written comprehensive takedowns of this claim.

Writing at Pedestrian Observations, Levy notes that the paper’s only quantitative claim is based on a comparison of Manhattan with the rest of New York City, one which is fraught with problems because of differing income levels, travel patterns and other factors.

In an article published at Market Urbanism, Furth presents his own statistical analysis looking at the connection between car use and reported Covid-19 cases.  He find that it car-dependent portions of New York City (like Staten Island, and outlying neighborhoods in Queens), reported cases per capita are higher than they are in denser neighborhoods with higher levels of transit use.  He concludes:

Taken together, the global trends, suburb versus city infection rates, and neighborhood trends within New York suggest that transit-dependent cities are easier to protect from viral infections even when the transit system remains open.

In the heat of the crisis, its easy for fear and misinformation to circulate.  The claims that the city and urban living are a contributor to disease is based on an old set of anti-urban biases, that seem to have little basis in fact.  Over time, as the pandemic wanes, its likely that a cooler and more fact-based view will prevail, and the baseless bias against cities will subside. It’s helpful in that sense to recall that the heyday of American urbanism was the decade of the Roaring Twenties which followed immediately after the Spanish Influenza epidemic of 1918 and 1919.

Be optimistic about cities going forward

The epitaph of cities has been written many times.  We were told that in the wake of 9/11 no one would want to live in dense areas for fear of terrorist attacks. We were told that the advent of the Internet and shopping would allow people to forego traveling to cities for jobs and goods, but the back to the city movement has flourished and accelerated coincident with the widespread adoption of these technologies.  Once again, we’re being told that a new fear will drive people to the suburbs or rural towns. Nobel prize winning economist addresses this question head-on in a recent interview with Marron Institute’s Brandon Fuller.

Brandon Fuller: Does the pandemic make you more or less optimistic about the benefits of urban agglomeration?

Paul Romer: The fact is that the intense interaction that cities allow is immensely productive. I think what we’re going to learn from this is that there are a variety of ways to continue to interact frequently while minimizing the risks of transmitting viruses. I doubt that this is going to slow down the growth of cities. I think the underlying economic reality is that there is tremendous economic value in interacting with people and sharing ideas. There’s still a lot to be gained from interaction in close physical proximity because such interaction is a large part of how we establish trust. So I think that, for the rest of my life, cities are going to continue to be where the action is.

Note:  This article has been revised to correct formatting problems.