What City Observatory this week
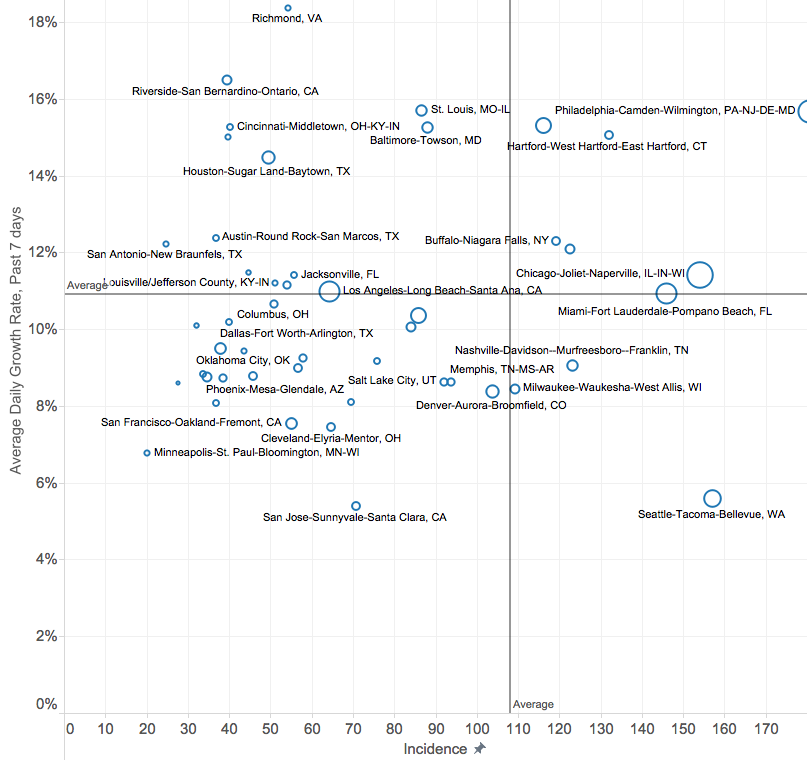
1. What cities are showing us about the progression of the Covid-19 pandemic. In an important sense, each large US metro area is a separate test case of the path of the Covid-19 virus. By observing the path of the pandemic in different cities, we can get a sense of how it ultimately may be tamed. We step back to look at the differing experiences of US metro areas, based on our tabulations of the number of reported cases per 100,000 over the past month. Seattle provides some signs for hope: It had the first serious outbreak, but since then has dramatically reduced the rate of new cases reported (it was also one of the first to enact social distancing measures). At the other end of the spectrum, Minneapolis-St. Paul has managed to keep its rate of reported cases well below that of other large metro areas, and as seen a very low rate of growth. Is there something about social capital, health care or some other aspect of the Twin Cities that help it fight the spread of the virus?
2. Where people are staying at home. The key strategy for blunting the growth of the Covid-19 pandemic is restricting travel and implementing social distancing. But how well are these tactics working? We have some insights from “big data” extracted from the electronic breadcrumbs left by cell phones and other smart devices. City Observatory has extracted county level data for the principal counties in each of the nation’s 53 largest metro areas in order to gauge the relative degree to which different metro areas have cut-back on their travel in recent weeks. Data from Google and Cuebiq show significant reductions in travel. The declines have been most pronounced in a number of well-educated tech-centers (where presumably a large fraction of the workforce can work remotely). In addition, workplace travel and total travel seem to be down significantly in tourist-oriented metros like Las Vegas and Orlando, reflecting these regions’ dependence on the hard-hit travel, recreation, accomodation and food-service sectors.
3. A subtle and detailed picture of rental housing markets. The DC Policy Center has a new report looking at rent control policy in the nation’s capital. It’s got a lot to say about that controversial policy, but its signal contribution to the housing debate is a much more nuanced and detailed picture of the way housing markets really work. A substantial fraction of Washington’s rental housing is privately owned single family homes, condominiums and small apartment buildings, which the report describes as the “shadow” rental market. Owners of these smaller properties have a good deal of flexibility to choose to live in their own building, or to put it on the rental market. One of the overlooked side-effects of rent control is that it tends to prompt a sharp contraction in this “shadow” inventory, as owners can choose to occupy homes themselves, or sell their investment to a new owner-occupant. Either way, this can quickly shrink the housing stock, leading to more displacement and further pressure on the un-regulated portion of the market. Few cities have developed such a detailed picture of the characteristics of the rental housing market, but more should, especially before they consider sweeping changes in rental regulations.
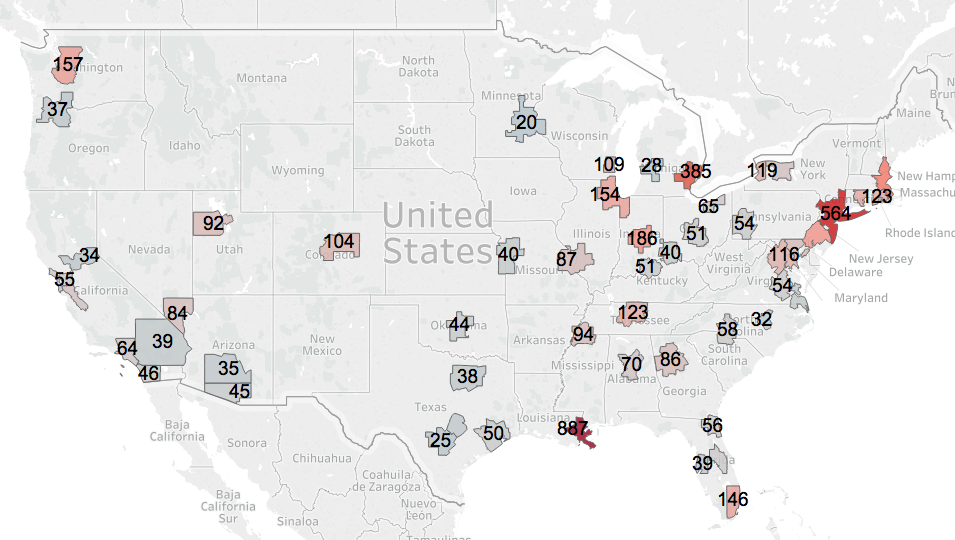
4. Updated data on the number of reported Covid-19 cases in the nation’s large metropolitan areas. On a daily basis, City Observatory has been updating its estimates of the number of reported cases of Covid-19 per 100,000 population in each of the nation’s 53 largest metro areas (all those with a population of one million or more). There’s a wide range of results, if the reported data are accurate. New Orleans leads the nation with roughly 20 times more reported cases per capita than the typical metropolitan area.
Must read
1. Evidence that the Covid-21 curve is already flattening in New York City. MIT Economist Jefflrey Hariris has a snap analysis of data on reported cases, hospitalizations and deaths in New York City which suggests that the pandemic’s exponential growth curve is already starting to flatten. This is a hopeful sign that social distancing measures are starting to take hold.
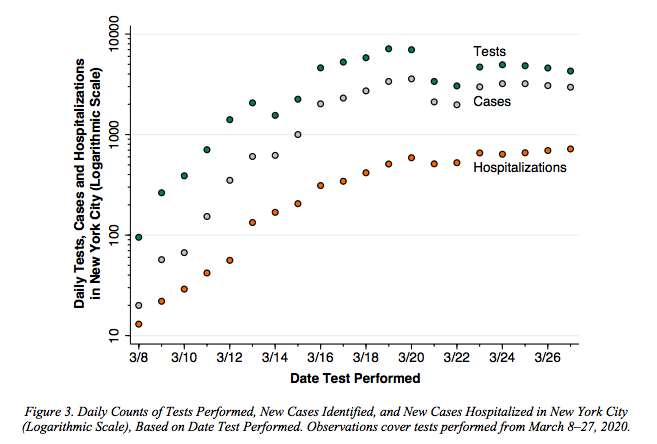 Harris, Jeffrey, “The Coronavirus Epidemic Curve is Already Flattening in New York City” National Bureau of Economic Research Working Paper No. 26917, April 2020.
2. Miami blocks construction of freeway due to environmental concerns, and limited traffic benefits. The Miami Herald reports that an administrative law judge has blocked efforts to proceed with construction of a new 14 mile, $1 billion expressway. A key part of her rationale: the project would produce limited improvements in traffic conditions because it would induce additional demand for travel. The judge found:
“Not only does the data reveal that the improvements in West Kendall congestion would be … ’meager,’ but also they provide no support for a finding that the [expressway plan] will accomplish its second objective — improving the commute time to downtown and other employment centers,”
3. A blown opportunity to repurpose street space for humans. Bike Portland’s Jonathan Maus calls to task the Portland Bureau of Transportation for not thinking more creatively and expansively about re-dedicating some of the public right of way that has been vacated by cars in the pandemic to make it available for people. Sidewalks are generally so narrow throughout the city that its not possible for two people to pass while observing the six-foot social distancing rule. Meanwhile, adjacent streets sit substantially unused by cars (and those that are driving seem more likely to be speeding). Despite the growing demand for public space (and wider spacing among people), PBOT has done little. As Maus writes,
With car use at all-time lows, we have a tremendous amount of excess road capacity. Our streets represent thousands of acres of public space that could be put to emergency use to ensure healthy mobility for all Portlanders — from the central city to the eastern city limits. But instead of enacting simple and proven measures to seize this opportunity and improve conditions, PBOT and Commissioner Eudaly are keeping the status quo and hiding from reality.
The broader point may be this: If we can’t find the political will to reallocate street space to active transportation, when car use is at a decades long-low, when people are walking and biking in increased numbers, and its literally a matter of life or death, what makes us think we’ll change anything when the world returns to “normal”–whatever, and whenever that is?
New Knowledge
Our results indicate that in comparison with employed persons, the unemployed have a significantly increased hazard of death. Since the increase in this hazard is at least 73% (Table 1, model M1) and 1 extra year of age raises the hazard of death by approximately 7%, the health-damaging effect associated with being jobless is similar to the effect of about 10 extra years of age. However, each percentage-point increase in contextual unemployment reduces the hazard of death by approximately 9% (Table 1, model M3). The magnitude of this effect is slightly greater than that of reducing age by 1 year.
In the News
CityPages reported on our theory that Minneapolis-St. Paul’s low incidence of reported Covid-19 cases may be a result of “Minnesota Nice” the fact that the region has long practiced the art of social distancing. More seriously, the article discusses the contribution of high levels of social capital to forging an effective community response to the pandemic.
Richard Florida gave a shout out to City Observatory’s analysis of the geography of the Covid-19 pandemic at CityLab.
