Freeways are promoted with extravagant—and usually false—p.r. campaigns, but their death is just a bureaucratic footnote
Freeway fights are often long, drawn-out affairs, that involve challenging poorly conceived and wasteful projects at a seemingly unending series of public meetings. In practice, freeway fighters generally lose every single battle—except the last one. The epitaph for one such freeway project, the half billion dollar widening of I-205 south of Portland, the so-called “Phase 2” project, looked like this:
The notice appears in terse language in an appendix to a report listing changes to Oregon’s federally required “State Transportation Investment Plan” or STIP. Until this notice came out, the official status of this project was “indefinitely postponed,” but now it’s clearly dead.
“Revenue uncertainty” is a euphemism for “we have no money to pay for this project, and no prospect of finding any.
As we reported two months ago, it finally became obvious that the the Oregon Department of Transportation simply lacks the funds to pay for a seven-mile long widening of I-205 just outside of Portland.
Opposition to the project was led by No More Freeways, a grassroots Portland group fighting billions of dollars of freeway widening projects being pushed by ODOT. No More Freeways celebrated its Sixth Birthday this past month, and marked the passing of the I-205 project, along with its allies “Youth vs. ODOT”–young climate advocates who’ve relentlessly campaigned against these wasteful projects.
No More Freeways filed detailed objections and critiques of the project technical work in comments on its Environmental Assessment. In addition, NMF’s community members submitted over 300 comments in opposition to the I-205 expansion during the public comment period last spring, including technical comments pointing out the explicit violation of federal environmental protection law.
ODOT’s proposed I-205 expansion was listed as one of the worst transportation projects in the country in USPIRG’s “Highway Boondoggles” report in 2022.
This is how bad projects die: Agencies finally, and reluctantly, concede that they don’t have the money to pay for the projects, and that they are so bad that no one can be convinced to appropriate (or borrow) the money needed to move them forward.
We can only hope that this first small victory will signal a turning of the tide in the battle against wasteful and counterproductive highway expansion projects. Oregon DOT continues to maintain the “extend and pretend” fiction that its now-$1.9 billion Rose Quarter project is still alive, but it too, will have to yield to the fiscal reality that the highway department is essentially broke and doesn’t have the resources to maintain the roads it currently has, much less build enormously expensive new ones.
New York lost more than 100,000 homes due to the combination of smaller, more affordable apartments into larger, more luxurious homes
When rich people can’t buy new luxury housing, they buy up, and combine small apartments to create larger homes.
This is a negative sum game: the number of housing units gained by high income households is fewer than the number
If you’re worried about gentrification and displacement, this is a vastly larger problem than new construction–which has been repeatedly shown to lower rents and create more housing opportunities for lower income households.
The obsession with fighting new development reflects a profound cognitive bias in thinking about housing: we equate new units with unwanted change, while ignoring the effectively invisible destruction of existing units by upscaled combinations.
New York Lost 100,000 Homes to Consolidation
A new study reported in The City finds that over the past several decades, the number of homes in New York has declined by more than 100,000 as smaller apartments have been consolidated into larger homes. The data come from a thesis prepared by Adam Brodheim of Columbia University.
The effect of unit consolidation has been to partially or totally offset the positive supply effects of new construction. In some neighborhoods, the number of housing units lost to these combinations dwarfs new construction. In New York, the largest number of units have been lost in Manhattan and Brooklyn.
Combinations and Gentrification
The demand for consolidation comes from higher income families who want to live in the city but can’t find units that are large enough to accommodate their needs and income. In a very real sense, the failure to build enough new luxury housing means these higher income households don’t go away, they outbid multiple middle and lower income households for these units.
Do each of these brownstones have four apartments, or only one? (Flickr: Sharona Gott)
Building more high end housing keeps those with high incomes from moving down market and out-bidding those with less income for the existing housing stock, we still hear this argument. For remaining doubters, have a look at Noah Smith’s thought experiment, asking what we think would happen to housing prices if we suddenly demolished 10,000 units of expensive housing.
This study confirms exactly the Smith’s thought-experiment posed by economist Noah Smith some years ago: The households don’t disappear; they outbid people with less income for the housing units that remain. Limiting supply doesn’t reduce demand, especially by high income households. The demand is there whether you supply new larger, luxury units or not, and with no other place to go, it spills over into other parts of the housing market, to the detriment of everyone else lower on the ladder.
And in New York, with these high end-remodeling combinations, the result is actually a negative sum game. High income households don’t simply displace lower income households one for one: each new combined unit to house one higher income household displaces multiple households with lower incomes.
If you are concerned about gentrification, you ought to be deeply concerned about these conversions, rather than new construction. While the knee jerk solution might be to try and block combinations, that misses the fact that the underlying problem is that there are simply too few units and too little space compared to the number of people who want to live in cities.
(We see the same thing happening in Silicon Valley, where an otherwise unremarkable ranch house from the 1950s commands a multi-million dollar price tag–because its so difficult to build new housing there).
An invisible process produces cognitive bias
The process is largely invisible: Unlike new buildings, which are obvious, public and highly regulated, the combinationof apartments occurs out of public sight, behind closed doors and with minimal regulatory scrutiny:
. . . three previously multi-unit brownstones have been converted into single-family homes over the years — but you’d never know it unless you spotted a construction permit, or noticed multiple buzzers replaced by one doorbell, he said.
“From the perspective of most people on the street, they’re not noticing that seven fewer families are able to live on this block … and this happens all the time,” Brodheim told THE CITY. “Unlike new buildings, which have to go through this huge gauntlet of, often, public opposition to create new units, here you’re able to get rid of apartments without anyone noticing.”
As we’ve noted in our analysis of gentrification, there’s a profound cognitive bias in understanding neighborhood change. Our research shows that there’s been a dramatic increase in concentrated poverty in US cities, and that poor neighborhoods tend to hemorrhage population. Fewer than one in twenty high poverty US neighborhoods gentrified over four decades; far more commonly high poverty neighborhoods spread and lost population. But these processes occur slowly, over decades, and are imperceptible or simply unperceived by most residents. In contrast, new construction is obvious, and people understandably associate it with neighborhood change. Our attention is naturally drawn to those places where an urban transformation is happening the most rapidly; new investment and construction are much more noticeable than the imperceptible processes of neighborhood decline.
Adam Brodheim, 2023. “Bigger Houses, Fewer Homes: Dwelling Unit Consolidation in New York City.” M.S. Historic Preservation Thesis, Columbia University.
https://www.thecity.nyc/housing/2023/8/24/23843686/100k-apartments-lost-to-house-conversions?s=09
This is what victory looks like. Freeway fighting is hard, drawn-out work. StateDOTs and their allies have vast funding for public relations campaigns to sell giant projects; citizen activists work from a shoestring budget, and have to attend interminable meetings that are invariably organized by project proponents. In general, freeway fighters lose very battle—except the last one. When bad freeway projects die, it is with a whimper, rather than a bang. Oregon DOT’s half billion dollar I-205 freeway widening project—a nationally recognized boondoggle—died in a brief bureaucratic footnote.
What this really signals is that Oregon DOT bent to the reality that it didn’t have the money to pay for this project, and had almost no likelihood of convincing anyone else to pay for it. This same inescapable logic has already likely doomed the I-5 Rose Quarter project as well.
Must Read
Janette Sadik Khan and Aaron Gordon on congestion pricing. It looks like congestion pricing is really, truly going to happen in New York City early next year. While everyone agrees that this is a step in the right direction, two influential voices are raising concerns that the city isn’t doing enough to make sure this is a success and capitalize on the best opportunity in generations to reshape urban transportation.
Janette Sadik Khan writes that the city isn’t thinking hard enough about how to creatively use the road space freed up by congestion pricing. Pricing will reduce traffic by an estimated 20 percent, but what will fill that vaccuum? Khan argues:
You don’t want to launch a program that’s all stick and no carrot. If congestion pricing does in fact remove 20 percent of the traffic and you just wind up with underused car lanes, it’s an invitation for motorists to fill them up again. It will harm the program’s credibility irreparably.
Other places, like London, greatly increased bus service as they implemented pricing, both to accomodate more traffic and show tangible benefits from pricing.
Aaron Gordon focuses on the fact that all of the net proceeds of congestion pricing will be plowed into transit capital improvements, with nothing dedicated to actually expanding transit service.
The money collected from congestion pricing tolls cannot, legally speaking, go to anything other than paying for those big, expensive capital projects. In other words, it can’t go towards paying for more frequent service on existing subway, bus, or rail lines.
Urban Density is a good thing. Urbanists should run towards, rather than running from density. Denser urban areas produce a range of environmental, social and economic benefits that can’t be realized in any other ways.
Writing at Vancouver’s Georgia Straight, Helen Lui points out
Density brings public services, transit, parks, and amenities closer together. When we can walk our children to school or cycle to the nearby park, grocer, or restaurant, we reduce carbon pollutants, save money otherwise spent on cars, and get some exercise, too.
Too often, we end up apologizing for more density, rather than pointing out its important benefits.
Less parking = more affordability. Many studies have conclusively shown that parking requirements drive up the cost of housing: they make it more expensive to build new homes, limit the amount of housing that can be built in specific locations, and result in a smaller supply of housing, driving up overall rent levels.
As we would expect, reducing parking requirements has the effect of lowering development costs and can be expected to reduce rents. Writing at the Minnesota Reformer, Zak Yudhishthu, charts the decline in parking built in new apartment projects after the relaxation of city parking requirements Minneapolis.
The typical number of parkings spaces per housing unit fell from about 1 prior to the reform to less than .75 spaces per unit today.
New Knowledge
Rents and Incomes. This is actually a debunking of some new non-knowledge, specifically a social media meme that purports to show that rents increases have dramatically outstripped income growth. It’s a compelling visual, but its not simply wrong; it’s an obvious and intentional lie.
The meme in question compares inflation adjusted incomes to unadjusted rents. The video purports to show that rents (un-adjusted, in red) have risen, while incomes (adjusted for inflation) have declined.
It’s simply bogus. We turn the microphone over to Economist Noah Smith.
This video is, of course, complete disinformation. The income line is adjusted for inflation, and the rent line isn’t. That makes it look like rent went up a lot more than income, where in reality they went up by a similar amount.
The reality, is that rents and incomes track one another pretty closely over time. Here are Smith’s data, via FRED, the Federal Reserve Bank of St. Louis repository of economic data.
The misleading “rent v. income” chart is just one of too many examples of how graphics can be used to lie in a seemingly precise and convincing way. Helpfully, Noah Smith provides some very detailed advice on how to be a critical consumer of such charts, and avoid being sucked in by visual deceptions. Caveat emptor!
Noah Smith, “How not to be fooled by viral charts.” (Substack). September 13, 2023. https://www.noahpinion.blog/p/how-not-to-be-fooled-by-viral-charts
What if we regulated new car ownership the same way we do new housing? Getting a building permit for a new house is difficult, expensive, and in some places, simply impossible. In contrast, everywhere in the US, you can get a vehicle registration automatically, just for paying a prescribed fee. We make it really hard to build more homes, but very easy to buy more cars. Little wonder we have a housing shortage and massive unaffordability, and percieve chronic traffic congestion and parking shortages.
But it doesn’t have to be that way: A recent story about Singapore caught our eye: In Singapore, you can’t even buy a car without a government issued “certificate”—and the number of certificates is fixed city wide. The government auctions a fixed number of certificates each year, and the price has risen to more than $100,000. This means that a Toyota Camry, which costs about $30,000 in the US, would cost a Singapore buyer about six times as much (including all taxes and fees). Our housing and transportation problems are ones largely of our own making, reflecting the usually unexamined choices we’ve made about how we tax and regulate both.
Must Read
CalTrans whistleblower reveals highway widening bias. On the surface, California has bold policies that emphasize reducing vehicle miles traveled. But underneath the hood, the state’s DOT, CalTrans, is still a highway building and highway widening agency. Jeanie Ward-Waller, the agency’s deputy director for planning has been effectively fired, in retaliation, she argues, for calling out two deceptive and likely illegal steps the agency took to advance freeway widening projects that violate state and federal policies. Ward-Waller charges that CalTrans took money for “pavement restoration” and used it to pay for widening a stretch of Interstate 80, and also broke the project up into a series of smaller projects to avoid a close environmental review. These are tactics that other states have used as well, including Oregon. This is a particularly important case because it calls out the profound disparity between headline policies (we care about climate, and we’re going to reduce VMT), and actual bureaucratic performance (out of the limelight, we’ll divert funds and avoid environmental review, and keep widening highways the way we always have). Kudos to Ward -Waller for having the courage, at great personal expense, to call out this outrage.
California is spending precious little of its transportation budget on projects that reduce climate pollution. Hot on the heels of this whistleblower charge is a new report from the National Resources Defense Council taking a close look at how California spends its transportation dollars. Again, despite high-minded policy declarations about climate priorities, NRDC finds that less than 20 percent of state transportation spending goes to climate-friendly investments.
Our analysis finds that California state agencies have only allocated 18.6% of available funds towards projects and programs that are helping curb Californians’ reliance on private automobiles by investing in projects and programs like bike lanes, sidewalks, electric buses, mass transit, regional rail systems and affordable housing.
The remaining 81.4% is allocated respectively towards maintaining (71.7%) and expanding (9.7%) the current system of roads and highways that contribute not only to climate pollution, but also unhealthy air, urban sprawl and endemic traffic fatalities. NRDC’s number one recommendation, reads like the Hippocratic Oath: First, do no harm:
Discontinue funding for projects that increase highway capacity and thus increase VMT and greenhouse gas emissions. Projects should be rescoped to achieve project goals in ways that align with the State’s climate goals.
New Knowledge
Single young adults fuel population growth in DC. The DC Policy Center has an interesting new report charting key population changes in Washington. In contrast the the simple (and largely wrong) “doom loop” narratives, about cities, this study shows that dense, amenity-rich urban locations are still a powerful attraction for well-educated young adults.
The top-line census numbers for the District of Columbia appear to support the urban-doom loop scenario: Between 2019 and 2022, DC’s population declined by 3,500 persons. But while overall population totals declined slightly, there was an increase in the number of households,
. . . the number of households increased by 9.6 percent (27,994). Despite the uptick in households, during this period, the District has lost population: the city’s estimated population for 2021 was 668,791, a 5 percent decline from 2019.
The growth in the number of housheholds was fueled by individuals living alone. These single-person households tended to be young, and renters compared to the overall population. As the report points out, while the number of multi-person households in the district was flat to slightly declining; there was a significant increase in the number of single person households. The most notable change was among nonfamily renters living alone; their number increased from about 75,000 in 2015 to more than 100,000 households in 2021.
What the report shows is the very nuanced picture of population change and housing markets in the District of Columbia. Dense, urban living is obviously very attractive to many well-educated, single young adults. This demographic can use their buying power to bid for apartments (indicated by the 25,000 household increase in renters living alone). In effect, DC residents are consuming more housing, per person, than they did just five years ago. This likely reflects a combination of rising incomes (among these residents), a growing demand for residential space (post-pandemic), and the continuing attraction of urban living.
The growing demand for urban living among younger, single person households also signals the challenge to housing markets. The number of households is increasing faster than the population. As a result, a city has to grow its housing stock just to make sure that its population doesn’t decline. As we noted a few weeks ago, careful studies of New York City show that the city lost tens of thousands of housing units due to the consolidation of smaller apartments into larger ones. In the face of growing demand for urban living, cities have to move even faster to expand housing if they want to avoid population loss, displacement and declining affordability.
Bailey McConnel and Yesim Sayin, D.C.’s household growth is predominantly driven by singles aged 25 to 34, DC Policy Center, October 3, 2023
Portland: Four Floors and Corner Stores–Upzoning for urban development and housing affordability. A coalition of community, enviornmental and social justice groups is advocating for a YIMBY strategy for more housing in Portland’s close-in Eastside neighborhoods. Like many US cities, Portland faces tight housing markets, affordability challenges. This strategy aims at improving affordability by expanding supply, and doing so in the close-in urban neighborhoods on Portland’s Eastside, where housing demand is strong.
The coalition, led by Portland Neighbors Welcome, makes an explicit city-forward call to action.
Our vision is simple: it should be legal for any residential lot from roughly 12th to 60th, Fremont to Powell, to contribute to a thriving, mixed-income, mixed-use fabric of urban neighborhoods by allowing street-scale apartment buildings.
This heart of Portland, our Inner Eastside, can become a more equitable version of the Northwest Alphabet District: a dynamic, walkable, mixed-income neighborhood with a mix of mid-sized apartment buildings, single-family homes, and every type in between, well-served by transit, and with commercial centers, corner stores, and shared neighborhood spaces.
The strategy draws an analogy to Northwest Portland’s dense and popular “Alphabet” district; a traditional neighborhood on the city’s westside that has a robust mix of apartments, single family homes, shops and businesses. As we’ve pointed out at City Observatory, for most of the past century, city zoning codes have made this kind of neighborhood illegal to build. The Portland Neighbors Welcome proposal is would make it possible to build more of the kinds of walkable, bikeable, transit served places that people want to live in. It’s a smart way to tackle climate change, equity, and affordability.
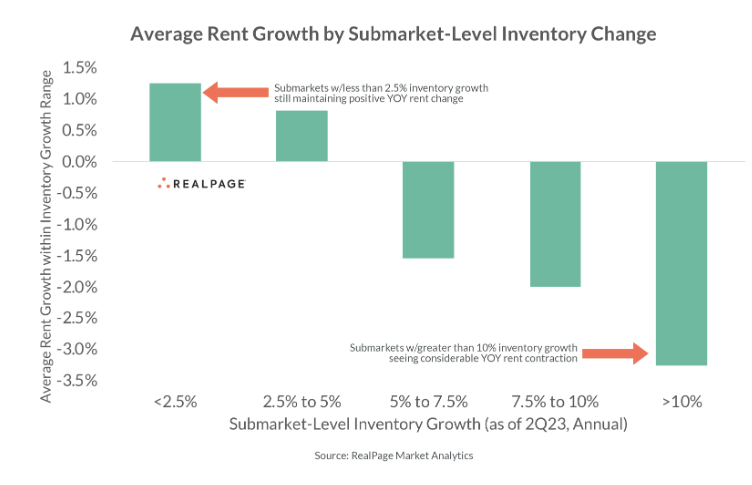
More housing, lower rents. There’s powerful evidence in the current housing market to show that increased local housing supply results in lower rates of rental inflation. Carl Whitaker, research director , Economist for Real Page, has tabulated the change in apartment rents and apartment completions for sub-metropolitan markets across the United States. Over the past year, those areas with the fastest local growth in housing supply have seen actual rent declines. Conversely, places with little or no growth in apartment completions have seen, on average, the highest rent increases.
Submarkets (parts of metropolitan areas) with increases in inventory growth (number of rental apartments) of 10 percent or more have seen, on average about 3 percent year-over-year declines in rents. Meanwhile, in submarkets where inventory growth is below 2.5 percent, rents have risen by about 1 percent. As Whitaker notes, the same pattern holds across metropolitan areas, as well as sub-markets:
There’s a remarkably clear relationship between supply levels and rent growth. In the 10 large metro areas with the deepest rent cuts, the average rate of apartment supply expansion was nearly double the U.S. average. In the markets with largest rent increases, on the other hand, the average rate of supply expansion came in below the national average.
The outlook for the coming year is favorable: a surge of new apartments is in the construction pipeline, which is likely to moderate rent growth. Notably, the relative glut of new completions follows on the rent increases experienced in 2021, and illustrates the challenges of “temporal mismatch” in housing markets. New housing, especially apartments, tends to get built in spurts, but tends to lag changes in demand and rents. Hence we observe rental inflation (when a surge in demand hits a relatively fixed stock of housing), and then declines in rental inflation (or actual rent declines) as new units are delivered a year or more later. So, for the next year or so, rents may moderate as new apartments are completed. But after that, the future trajectory of rent increases will hinge on further increases in housing supply.
A small—but likely Pyrrhic—victory for freeway fighters in Austin. The Texas Department of Transportation (TXDOT) is looking to foist its multi-billion dollar I-35 widening project on Austin, doubling down on decades of a freeway that’s divided the community and promoted automobile dependence. By a 7-3 vote, the Austin City Council voted to ask TXDOT to delay funding the project. Despite the city’s concerns, it seems likely that TXDOT will move ahead with the project regardless. Even advocates of the resolution conceded that freeway groundbreaking, scheduled for 2024, is “inevitable.”
City Councilors seem resigned to the project moving forward, and are somewhat forlornly hoping to “mitigate” its negative effects. To add insult to injury, a touted highway “cap” will happen only if the City of Austin comes up with half a billion dollar or more—TXDOT pay for it. be Cities that let their state highway departments make huge and irreversible infrastructure decisions will get more sprawl, pollution and auto-dependence. They’ll find it hard to maintain or cultivate the kind of vital urban spaces they desire.
Britain’s Caste system of transportation. In a cynical ploy to revive the Conservative Party’s flagging electoral hopes, Prime Minister Rishi Sunak has engaged in some blatant pro-motorist posturing.
Saying that drivers “feel under attack” Sunak has declared that Britain is “a nation of drivers.” Sunak’s claim highlights what we’ve long argued at City Observatory: that in a nation of drivers, those who walk, cycle and take transit are effectively members of a lower caste, not full citizens. As egregious as Sunak’s claims about “a nation of drivers” are, they may serve the useful purpose of laying bare the hitherto unspoken discrimination embedded in current transportation policies.
Must Read
The Empire Strikes Back: How state highway departments are co-opting and perverting the “Reconnecting Communities” program. Much has been made of the $1 billion included in the Bipartisan Infrastructure Law to mitigate the damage done to urban neighborhoods by freeway construction. The $1 billion was effectively a pittance, especially compared with the continued generous funding for even more destructive highway projects, but even that small amount of funding is being twisted by state highway departments to create projects that double-down on harmful roadways rather than actually restoring damaged neighborhoods.
Writing at Streetsblog, Adam Paul Susaneck, author of Segregation by Design—which publishes compelling illustrations of how freeway construction decimated cities across the country—points out that “freeway covers” are routinely used as cover—for widening highways.
While putting a highway underground can seem an intuitive solution to reconnect the communities above, because these same mid-century standards are still embedded in nationwide transportation policy, the reality is that such projects often become, at best, a form of “greenwashing” and, at worst, Trojan horses for further highway expansion.
In Portland, Brooklyn, Austin, and St. Paul, highway departments use covers as a mask for highway widening. Expanding highway capacity, even when its partially concealed by a few blocks of freeway cover, fails to fix the devastatingly negative effects of highways on the urban landscape: It’s the flow of cars and pollution that devastates communities, not the insufficiently aesthetic appearance of uncovered freeways.
In Michigan, that state’s department of transportation is looking to turn a little-used one mile stretch of I-375 into a boulevard, but in the process is creating a roadway that will be even more hostile to pedestrians–and as divisive for the community–as the depressed freeway it replaces. The boulevard will be six to nine lanes wide, with a median barrier—included because pedestrians won’t be allowed to cross both directions during one signal phase, and to protect traffic flow and shorten travel times. As local resident and architecture professor Bryan Boyer notes,
“Instead of reconnecting communities, it is going to make a bigger gulf between downtown and the eastside. Instead of being safer for people who are walking or biking, particularly in the east-west direction, it’s going to be more dangerous.”
Anika Goss of Detroit Future City argues:
“It would be disingenuous for us to build a freeway over the previous freeway and call it reparative because we put up a historical marker.”
MDOT officials respond to these criticisms with the frequently used dodge that the project is “only 30 percent designed”—which seems to imply that there’s plenty of opportunity to change things. But the reality is that the agency is locked in on a six- to nine-lane roadway, and the agency is prioritizing traffic flow over all other considerations.
Speaking out on behalf of a whistleblower. As we reported last week, the California Department of Transportation has demoted Deputy DirectorJeanie Ward-Waller after she filed a whistle-blower complaint against the agency for violating its own rules and state law to fund highway widening projects. For too long, state highway departments have proffered greenwashed policies, while cynically pursuing projects that simply lead to more traffic and pollution. This case is an opportunity to call out their duplicity. America Walks has started a nationwide petition drive to challenge these egregious actions and support a moratorium on highway expansions in California .
A coalition of allies in California is now calling for Governor Newsom to investigate this malpractice and to pause highway expansion projects throughout the state until it is completed. The coalition has asked for national support in convincing Governor Newsom this is the right thing to do
More climate fraud in Portland Metro’s proposed regional transportation plan. We branded Metro’s proposed Regional Transportation Plan (RTP) a climate fraud because in falsely claimed the region was reducing greenhouse gases, and falsely claimed its transportation investments were on track to meet adopted state climate goals.
Metro’ staff has responded to these critiques, but proposes only to fix these mistakes at some vague future time, and more importantly, make absolutely no substantive policy or investment changes to the RTP.
In essence, the staff response puts the lie to the claim that climate/GHG reductions are the “controlling measure” in RTP system planning. Whether Metro is on track to achieve its committed GHG reductions or not has no bearing on any of the substantive policy and spending decisions in the RTP.
Moreover, this is a straightforward violation of the policies enacted in Metro’s 2014 Climate Smart Strategy (and reiterated in the 2018 RTP, and current RTP draft), to continuously monitor progress in GHG reduction and undertake additional measures if we were not making adequate progress.
Must Read
Garrison Keillor on cities and civility. Writing at Substack, Garrison Keillor reflects on how walking and taking transit in cities brings us closer together. In an essay, “Standing at 86th, Waiting for a Train,” Keillor observes:
The city attracts aspiring artists, writers, actors, musicians, who are prepared to live in poverty, wait on table if necessary, while scrambling for a break. The quickest way around town is the subway, where unemployed actors, highly paid CEOs, cleaning ladies, digital geniuses, and ordinary working stiffs merge in a river of humanity. There is no Business Class on the A train. In the subway stations, you will find refugees from South America selling cups of fruit, as well as panhandlers, and outright crazy people, all on foot, and to a refugee from the Midwest and suburban freeway culture, this is at first disconcerting and then inspiring. The civility that prevails gives you faith in your fellow man. The politeness shown to a parent of a little kid in a stroller, or an old man using a cane, or an autistic person, is just as third-grade teachers have taught their pupils for generations. People who shove are spoken to, or at least glared at. Passengers stand packed in a rush-hour train doing their best to respect each other’s personal space.
CalTrans: Freeways for the People! In the wake of whistleblower revelations that the California highway department is flouting environmental laws, illegally using maintenance funds to widen roads, and generally subverting the state’s climate plans, the California Transportation Commission pushed back. The commission’s chair, from famously car-dependent Fresno tearfully claimed that wider roads were “for the people.” All this flies in the face of scientific evidence that widening roads does nothing to reduce congestion and travel times, increases driving and pollution, and leads to more sprawl and car-dependence.
Like other state DOT’s parade bike lanes and pedestrian facilities, but devote spend orders of magnitude more funds on widening roadways. CalTrans director xxxx tweeted about the agencies bike projects, but the reality is captured more by giant freeway widenings.
Renderings of giant freeway projects invariably show that they will be little used. If that were really the case, there would be no reason to spend billions making them so large.
A new study looks at how the changing patterns of grocery store location and residential development are affecting travel patterns. The study is a detailed, multi-decade examination of two towns in Norway. The authors plot the location of grocery stores and residents in 1980 and 2019, and compute the walking distances to the nearest store. Here’s a map of Lørenskog, showing 1980 stores. Over time, there are fewer grocery stores and they are, on average, further from homes. The number of grocery stores declined from 23 in 1980 to 16 in 2019, with stores closing in central locations (shaded circles) and new stores opening in somewhat more peripheral locations. The number of grocery stores fell by about one-third, even as population increased by almost 50 percent.
The net effect of store closures and new store openings was to increase the average distance to the nearest grocery store. In 1980, 55 percent of residents lived within 500 meters of the nearest grocery; by 2019 only about 35 percent were that close.
Over four decades, the number of grocery stores declined, population decentralized, and the average household ended up further from the nearest store. These trends have important implications for transportation policy. With common destinations like stores further away, fewer people will walk, and more people will choose to use (and own) cars in order to perform basic daily tasks.
. . . this change in distances represents a kind of lock-in effect: Increased distances to essential locations make a modal shift from car to more sustainable transport modes difficult to achieve.The changes in accessibility illustrated in this paper are likely parts of structural conditions of locations at neighbourhood-, city- and county scale that are so decisive for travel mode choice that the contrary effects of policies and interventions trying to reduce car driving as currently applied by the government, such as increased toll roads for private cars and providing new bicycle lanes, are overruled.
In addition—though not noted in the study—growing levels of car ownership change the competitive economic landscape of grocery retailing, making it harder for small neighborhood stores to compete against larger shops with better selection, and often lower prices.
Rokseth, L.S., Heinen, E., Hauglin, E.A. et al. Reducing private car demand, fact or fiction? A study mapping changes in accessibility to grocery stores in Norway. Eur. Transp. Res. Rev.13, 39 (2021). https://doi.org/10.1186/s12544-021-00500-7
What apartment consolidation in New York tells us about housing markets and gentrification. A new study shows that over the past several decades, New York City lost more than 100,000 homes due to the combination of smaller, more affordable apartments into larger, more luxurious homes
When rich people can’t buy new luxury housing, they buy up, and combine small apartments to create larger homes.
The illusive New York apartment (Flickr: Sharona Gott)
If you’re worried about gentrification and displacement, this is a vastly larger problem than new construction–which has been repeatedly shown to lower rents and create more housing opportunities for lower income households.
Must Read
Why Portland’s downtown is doing much better than you’ve been told. Local and national press have flogged downtown Portland’s supposedly tepid recovery from the Covid pandemic based on statistics generated by the University of Toronto. That study looks at pre- and post-pandemic cell phone data for selected neighborhoods in major US cities, and rates Portland second to last for the percentage of activity recovered since 2020. But economist Mary King, writing at Portland’s Street Roots digs into that data and exposes some serious flaws.
The University of Toronto data look at only a single (and unrepresentative) part of downtown Portland (with only about 1,000 residents), and count only changes in unique visitors (effectively discounting daily, repeat travelers. And the study uses widely varying geographies for different cities; San Diego’s counts reflect both its airport and famous Zoo, and naturally shown a dramatic rebound in unique visitor counts. As King reports:
Counting all visits and using a much bigger definition of downtown, the Portland Metro Chamber reports Portland had nearly two-thirds as many visits in June 2023 as in June 2019. In stark contrast, the Toronto study asserts that there were just 37% as many visitors to “downtown Portland” from March through May 2023 as in 2019.
In short, the University of Toronto data don’t offer an apples-to-apples comparison of cities; more robust data suggests that Portland’s experience is similar to other US downtowns.
Fantasy models: Their costs and consequences. David Levinson who blogs at The Transportist, is one of the world’s leading transportation scholars. He’s got a must read essay that debunks the pseudo-science behind traffic modeling, and importantly lays out its consequences for how we build our communities, how we live. These seemingly trivial technocratic details hamstring our ability to think and plan differently. The four-step models used by most transportation planners underpin a “predict and provide” approach to transport investment that fuels more car dependency. As Levinson says:
Overly optimistic models can mislead decision-makers into supporting the wrong transport projects, projects that are not viable, cost-effective, or beneficial to the public. This can result in the approval of projects that might never reach completion or fail to deliver the promised benefits, wasting time, money, and political capital.
Unrealistic models can also contribute to environmentally harmful decision-making. By underestimating the potential impacts of a project on air quality, greenhouse gas emissions, or natural habitats, leads to projects that compromise environmental sustainability and public health.
While the problem is bad models, the solution is not to simply try to make the models somewhat better: Their limitations are inherent. Levinson argues we need to be smaller scale, adaptive and incremental in our approach to transportation.
Costlier car insurance. The Washington Post looks at the big jumps in car insurance rates around the country. Higher insurance costs are both a symptom and a cause of inflation: cars are more expensive to replace and repair, and climate has increased losses (especially in state’s with climate driven fire, flood and storm damage). These costs drive up insurance rates, and car insurance is one component of the consumer price index:
Premiums have kept climbing even as other types of inflation have cooled. According to the Bureau of Labor Statistics, car insurance for U.S. drivers in July was 16 percent more expensive than in July 2022, and 70 percent more expensive than in 2013.
While there’s considerable variation across states, most states have seen substantial increases in the past year.
Reviewing the opening for Fast Company, Nate Berg writes:
In Memphis, Tennessee, a remarkable new public park has just opened. Filling 30 acres along the edge of the Mississippi River with active, social, ecological, and architectural spaces, it could reframe the city’s fading connection to the riverfront. It could also set a new standard for what waterfront parks can do.
Congratulations to City Observatory friend Carol Coletta and Memphis Riverparks for this impressive accomplishment.
New Knowledge
Rent and inflation. ApartmentList.com has some of the most careful, thorough and transparent data and analyses of rental market trends in the U.S. Their latest work sheds light on the connections between overall inflation trends in the US, and ongoing changes in the apartment market.
In 2021 and 2022, a surge in rents as we recovered from the pandemic was a key contributor to the rapid run-up in overall consumer prices. Rents, logically, are a key consumer expense, and higher rents mean higher inflation. But there are key differences between the current market data (as estimated by ApartmentList.com, and others), and the rental price inflation that the Bureau of Labor Statistics uses to compute the official consumer price index. In effect, changes in market rents feed into the CPI, but with a bit of a lag. As a result, looking at ApartmentList.com data gives you a good idea of how the official inflation rate is likely to be affected by changing rents in the months ahead.
That’s why you should pay particular attention to this chart, which shows the ApartmentList.com rental inflation estimate, the BLS rent inflation estimate, and the overall CPI.
As Rob Warnock of ApartmentList.com writes:
The Apartment List National Rent Index has proven to be a strong leading indicator of the CPI housing and rent components, as we captures price changes in new leases, which eventually trickle down into price changes across all leases (what the CPI measures). Because of these methodological differences, when our index peaked with record-setting rent growth in 2021 (+17.8 percent), the rent component of CPI was still just starting to heat up, even as overall inflation had already become a key economic issue for policymakers and everyday Americans. Now in 2023, our index shows that the rental market has been cooling rapidly for a year, but the CPI housing component has just recently hit its peak. Despite the CPI’s measure of housing inflation remaining elevated, topline inflation has already meaningfully cooled. As the CPI housing component now gradually begins to reflect the cooldown that we’ve long been reporting, it will help to further curb topline inflation in the months ahead.
The ApartmentList analysis shows that rents are coming down in most markets around the US, with year over year declines in 72 of the 100 largest markets. This shift is underpinned by fundamentals, including increasing completions of new apartments in most markets, and evidenced by a vacancy rate that is now at pre-pandemic levels. All this bodes well for improvements in housing affordability, overall, in the next year. And this will also show up in reduced rates of headline inflation.
Rob Warnock, Apartment List National Rent Report, September 2023. ApartmentList.com