The triumph of the City and the twilight of nerdistans

This is a story about the triumph of the City—not “the city” that Ed Glaeser has written about in sweeping global and historic terms—but the triumph of a particular city: San Francisco.

For decades, the San Francisco Bay Area’s economy has been a microcosm and a hot house for studying the interplay between innovation, economic prosperity, urban form and social impacts. It gave us the quintessential model of technological geography, Silicon Valley. And today, it’s showing us how that geography is changing—and shifting towards cities.

As a graduate student at the University of California, Berkeley, more than three decades ago, one of the first things I learned about living in Bay Area was that the large city between us and the Pacific Ocean was not “San Fran” nor “SF,” and especially not “Frisco.” San Francisco was simply “the City.”

In the late ’70s and early ’80s, San Francisco was the queen of her little geographic universe, the center of arts, culture, and commerce in Northern California. That was heyday of San Francisco Chronicle columnist Herb Caen, the martyred Harvey Milk, and George Moscone in City Hall. In the wake of Prop. 13, California’s voter-adopted property tax limitation measure, there was a lot of political unrest that led to, among other things, rent control in the City.

Down Highway 101, there was Silicon Valley—or, to those in the Bay Area, simply “the Valley.” Santa Clara County, on the peninsula south of San Francisco, was long regarded as an agricultural hinterland—much as the Central Valley or Salinas are thought of today. The Stanford University campus, the South Bay’s major intellectual center, was (and still is) nicknamed “the Farm”; the area was historically famous for its fruit orchards. But all that changed. San Jose and its surrounding communities grew steadily in the 1960s, 1970s, and 1980s to become the economic hotbed of the region. The personal computer was essentially invented in Silicon Valley garages. Hewlett-Packard, Intel, and Apple all got their start in The Valley. Cities and states across the nation and the world set about trying to replicate what they perceived to be the elements of Silicon Valley’s success: research universities, science parks, technology transfer offices, entrepreneurship programs, and venture capital investment. But no matter how many emulators emerged, Silicon Valley remained the dominant epicenter of new technology firms in the U.S.

As the Valley grew, the City seemed quaint and dowdy by comparison. In the 1990s, it lost some of its corporate crown jewels, as Bank of America decamped its headquarters to—shudder—North Carolina. Sure, the City had its counter-cultural cred with the Jefferson Airplane and, later, Dead Kennedys and others, but the Valley was where the work got done.

The technology wave, particularly the personal computer and the Internet, seemed to bypass San Francisco of the big new firms, the Ciscos, the Oracles, the Googles, got their start in Silicon Valley and grew there. Measured by gross domestic product per capita, San Jose blew by San Francisco in the 1990s, and never looked back. It was, as Joel Kotkin famously argued, the victory of the suburban nerdistans. Engineers and businesspeople wanted to live split-level houses on large lots in suburbs and drive, alone, to work each day. While Kotkin admitted that some creative types might gravitate toward Richard Florida’s boho cities, he pushed that most job growth would be in sensible suburbs:

“Today’s most rapidly expanding economic regions remain those that reflect the values and cultural preferences of the nerdish culture — as epitomized by the technology-dominated, culturally undernourished environs of Silicon Valley. In the coming decade, we are likely to see the continued migration of traditional high-tech firms to new nerdistans in places like Orange County, Calif., north Dallas, Northern Virginia, Raleigh-Durham and around Redmond, Wash., home base for Microsoft.”

But for the past decade or so, and most notably since the end of the Great Recession, a funny thing has happened. Tech has been growing faster in the City than in the Valley. Lots of new firms working on new Internet technology plays—the Ubers, the AirBnBs, the SalesForces—started up in San Francisco and grew there. At the same time, more and more young tech workers, not unlike the young workers nationally, had a growing preference for urban living. The City is a lot more urbane than the Valley. As Richard Florida has chronicled, venture capital investment, perhaps the best leading indicator of future technology growth, has shifted from the suburbs to the cities—nowhere more strikingly than in the San Francisco Bay Area.

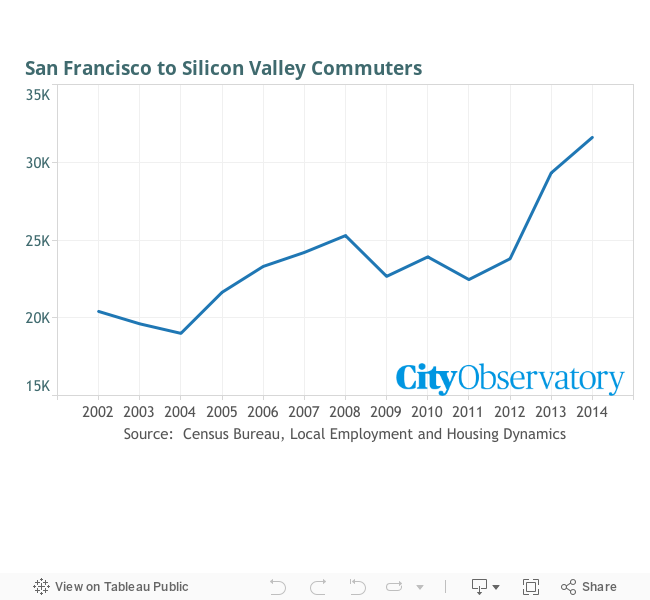
And so, to accommodate the needs and desires of their most precious input—the human capital of their workers—Silicon Valley companies started running their own subsidized, point-to-point transit services. The “Google buses” pick up workers in high-demand neighborhoods in San Francisco and ferry them, in air-conditioned, wifi-enabled comfort, to prosaic suburban office campuses 30 or 40 miles south. These buses became the flashpoint for protests about the changing demographics and economic wave sweeping over the city, as Kim-Mai Cutler explained in her epic TechCrunch essay, “How Burrowing Owls Led to Vomiting Anarchists.” In the past 12 years, the number of workers commuting from San Francisco to jobs in Santa Clara County has increased by 50 percent, according to data from the Census Bureau’s Local Employment and Housing Dynamics data series.

Those trends came to their logical culmination this week. The San Francisco Business Times reported that Facebook, now headquartered in the Valley’s Menlo Park, is exploring the construction of a major office complex in San Francisco. According to the Times’ reporting, the company’s decision is driven by the growing desire of its workers to live in urban environments. Additionally, Facebook has faced competition and poaching for talent from San Francisco-based companies, including Uber.

Facebook’s interest in a San Francisco office is just one harbinger of the northward movement of the tech industry. Apple, which has famously insisted that its employees work in its campus in Cupertino, has recently leased office space in San Francisco’s SoMa neighborhood. Google now has an estimated 2,500 employees in San Francisco, and has purchased and leased property in the city’s financial district.

The miserable commute to Silicon Valley from San Francisco means that busy tech workers find it more desirable to work closer to where they live. Paradoxically, as Kim-Mai Cutler warned, the protests and obstacles to Google and other tech buses are prompting tech companies to expand their operations in The City, which brings in even more tech workers to bid up the price of housing there. As she tweeted on July 25:

kimmai_gbus_tweet

As we’ve chronicled at City Observatory, jobs are moving back into city centers around the country, reversing a decades-long trend of employment decentralization. Companies as diverse as McDonalds, which is relocating from suburban Oak Brook to downtown Chicago, and GE, which will move from a suburban Connecticut campus to downtown Boston, all cite the strong desire to access talented workers. Those workers are are increasingly choosing to live in cities. While we view the resurgence of city center economies as a positive development, it also poses important challenges, especially concerning housing supply and affordability. For economic and equity reasons, it is critical that we tackle the nation’s growing shortage of cities.

Our apologies to Ed Glaeser for borrowing the title of his excellent book, The Triumph of the City: How Our Greatest Invention Makes Us Richer, Smarter, Greener, Healthier, and Happier, for this commentary. We’re deeply indebted to Dr. Glaeser for outlining many of the forces at work in America’s cities, including agglomeration economies and the theory of the consumer city. These are chief among the explanations for the recent triumph of San Francisco over Silicon Valley.

The party platforms on housing

Urban policy conversations are largely focused on local policy, though we at City Observatory have occasionally argued that more attention ought to be paid to state and federal policy.

We haven’t had much to say about the presidential candidates themselves this year, but one exercise that’s worth paying a bit of attention to is the writing of each major party’s official policy platforms. These are documents without any legislative power, of course—but they do indicate the state of the public debate within each of the major parties. Moreover, as FiveThirtyEight argues, there’s evidence that what gets put in the platform predicts real policy tomorrow.

So today, we’ll look at what the platforms say about housing. Later, we’ll focus on transportation.

Both the Republican and Democratic platforms focus on homeownership in their (brief) forays into housing. “Homeownership expands personal liberty, builds communities, and helps Americans create wealth,” says the Republican platform; the Democratic one has no such paean but makes increasing access to homeownership the subject of one of its four paragraphs on housing. (Regular readers will know we are skeptical.)

Perhaps predictably, the Republican platform calls for “scal[ing] back the federal role in the housing market,” although there are few details about exactly what this means. It appears to be targeted mainly at programs meant to expand credit to low-income households to buy homes, which the platform blames for the housing crisis of the 2000s. (Many economists do not agree.) They also mention ending Federal Housing Administration mortgage support for “high-income individuals” and ending requirements for federally-insured banks to “satisfy lending quotas to specific groups,” presumably a reference to the Community Reinvestment Act, which is meant to counteract the effects of years of “redlining” by guaranteeing credit access to communities with large numbers of black, Latino, and low-income residents.

Credit: City of Jacksonville


The Democratic platform’s section on housing is much shorter even than the Republicans’. About half of it is dedicated to improving housing affordability; it promises to “substantially increase funding” for the National Housing Trust Fund, and “provide more federal resources to the people struggling most with affordable housing,” though the mechanism is vague. (In case you guys are looking for one, you could try our automatic tax credit idea!) Vouchers, public housing, and anti-homelessness programs are mentioned in the most perfunctory possible way, with promises of more funding.

Perhaps the most interesting, and surprising, issue is zoning. The Republican platform is the only one to explicitly use the word—a change from 2012, when it did not appear. “The current Administration is trying to seize control of the zoning process through its Affirmatively Furthering Fair Housing regulation,” it says. “It threatens to undermine zoning laws in order to socially engineer every community in the country.” This is disappointing inasmuch as some conservatives have argued that the generally anti-regulation party might be an ally in the fight against sprawl-inducing, segregation-promoting local development rules. But it’s also unsurprising inasmuch as many local Republican officials and writers have been enthusiastic defenders of the hyper-regulation of property rights when it comes to urban space.

Meanwhile, the Democratic platform doesn’t include the word “zoning,” but it does say that the party will attempt to “eas[e] local barriers to building new affordable rental housing developments in areas of economic opportunity.” Given the Democratic administration’s ongoing fight with Westchester County, New York, that seems like a clear reference to battling low-density zoning regulations that make below-market housing difficult or impossible to construct in certain areas—and a recognition of the importance of economic integration to opportunity. But it appears to leave out the growing consensus among researchers from across the political spectrum that building market-rate housing is also a key part of any affordability strategy.

Platforms are ultimately political documents, and this year, that’s especially the case as it relates to housing policies. While we’d like to believe that the platforms would clearly spell out the differences between the two parties, and give voters a clear choice of direction. The 2008 campaign, in part, hinged on different approaches to health care reform and helped provide President Obama with a mandate that led to the enactment of the Affordable Care Act. The smaller bore and more muted discussions presented here don’t suggest that either party has much interest in making the election hinge on housing issues, or in building a strong public consensus for bold policy action in this area.  

Paul Romer to the World Bank

Today we’re getting really wonky. Paul Romer, who’s currently at New York University’s Marron Institute has just been appointed to be the chief economist for the World Bank. Personnel decisions involving technocratic positions at global NGOs is about as wonky as it gets, of course. But this is a genuinely interesting development, especially if you’re passionate about cities, and economies, as we are.

Paul Romer at TED University. TED2011. February 28 - March 4, Long Beach, CA. Credit: James Duncan Davidson / TED
Paul Romer (James Duncan Davidson / TED)


First, an introduction:  Romer is a prolific and wide-ranging economist.  He’s most famous for his work in creating what’s come to be called “New Growth Theory” (NGT).  It bears a much longer and more precise description, but briefly, NGT focuses on the critical role that creating new ideas plays in driving long term economic growth.  The reason we become more prosperous over time, is not because we accumulate more stuff, but because we continuously generate new and better ways of making use of the finite materials around us.  A critical property of ideas are that they are “non-rival”–you and I can equally make use of an idea without diminishing its utility to one another.  Romer pointed out that non-rivalry is crucial for driving growth, and for some pretty technical reasons, it also means that unfettered free markets can’t automatically generate the conditions that produce long term growth.  As a result, the kinds of institutional arrangements we create, both nationally and locally, are very important to whether we experience growth or not.

New Growth Theory has an important implication for cities.  Cities are, as Jane Jacobs argued decades ago, the crucibles and laboratories where new ideas — what Jacobs called “new work” gets created.  The combination of a diverse population, frequent interaction, and the right set of rules or institutions is what makes economies grow–and these forces play out most dramatically in cities.  (For a much longer explanation of NGT and its policy implications you can read a report I wrote for the US Economic Development Administration).

Romer explained this all in a quite accessible article written for the World Bank 25 year ago, entitled “Two Strategies for Economic Development:  Using Ideas and Producing Ideas.”  This article demonstrates Romer’s keen ability to translate complex economic arguments into simple and powerful metaphors.  He illustrates the difference between traditional views of economic growth and the knowledge-driven growth of new growth theory by contrasting two child’s toys.  The conventional model is the Play-Dough Fun Factory.  It combines capital (the plastic press and dies) with labor (a child’s arm) and raw materials (clay) to produce tubes, I-beams, and other shapes.  This model (and the very math-ey versions of it used by economists) are good for thinking about production efficiency and allocation, but don’t help much to explain how growth happens. 

Conventional Growth Theory


In contrast, New Growth Theory visualizes the growth process much as if it were a child’s chemistry set.  It turns out that there are so many different possible combinations of even a few handfuls of ordinary chemicals, that its simply impossible for a manufacturer to verify that all of the ways they might be mixed would turn out not to be hazardous or explosive (which for many children is the chief motivation for playing with chemicals).  That’s a downside for chemical companies, their risk analysts, attorney and insurance companies, but its got a surprisingly optimistic implication for long run economic growth.

New Growth Theory (Flickr: Russel Oskay)


The point is that prosperity is driven by the nearly inexhaustible opportunities to create new ideas–new combinations of things–that produce useful products and services.  The trick is figuring out the kinds of institutional arrangements that will prompt people to undertake the experiments that will generate these ideas. This has a critical implication for cities, as Romer explains:

“As the world becomes more and more closely integrated, the feature that will increasingly differentiate one geographic area (city or country) from another will be the quality of public institutions. The most successful areas will be the ones with the most competent and effective mechanisms for supporting collective interests, especially in the production of new ideas.”

In recent years, Romer has been a strong advocate of cities, and has pointed out the direct relationship between urbanization and economic and productivity growth.  Across countries, within countries, and over time, a higher degree of urbanization is strongly correlated with greater economic output.

Romer_GDP_Urbanization
More urban, more productive. (www.paulromer.net)


The question going forward is what we might do to harness the growth potential of cities as places that offer new ways to do things and develop ideas.  He proposed the idea of “Charter Cities” — de novo city-states that would experiment with new institutional arrangements, looking to generate the kind of growth that we’ve seen in places like Singapore, Hong Kong and Shenzen.  An abortive attempt to do actually try this out in Honduras actually died stillborn–for reasons that illustrate what it will take to really make such a proposal work.  

More recently, he’s also made the case that creating new cities would be one of the ways that Europe might better respond to its refugee crisis:  HIs argument, in a nutshell:

1.  It takes only a few cities, on very little land, to accommodate tens or hundreds of millions of people.

2. Building cities does not take charity. A city is worth far more than it costs to build.

3. To build a city, do not copy Field of Dreams. (“Build it and they will come.”) Copy Burning Man. (“Let them come, and they will build it.”)

The World Bank is the dispenser, not just of billions of dollars in loans for less developed nations, but is also the dispenser of the the conventional wisdom, especially when it comes to cutting edge development strategies.  Its notions about the processes and strategies that can stimulate economic growth have immediate, practical and widespread implications.

Romer is a brilliant and original thinker, and is an economist who is willing to fully explore the policy implications of his theoretical work, and regularly comes up with ideas that make us look differently at the world.  He’s somebody who sees cities at the center of the solution to many of the globe’s most pressing problems. We’re excited to see what he does at this new job.


How gentrification affects small businesses

When we talk about gentrification, we often focus on housing. But another major concern is the effects of rising prices on retail—both because of what it means about the accessibility of goods and services for local residents, and because of questions of “community character.”

The Philadelphia Federal Reserve Bank’s recent symposium on gentrification included a paper from Rachel Meltzer of The New School on just this subject. Meltzer begins by indicating two ways that gentrification might affect small businesses: changing the kinds of goods and services that local residents demand, and changing the cost of doing business, making some lower-margin businesses no longer profitable.

Meltzer then explores data from New York City between 1990 and 2011 to look at how small business retention rates vary between neighborhoods that are gentrifying, and those that aren’t. The overall results, perhaps counterintuitively, show virtually no difference. In fact, the percentage of small businesses that leave their storefront and are replaced by another business—the kind of scenario you’d expect to see in a gentrifying neighborhood, with (say) bodegas getting replaced by artisanal coffee shops—is very slightly higher in non-gentrifying neighborhoods than in gentrifying ones.

Credit: Rachel Meltzer


The essential fact here is that local storefront businesses have a high rate of turnover generally. So while there are lots of examples of businesses going out of existence in gentrifying neighborhoods, there are lots of examples in other kinds of neighborhoods as well.

At a closer-to-the-ground level, looking at differences in business retention between Census tracts in the same neighborhoods, Meltzer does find some distinctions: Businesses are less likely to leave without a replacement—that is, create a vacancy—but somewhat more likely to leave with a replacement in gentrifying areas.

The takeaway is not necessarily that business displacement never happens in gentrifying neighborhoods—plenty of people in high-cost cities can cite a favorite old business that relocated or disappeared because of rising lease costs.

Rather, the results of this study on retail displacement are strikingly similar in some ways to the results of studies about residential displacement: while there are certainly examples of it happening, systematic studies that compare gentrifying and non-gentrifying neighborhoods repeatedly fail to find that there’s significantly less displacement in non-gentrifying neighborhoods. And just as rising apartment rents may sometimes be offset by an increased willingness to pay because of better neighborhood amenities, rising retail lease prices might be offset by more and higher-income customers who are willing to pay more or buy more high-margin products. More customers with more disposable income translates into higher sales, which can enable businesses to still profit while paying a higher rent. On the other side, just as non-gentrifying low-income neighborhoods usually see a kind of “displacement,” with rapidly declining populations as people leave for areas with stronger neighborhood amenities, local businesses in these neighborhoods may also struggle to remain in a place with a declining customer base. In these struggling neighborhoods, low or stagnant incomes mean relatively lower sales for local merchants, making it hard for them to be profitable, even if rents are low.

In other words, with business displacement as with residential displacement, the reality of gentrification appears to be much more complicated than prevailing narratives. It is not clear that gentrification leads to higher levels of small business turnover.

Housing Cost Calculators

Suddenly, we’re awash in calculators. Housing calculators.

If you’re a Baby Boomer, you remember the day you saw your first electronic calculator. It had an electronic display–red or green light-emitting diode segments, usually eight or ten of them that would display numbers, arithmetic operators and a decimal point. They had a few hard-to-press chicklet type keys, but they would add, subtract, multiply and divide with a speed and accuracy that was previously unavailable. Precise math suddenly became easier. (And if you typed in 07734 and turned it upside down it looked like is was saying “hELL0.”)

Calculators (Flickr: Marcin Wichary)


In the past few months, we’ve seen the advent of a new generation of calculators–housing calculators, aimed at helping us understand the complex dynamics of financing and affording housing. Like the early days of the electronic pocket calculator, there are a lot of competing brands and different designs. Each of these calculators looks at the interplay of different factors that influence the feasibility of building new housing, embracing a range of purely private sector considerations (construction costs, interest rates, rents) and some public policies as well (inclusionary zoning, parking requirements, height limits, planning processes). All are designed as generalized “what if” models, and specifically disclaim their use for investment purposes.

The latest of these is the Urban Institute’s new “Affordable Housing: Does it Pencil Out” website, released today. In theory, these tools ought to give us a clearer picture of the factors influencing housing affordability and how we might make some progress in tackling this problem. Here’s a quick thumbnail of it, and three other examples of the genre.

Urban Institute: Does it Pencil Out?

The Urban Institute
The Urban Institute

The Urban Institute’s calculator estimates construction costs and rents for apartments built in Denver, which it characterizes as a fairly typical metropolitan area. You are given the choice of modeling a 50 or 100 unit apartment building, and you can see how varying the level of rent charged and some key development costs (like interest rates, land costs, construction costs, and operating costs) influence the profitability of a proposed development. The site’s key conclusion: It’s very difficult to build housing that’s affordable to anyone below 100 percent of area median incomes without some sort of subsidy.

Terner Center, UC Berkeley: Will Housing be Built

Terner
Terner Center, UC Berkeley

The Terner Center’s calculator takes a slightly different approach than the other calculators presented here, and as its name suggests, offers up its estimates of the probability that a particular housing development will go forward under different assumptions about financing, affordability requirements, rents, construction costs and approval processes. It’s calibrated using data from Oakland California. The Terner Center model has a rich set of controls that let you explore the impacts of varying inclusionary zoning requirements, parking requirements, and uniquely, the impact of a more attenuated approval process.

Cornerstone Partnership: Inclusionary Calculator

Cornerstone_Partnership
Cornerstone Partnership

Cornerstone Partnership, a housing advocacy network, has created its own tool which lets the user select the number of units to build, construction costs, the cost of land, parking requirements, interest rates and rents, and other variables. The model then estimates the total cost of the project and whether it is profitable. Projects that generate more than a ten percent rate of return for the investor are judged feasible. Unlike the other calculators presented here, you have to register with the website to use this calculator.

Citizen’s Housing and Planning Council (NY): Inside the Rent

Inside_the_Rent
Inside the Rent

This calculator, built for New York City, allows the user to see the factors that influence the rental cost of new apartment construction in different neighborhoods in New York City. Between land, construction, soft costs and financing, new apartments in a mid-rise building in a typical neighborhood have a sticker price of around $500,000; and unsubsidized rents for these newly constructed units run at more than $4,000 a month. A unique feature of this calculator is its effort to estimate the cost of paying prevailing wages for construction and upkeep.

Some thoughts on the state of the art in housing calculators

While billed as calculators or tools, each of these is actually a gussied-up, html-coded quantitative model. Like all models, each is only as good as the assumptions that it’s based on. An ideal model is transparent about what its assumptions are, and enables the user to test those assumptions. But frequently models–especially complex models–make it difficult know exactly which assumptions are driving its conclusions. Different modelers will choose different assumptions–which may be buried deep in a model’s structure–which may unfortunately conceal biases.

These calculators have some similarities: They let you vary key financial parameters, like the price of land, rent levels, interest rates, construction costs, the amount of affordable housing included, and the extent of the public subsidy. They’re particularly useful for exploring the tradeoffs and costs of different policies; parking requirements and construction delays can move an otherwise likely and feasible development into the risky or unprofitable categories.

What’s difficult — and maddening, though not surprising — is how difficult it is to compare the results of the different calculators. They use varying terminology and definitions, and seem to have a wide range of assumptions. They are individually complex, and produce results that are framed differently, so that one can’t easily say how two calculators would appraise a project with the same inputs.

For example, the Urban Institute’s Will it Pencil and Cornerstone’s Inclusionary Calculator seem to produce very different messages about housing affordability. The authors of Cornerstone Partnership model use it to support their claim that developers can profitably build additional units of affordable housing with modest or no subsidies while remaining profitable. CityLab summarized the model’s conclusions as: “A new tool shows that developers can profit by building affordable housing almost anywhere.” In contrast, the authors of the Urban Institute’s model essentially say that it’s unprofitable to build any amount of affordable housing without substantial subsidies. They say: “Without the help of too-scarce government subsidies for creating, preserving, and operating affordable apartments, building these homes is often impossible.”  It’s not immediately apparent from looking at the two calculators which of these conclusions is the most accurate.

What’s needed here, is a kind of Consumer’s Guide to housing calculators. It would be useful, for example, if we had a standardized “benchmark” development: a certain number of units, and certain land cost, rent level and other parameters, than could be plugged into each model, and then we could see what kind of outputs each model produced for the same development.

The best that can be said at this point is that while the calculators we have don’t definitively answer the question, they do a good job of framing the variables that we need to pay attention to in discussing affordability. They’re also helpful in exploring the tradeoffs between policy objectives, for example, how increased parking requirements or longer approval processes lower the likelihood that housing projects will move forward. These calculators are in their infancy–two of them are self-described “betas”–and we hope that the people who’ve built them continue to develop and refine them, and research and debate the assumptions on which they’re based.

A change

Last April, I wrote my first ever post for City Observatory, which unfortunately began with a David Foster Wallace quote. But it was up and up from there. Over the last year-plus here, City Observatory has given me an incredible platform to explore urban issues in public, combining intellectual rigor with a variety of subject matter and willingness to embrace heterodoxy that I’m not sure is matched anywhere else.

Fortunately, I will get to keep writing for City Observatory. But after this week, it will be in the capacity of a once-a-month columnist, rather than a full-time Fellow. (And of course, I’ll still be tweeting at @danielkayhertz and writing occasionally at danielkayhertz.com.) Though I’m fascinated by national (and even international) urban issues, I’ve always been a myopic homer at heart, and I have taken an opportunity to work on policy in my hometown of Chicago at the Center for Tax and Budget Accountability.

I’m incredibly proud of the work we’ve done at City Observatory, and very grateful to Joe Cortright for providing the leadership that made it possible, and giving me the opportunity to be a part of it. In the less than two years since its founding, City Observatory has become a staple of the urban policy conversation, getting nominated as one of Planetizen’s top websites (“every single post is required reading”), and routinely showing up in mainstream news stories about important urban issues, both in local media and top-flight national outlets like The Atlantic, Bloomberg, and the Washington Post.

There’s a growing understanding of the ways in which urban policy are at the core of many of America’s greatest challenges, especially issues of economic inequality, opportunity, and climate change. City Observatory plays a crucial role in investigating and explaining both these challenges and possible solutions. I’m excited, both as a contributor and reader, to see how it grows over the next two years and beyond.

Housing can’t be a good investment and affordable

Recently, we made the case that promoting homeownership as an investment strategy is a risky proposition. No financial advisor would recommend going into debt in order to put such a massive part of your savings in any other single financial instrument—and one that, as we learned just a few years ago, carries a great deal of risk.

Even worse, that risk isn’t random: It falls most heavily on low-income, black, and Hispanic buyers, who are given worse mortgage terms, and whose neighborhoods are systematically more likely to see low or even falling home values, with devastating effects on the racial wealth gap.

But let’s put all that aside for a moment. What if housing were a low-risk, can’t-miss bet for growing your personal wealth? What would that world look like?

Well, in order for your home to offer you a real profit, its price would need to increase faster than the rate of inflation. Let’s pick something decent, but not too crazy—say, annual increases of 2.5 percent, taking inflation into account. So if you bought a home for $200,000 and sold it ten years later, you’d be looking at a healthy profit of just over $56,000.

Sound good? Well, what if I told you that such a city existed? What if I told you it was in a beautiful natural setting, with hills and views of the ocean? And a booming economy? And lots of organic produce?

Credit: Olivier ROUX, Flickr


Maybe you’ve guessed by now: The wonderland of ever-increasing housing prices is San Francisco. When researcher Eric Fischer went back to construct a database of rental prices there, he found that rents had been growing by about 2.5 percent, net of inflation, for about 60 years. And this Zillow data suggests that San Francisco owner-occupied home prices have been growing by just over 2.5 percent since 1980 as well.

Like I said, over ten years, that gives you a profit of just over 25 percent. But compound interest is an amazing thing, and the longer this consistent wealth-building goes on, the more out of hand housing prices get. In 1980, Zillow’s home price index for San Francisco home prices was about $310,000 (in 2015 dollars). By 2015, after 35 years of averaging 2.5 percent growth, home prices were over $750,000.

Screen Shot 2016-07-19 at 9.46.59 PM


Now, if all you cared about were wealth building, this would be fantastic news. The system works! (Although actually even this rosy scenario is missing some wrinkles: San Francisco real estate prices did suffer enormously, if briefly, during the late-2000s crash, and if you bought in the mid-2000s and had to sell in, say, 2010, you would have taken a massive loss.)

But this sort of wealth building is predicated on a never-ending stream of new people who are willing and able to pay current home owners increasingly absurd amounts of money for their homes. It is, in other words, a massive up-front transfer of wealth from younger people to older people, on the implicit promise that when those young people become old, there will be new young people willing to give them even more money. And of course, as prices rise, the only young people able to buy into this ponzi scheme are quite well-to-do themselves. And because we’re not talking about stocks, but homes, “buying into this ponzi scheme” means “able to live in San Francisco.”

In other words, possibly the only thing worse than a world in which homeownership doesn’t work as a wealth-building tool is a world in which it does work as a wealth-building tool.

This also means that the two stated pillars of American housing policy—homeownership as wealth-building and housing affordability—are fundamentally at odds. Mostly, American housing policy resolves this contradiction by quietly deciding that it really doesn’t care that much about affordability after all. While funds for low-income subsidized housing languish, much larger pots of money are set aside for promoting homeownership through subsidies like the mortgage interest deduction and capital gains exemption, most of which goes to upper-middle- or upper-class households.

But even markets with large amounts of affordable housing demonstrate the contradiction. Since at least the second half of the 20th century, the vast majority of actually affordable housing has been created via “filtering”: that is, the falling relative prices of market-rate housing as it ages, or its neighborhood loses social status, often as a result of racial changes. Low-income affordability, where it does exist, is predicated on large portions of the housing market acting as terrible investments.

And to the extent that low-income people do find a subsidized, price-fixed housing unit to live in, that means that they won’t be building any wealth, even as their richer, market-housing-dwelling neighbors do, increasing wealth inequality.

Even the community land trust, which seems to be a way of squaring the wealth-building/affordability circle, ultimately fails. Community land trusts typically provide subsidized or reduced price ownership opportunities to initial buyers, and assure longer term affordability by limiting the resale price of the home. In other words, CLT-financed homes remain affordable only because they restrict how much wealth building the initial owners are allowed to capture. The result is that CLT-financed homes only attract those who couldn’t otherwise purchase a home—which means that the lower-income people in CLTs will be building wealth more slowly than higher-income people in market-rate housing, a fundamentally inequality-increasing situation.

We say we want housing to be cheap and we want home ownership to be a great financial investment. Until we realize that these two objectives are mutually exclusive, we’ll continue to be frustrated by failed and oftentimes counterproductive housing policies.

Homeownership can exacerbate inequality

In yesterday’s post, we described why homeownership is such a risky financial proposition for low income households, who tend to be disproportionately people of color. From a wealth-building standpoint, lower income households tend to buy homes at the wrong time, in the wrong place, face higher financing costs, and have less financial resilience to withstand the fluctuations of housing and economic markets. Yet we continue to persist the the belief that homeownership is a universal elixir for wealth building. In fact, there’s some strong evidence that our excessive investment in housing–and our subsidies for homeownership have worsened our income inequality problems. This suggests it might be time to rethink our national outlook on housing and wealth building.

Has Homeownership Actually Heightened Inequality?

New research from Zillow’s Svenja Gudell shows that the collapse of the housing bubble actually worsened inequality. Modestly priced homes saw the biggest price declines, and the households who owned these homes lacked the equity to cope with the downturn, and were much more likely to be foreclosed upon: “When the bubble popped, less-expensive homes—often bought by low-income homeowners—were more likely to be foreclosed on than higher-end homes.”

In many important respects, the case for home-ownership as wealth creation is a circular argument: We proclaim that housing is a great investment, and encourage families to go heavily into debt to purchase homes, and then use the fact that so much household wealth is tied up in housing to justify additional subsidies and regulations to drive up home values. These regulations include local zoning (which limits the supply of housing, helping drive up prices or as it’s usually expressed “to protect property values”), but go much further. The federal government directly or indirectly provides or guarantees most home mortgages (and prices lower and terms more favorable that would be the case in a purely private market). And the federal tax code provides something on the order of a quarter of a trillion dollars in annual subsidies to homeownership. If homeownership is a good investment, it’s substantially because government policies have made sure that it pays off.

From a distributional standpoint, it’s clear that the emphasis on homeownership has actually led to a greater concentration of wealth, and not greater equality. As Matthew Rognlie showed virtually all of the increase in wealth inequality in the United States in the past four decades is accounted for by the increase in the share of capital in housing. Mian and Sufi plotted the ratio of the amount of home equity owned by the highest income quintile compared to the middle quintile of the US population. In the 1990s, a household in the highest income quintile had about 5 times as much housing equity as the average, middle quintile. By 2010, this difference had nearly doubled: to 9 times as much housing equity.

Particularly over the past decade, housing has a poor record as a wealth creator. Overall, homeowners collectively lost something on the order of $7 trillion in the collapse of the housing bubble. To put that number in some perspective, consider the average home equity of a household in the middle of the income distribution, with a household head aged 35 to 44 years. Data compiled from the Fed’s Survey of Consumer Finance by David Rosnick and Dean Baker shot that while inflation-adjusted home equity for this group grew from 1992 through 2007, since then it has fallen sharply; today the households in the middle quintile of this age group have less than half as much home equity as in 2007.

Screen Shot 2016-07-18 at 5.51.12 PM

Time to Rethink Homeownership?

The collapse of the housing bubble erased all of the growth in the homeonwership rate in the United States since 1980. On the upswing, the bubble generated lots of (paper) wealth, and drew millions of households into ownership. The homeownership rate peaked at more than 69 percent in 2007, then plunged to less than 64 percent, as millions of households lost their homes.

The aftermath of the bubble should remind us that homeownership is a risky endeavor, and that for a substantial portion of the population, it’s not a feasible or prudent strategy for trying to build wealth. It’s time to re-think the role of homeownership in promoting wealth, especially for the poor. There are three big takeaways here:

  1. Pushing homeownership as a universal wealth building strategy for the poor, is a snare and a delusion. Its likely to hurt many families. Policies that lower the bar for home purchases, like very low down payment loans, may actually expose those least able to handle the risks of homeownership to even greater probability of loss.
  2. The efforts to extend homeownership down the economic spectrum in many ways simply constitute a way of providing political cover for subsidies like the mortgage interest deduction that chiefly benefit upper income households, thus actually worsening income inequality.
  3. As a nation, we have no substantial policy for helping renters build wealth. More than a third of our population, including its youngest, poorest, and people of color are, will continue to be renters. We might, for example, consider repurposing some of the $250 billion annually in federal tax subsidies to homeownership to help reduce rental costs or subsidize savings programs for renters.

Homeownership: A failed wealth-creation strategy

It’s an article of faith in some quarters—well, most quarters—that in the United States, owning a home ought to be a surefire way to build wealth. Whether it’s presidents, anti-poverty groups, foundations, or realtors, we’re always being told that that homeownership is the foundation of the American dream, and a key way secure one’s financial future.

For a long time, it certainly worked out that way for a lot of households. Real home prices in the US outstripped inflation by a wide margin. Home equity rose. If you bought a house in the 1960s, pretty much anywhere in the US, it was worth a lot more two or three decades later. Collectively, and after adjusting for inflation, the real value of home equity owned by US households increased from 1 trillion in 1960 to 2 trillion in 1975 to 8 trillion before finally peaking at more than 14 trillion in 2006.


Because of this record, we’re told that promoting more widespread homeownership is an effective way to lift low-income families out of poverty, and to help racial and ethnic minorities—who’ve long had lower than average rates of homeownership, to build wealth.

The implication is that the 40 percent or so of American households that don’t now own homes would be better off, all things equal, if they were able to buy a home. But as the standard investment disclaimer goes, “past performance is no guarantee of future results.” That warning is especially true for low income households and minorities who are now renters.

Why Homeownership is Risky for Low Income Households

Housing can be a good investment if you buy at the right time, buy in the right place, get a fair deal on financing, and aren’t excessively vulnerable to market swings. Unfortunately the market for home-ownership is structured in such a way as to assure that low-income and minority buyers meet none of these conditions. For these Americans, there’s no guarantee that homeownership builds wealth; in fact, tends to be a risky proposition that often produces financial hardship.

First, you have to buy at the right time. The old adage is to buy low and sell high. Jordan Rappaport of the Kansas City Federal Reserve Bank estimates that buying has outperformed renting on a financial basis only about half the time since the 1970s; so those who buy during the  “wrong” half stand to be worse off. And low-income and minority buyers tend to be disproportionately drawn into the market at these “wrong” times.

That’s because the best time to buy, from a wealth-building perspective, is when housing prices are low and growing sluggishly. But generally, such times coincide with limited credit availability: home lenders ration credit according to credit score, and only the “best” borrowers have access to home loans when prices are low.

Credit: Dan Moyle, Flickr


As the experience of the last housing bubble showed, low-income and minority buyers came into the market most strongly as lending standards were relaxed, relatively late in the cycle. Those who bought in 2001 (when the market was depressed) fared very differently that those who bought in 2006 (at the height of the bubble). Easy credit nominally made homes more affordable, but also drew ever more borrowers into the market to bid up the prices of homes until the bubble popped. Because of this inherent quality of the credit cycle, the poorest borrowers are drawn into the market at the worst time to buy—when prices are at their highest.

Second, you have to buy in the right place. Opportunities for home appreciation vary enormously, not only by region of the country, but by neighborhood within metro areas. Ethnic minorities tend to buy in neighborhoods that have lower rates of home price appreciation. Zillow’s Skylar Olsen analyzed the data on home price trends by race and ethnicity. They show that Black and Hispanic households experienced bigger declines in home values as the housing bubble collapsed, and a slower rebound as it recovered, leaving them worse off that the typical white homeowner. And that’s not a result of Black and Hispanic buyers being poor judges of neighborhood quality: In segregated housing markets, the behavior of whites to avoid Black and Hispanic neighborhoods means that it’s much more difficult for those communities to see consistently rising home values.

Zillow_Race_Equity


Third, you have to get a good deal on credit. The evidence is that low income borrowers and ethnic minorities pay, on average, higher interest rates. A 2006 study for HUD found that after controlling for household, property and loan characteristics, black households pay interest rates that are 21 to 42 basis points higher than whites, and hispanics pay rates than are 13 to 15 basis points higher. Federally guaranteed home mortgages must pay fees based on their riskiness, as measured by the mortgage’s loan-to-value ratio and the borrower’s credit score. Because minority buyers tend to have lower down payments and worse credit scores, it’s estimated that they pay guarantee fees that are 50 percent higher on average than white buyers. In addition, we know that low income and minority borrowers were the targets of predatory lenders. If you pay more for your mortgage, that raises the cost and lowers the returns to homeownership.

Finally, in order to build wealth with housing, you have to have the ability to weather economic cycles. Low income and minority families often have limited financial resources beyond the equity in their homes and therefore are poorly positioned to cope with financial setbacks—loss of a job, a major medical expense or home repair—and missing mortgage payments can quickly push them into default. And highly leveraged home buyers (who get 90% or greater mortgages) are vulnerable to lose their entire investment in the face of even a modest decline in home prices. As Atif Mian and Amir Sufi have documented, conventional US mortgage loans are a risky, one-sided bet for borrowers.

As Patrick Bayer, Fernando Ferreira, and Stephen Ross have demonstrated, minority homebuyers are drawn into the market relatively late in the credit cycle, have limited financial resources on which to draw in the event of economic problems and are disproportionately more likely to default on their loans, even after controlling for differences in credit scores, down payments, and neighborhood characteristics. As a result, they conclude:

“Our study raises serious concerns about homeownership as a vehicle for reducing racial wealth disparities. …Homeownership may be especially risky for households with a low initial level of wealth (savings) or fewer family resources on which to draw when hit with an adverse economic shock.“

If you buy at the wrong time, if you buy in the wrong place, if you pay too much for for the money you borrow and don’t have the financial wherewithal to weather economic turbulence, chances are that home ownership could turn out to be a wealth-destroying, not a wealth-building, proposition. It clearly was in the aftermath of the collapse of the housing bubble.

The Week Observed: July 29, 2016

What City Observatory did this week

1. Economist Paul Romer Joins the World Bank.  Paul Romer, a leading exponent of the New Growth Theory has been hired as chief economist for the World Bank. We explore how his thinking about the role of knowledge-driven growth and the key role of cities in fostering institutional and technological innovation might influence the Bank’s strategies. The good news here is that Romer is one of the most plain-spoken economists around, illustrating his theories with play dough and a children’s chemistry set (Really!).

Paul Romer at TED University. TED2011. February 28 - March 4, Long Beach, CA. Credit: James Duncan Davidson / TED
Paul Romer at TED University. TED2011. February 28 – March 4, Long Beach, CA. Credit: James Duncan Davidson / TED

2. Housing Cost Calculators. There’s a growing array of web-based tools that let you dig into the cost components of housing construction and development to better understand why the rent is, as they say, “so damn high.” We review four different housing cost calculators, including the latest entry from the Urban Institute, plus models from UC Berkeley’s Terner Center and the Cornerstone Partnership. Our verdict: while the models are useful at illustrating some of the key variables and tradeoffs in the development process, there’s a huge amount of complexity here, and many critical assumptions built into the models are not readily apparent, especially for casual users.

3.  The Party Platforms on Housing. Housing and housing affordability are top of mind for local governments, but where do they show up in the national political agenda.  We take a close look at what the Republican and Democratic party platforms have to say about housing.  The parties both express support for homeownership, but seemingly part company on zoning.  The Republican platform lambastes the Affirmatively Furthering Fair Housing Rule as “social engineering” (an epithet which could easily be applied to most zoning).  The Democratic platform makes a vague call for easing local barriers to building affordable rental housing.

4. The Triumph of the City and the Twilight of the Nerdistans.  The big news in San Francisco this week is that Facebook is exploring a major expansion in the city.  The center of gravity of the Bay Area’s tech sector is decidedly shifting north, propelled by the desire of tech workers to live in great urban neighborhoods–and the fierce competition by tech firms to hire these workers. The wave of corporate expansions in downtown areas, and the growing flow of venture capital to startups in city centers signals the ebbing of the suburban nerdistan model of development.


The week’s must reads

1.  After a century is zoning obsolete? This past week marked the 100th anniversary of zoning in the US, dated from the adoption of New York City’s first zoning code. At BloombergView, Justin Fox notes that, as it has been applied, particularly since the 1970s, zoning has been implicated as a contributor to segregation, inequality and housing unaffordability.  He looks back at the historical roots of zoning, unearths some of the archaic views on which it is based, and concludes that if its not time to kill zoning altogether, then a radical overhaul is probably in order.

2.  Cities Alive: Towards a walking world.  London-based ARUP architects have produced a colorful, encyclopedic guide that builds a strong case for promoting more walkable cities, along with case studies of 80 successful projects. This compendium draws from the work of Jan Gehl, Janette Sadik-Khan, Jeff Speck and others, to explain why walking is beneficial to health, communities and the economy, and to demonstrate the practical steps toward promoting walking. That said, the report is primarily about tactics and projects; it only briefly touches on how we might make strategic changes to the policies and institutions that lead to auto-dominated urban landscapes.  While there’s copious detail on parklets, there’s only passing mention of pricing and economic incentives, and no reference to eliminating or reducing parking requirements.

3. More evidence for Portland’s Green Dividend.  At BikePortland, Michael Andersen shows that per capita car ownership in Portland has declined, taking nearly 40,000 cars off the roads, compared to the rate of vehicle ownership in 2007.  He estimates that less driving is saving Portland residents $138 million annually in vehicle operating costs, money that mostly gets re-spent in the local economy.


New knowledge


1. The Outlook for the Homeownership Rate. In the aftermath of the collapse of the housing bubble, homeownership has fallen to rates not seen in decades. The University of Pennsylvania’s Susan Wachter and Arthur Acelin conclude that a combination of demographics and economics likely may continue to depress homeownership rates going forward. Homeownership is down most for young adults, who will represent a growing share of the population over the next two decades.  The report also points to tougher lending standards as a brake on homeownership.

2.  The impact of Seattle’s minimum wage on earnings, employment and business activity. A team at the University of Washington, led by economist Jake Vigdor, has been using employment tax records to track the impacts of the City of Seattle’s minimum wage, which rose to $11 per hour for many employers. They find that since the wage increased, hourly earnings for low wage workers are up by more than $1 per hour, but much of the effect is attributable to the strong local economy, rather than the wage law. There’s been a small reduction in hours worked: the employment rate for low wage workers in Seattle declined about 1 percent.  Despite fewer hours of work, average worker earnings are up. The study finds no net impact on business success: the failure or exit rate of businesses hasn’t changed appreciably, and the closure of local businesses has been more than offset by new business starts.

3.  Has the Great Recession depressed the rate of productivity growth? A new paper from the National Bureau of Economic Research shows that in the face of weak demand, businesses have limited incentives to incur the up-front costs associated with developing R&D, and deploying new ideas and technology. The result is that the state of the macro-economy lowers the rate of productivity growth and decreases the total capacity of the economy–something economists call an “endogenous” effect, which is a key reason why recovery from financial crises is so slow.


The Week Observed is City Observatory’s weekly newsletter. Every Friday, we give you a quick review of the most important articles, blog posts, and scholarly research on American cities.

Our goal is to help you keep up with—and participate in—the ongoing debate about how to create prosperous, equitable, and livable cities, without having to wade through the hundreds of thousands of words produced on the subject every week by yourself.

If you have ideas for making The Week Observed better, we’d love to hear them! Let us know at jcortright@cityobservatory.org or on Twitter at @cityobs.

The Week Observed: July 22, 2016

What City Observatory did this week

1. Homeownership:  A failed wealth creation strategy.  Its an article of faith that owning a home is the most reliable route to wealth building in the US.  But this hasn’t been true over the past decade, and its especially problematic for low income households and minorities. The housing market is structured so that they buy at the wrong time, in the wrong place, pay a higher price and face far greater risk.

2. Homeownership can worsen inequality.  Policies that promote homeownership have worked far better for the wealthy than the poor, with the result that wealth inequality related to housing has actually grown in the past decade.  Low income households experienced greater value declines and more frequent foreclosures; higher income households continue to experience gains in home equity, with the result that the top twenty percent of households had, on average 9 times as much home equity as the typical household in 2010, up from a five-fold difference in 1990.

3.  Housing can’t be a good investment and affordable.  There’s a fundamental contradiction between the two pillars of US housing policy. In order to be a good investment, it has to increase steadily in value over time.  But rising home values are synonymous with diminished affordability. Until we confront this contradiction squarely, we’ll have real difficulty making progress on either front.

4.  Changes.  We bid adieu and bon chance to our colleague Daniel Hertz, who’s taken a new position with a public policy think tank in Chicago. His thoughtful analysis and clear voice have defined City Observatory, and we’re delighted that he’s agreed to continue to provide monthly contributions. Thanks, Daniel!


The week’s must reads

1. Car-sharing reduces traffic.  Susan Shaheen and her research team at the University of California Berkeley used fleet data and surveys of users of Daimler’s Car2Go car-sharing service.  They estimate that each additional vehicle in the ride-sharing fleet leads to 9 to 11 fewer cars on the road, and greenhouse gas emissions per user decline substantially. Users report selling existing cars, or avoiding buying cars, and can utilize car-sharing on an as-needed basis to supplement transit, biking and walking. This is strong evidence that “transportation as a service” will be more efficient than our current model of having each household own one or more cars.

2. Making the buses run on time in NYC.  For the past several years, bus ridership in New York City has been dwindling, even as subways have become increasingly crowded.  The Transit Center released a detailed report–“Turnaround: making recommendations on how to get buses moving faster, including re-designing and straightening routes, electronic payment, all-door boarding, and dedicated lanes. It’s a list of ideas that could be applied in nearly all cities. Conspicuous by its absence is one other idea: charging private vehicles using the public roadway in peak hours to reduce traffic and speed buses.

3. Demographic Headwinds for Job & Housing Growth?  A new report from John Burns Real Estate, a consultancy, predicts much slower job growth in the years ahead, due to lower growth in the working age (20-64) population. They forecast that this group, which grew 1.0 to 1.5 percent per year in the past decade, will grow at less than 0.5 percent annually through 2024. The result:  labor shortages and likely subdued demand for housing. Some provocative data here.


New knowledge

1. Segregation and the Financial Crisis.  NYU’s Furman Institute has posted another one of its series of well-structured discussions of key urban policy topics. This one explores an essay by Jacob Faber which suggests that the size of the housing market collapse was shaped heavily by segregation.  In reply, Steve Ross acknowledges the key role of segregation in shaping housing market outcomes, but argues the decline was much more broad based.

2. Public Support for Road Finance Alternatives.  Everyone, it seems, wants more and better roads, but no one actually wants to pay for them is the short summary of Indiana University’s Denvil Duncan’s paper exploring survey evidence on support for road finance alternatives.  Of five considered options, none gets majority support; higher gas taxes (favored by 29%) or tolls (34%) are the least unpopular.  Raising the income tax is the least favored. The title of this paper “Searching for a Tolerable Tax,” gives away the game; the full paper is available (paywall) from the Public Finance Review.

3. How Housing Market Fluctuations Affect Young Households.  In hot housing markets, high prices keep younger households in the rental market, and also seem to lead to lower rates of marriage and child-bearing, according to research from economists Luc Laeven and Alexander Popov. They look at across market variations in home prices in the US, and conclude that housing booms tend to disadvantage young households, while benefiting older homeowning households.


The Week Observed is City Observatory’s weekly newsletter. Every Friday, we give you a quick review of the most important articles, blog posts, and scholarly research on American cities.

Our goal is to help you keep up with—and participate in—the ongoing debate about how to create prosperous, equitable, and livable cities, without having to wade through the hundreds of thousands of words produced on the subject every week by yourself.

If you have ideas for making The Week Observed better, we’d love to hear them! Let us know at jcortright@cityobservatory.org, dkhertz@cityobservatory.org, or on Twitter at @cityobs.

The Week Observed: July 15, 2016

What City Observatory did this week

1. How safe will the autonomous cars of the future be? The first-ever fatal collision involving a Tesla running on autopilot mode has prompted a debate on that subject. On the one hand, hand-wringing over an uncertain threat may seem somewhat out of place given the normalization of the over 30,000 real people who die on the roads every year in America. On the other, assurances that self-driving cars will surely be a massive improvement are so far still just theoretical: Until this new technology has logged far more miles, on far more types of roadways—and especially urban streets with lots of intersections, crosswalks, jaywalking, and potential obstacles—we shouldn’t take for granted that it offers a solution to the problem of road safety.

2. The elevator pitch for “value capture” makes a lot of sense: Public transit creates value, so why shouldn’t some of that value be funneled back into transit agencies to pay for expansion and maintenance? But as Chicago has landed on the verge of creating one of the largest value capture programs in US history, there are also reasons for pause. Politically, value capture is more fragile than funding campaigns that require building a coalition explicitly in favor of using tax revenue for funding, like LA’s Measure R; logistically, value capture seems to benefit capital construction more than ongoing operations, which in many cases are the more crucial aspect for valuable transit service.

3. What is the future of urban transportation? For many, especially those in the tech community, the answer is autonomous vehicles. But one such advocate wrote in the Wall Street Journal that autonomous vehicles won’t operate at their peak efficiency without serious public policy concessions, including designating certain streets off-limits to all other types of vehicles. This inadvertently reveals what much discussion of the inevitability of self-driving cars elides, which is that public regulation fundamentally shapes evolution and adoption of technology as well as the choices that private individuals make about their transportation. We should not be suckered into the idea that an optimal future transportation system will simply emerge from the private marketplace.

4. In Westchester County, just north of New York City, the results of a seven-year of litigation over fair housing are getting mixed reviews from activists. The Justice Department accused local governments of using various policies, including low-density single-family zoning, to promote racial segregation, but the county government has been openly critical of the case and resistant to some of its recommendations. Evaluating this legal strategy versus state-based legislative tactics—like Oregon requiring minimum amounts of multi-family housing zoning, or Massachusetts allowing developers to sue to overturn low-density zoning in particularly unaffordable municipalities—is important for the future of anti-segregation work.


The week’s must reads

1. In the New Yorker, Kelefa Sanneh reviews a new book about “ghetto” segregation as a lens on current debates about gentrification. Connecting the long history of segregation in America to the relatively shorter history of integration as “gentrification” complicates a lot of the questions about what kind of demographics would hold in a “just” neighborhood. Sanneh also refers to some of the academic literature by writers like Lance Freeman who find that residents of gentrifying neighborhoods often have more conflicted feelings about the process than sometimes assumed. One of the main effects of gentrification, Sanneh concludes, may be that by bring different groups in into closer contact, gentrification makes it harder to ignore inequalities that have been around for a long time.

2. What happens to neighborhoods with housing built for families as their residents age? That’s a challenge investigated by South Carolina’s The Herald, which notes that the proportion of suburban residents 65 and older has doubled since 1950. The problems are numerous, including housing stock dominated by multi-story single-family homes difficult or expensive to retrofit for people with difficulty climbing stairs, and bad public transit access that means limited mobility for people who can’t drive.

3. Interpreting ongoing academic research for a non-academic audience poses serious challenges. In a Twitter essay, FiveThirtyEight’s Ben Casselman reflects on some of those challenges—and on potential best practices—in the wake of an article in the New York Times that highlighted a working paper on police shootings that some argued was less definitive than the Times’ reporting suggested. One takeaway: To the extent possible, it’s better to summarize the entire body of literature on a subject than to present a single paper without that context.


New knowledge

1. The Center on Budget and Policy Priorities has released a new “Chart Book” on the effects of rental assistance programs. The treasure trove of data includes who gets rental assistance (mostly adults with children and the elderly), their effect on homelessness (assistance reduces it), food insecurity (also reduced), and even domestic violence (also reduced). It also shows that when families use rental assistance to live in low-poverty neighborhoods, the benefits are even greater.

2. A new study by Neil Metz and Mariya Burdina of the University of Central Oklahoma suggests that increasing income inequality between adjacent neighborhoods is associated with higher rates of property crime. Importantly, however, increasing levels of income inequality within a neighborhood do not predict higher rates of property crime. At least at first glance, this is evidence thatspatial inequality—that is, income segregation—is associated with greater crime levels.

3. The Transit Center has released a new edition of transit rider surveys. Among the findings: nearly three-quarters of regular transit users walk to their stations, and even occasional riders (once a month) walk more often than they drive. Another interesting finding: Despite the emphasis on transit as a commuting tool, The Transit Center finds that most riders fall into one of two buckets: “Occasional” users who generally don’t use transit to get to work, or “All-purpose” users who commute by transit because they use transit for all sorts of trips. Those who use it mainly for regular commutes make up a relatively small proportion of those who use transit in cities around the country.


The Week Observed is City Observatory’s weekly newsletter. Every Friday, we give you a quick review of the most important articles, blog posts, and scholarly research on American cities.

Our goal is to help you keep up with—and participate in—the ongoing debate about how to create prosperous, equitable, and livable cities, without having to wade through the hundreds of thousands of words produced on the subject every week by yourself.

If you have ideas for making The Week Observed better, we’d love to hear them! Let us know at jcortright@cityobservatory.org, dkhertz@cityobservatory.org, or on Twitter at @cityobs.

Lessons of Westchester

Westchester County, the mostly wealthy suburbs just north of New York City, is at the epicenter of one of the nation’s leading court battles over housing segregation.

Last week, the New York Times reported that seven years since the Justice Department accused many of the county’s municipalities of using exclusionary zoning laws and other policies to encourage segregation, the progress made is less than many advocates had hoped for.

A commercial district in Scarsdale, Westchester County, NY. Credit: June Marie, Flickr


Racial segregation in Westchester County, as in the New York metropolitan area in general, remains extreme. In a report submitted to the court system, CUNY professor Andrew Beveridge wrote that the “dissimilarity index” between whites and blacks, which represents the percentage of people who would have to move to have perfect integration, is 73. While the county as a whole has a fairly diverse population, less than five percent of Census tracts in the county have both black and white populations that are representative of the overall population of the county.

Moreover, the towns in Westchester County with extremely low black populations are also towns with extremely restrictive zoning laws. Of the 25 municipalities whose black populations are under three percent (versus 16 percent countywide), 21 ban apartments on at least 95 percent of their residential land—and 11 mandate single-family homes on at least 99 percent of their residential land.

And even when they allow multi-family buildings, these towns use zoning as a tool of segregation. Of these 25 towns, professor Beveridge found that 23 had black populations heavily concentrated in small areas where apartments were allowed, separate from the more common, white-dominated, single-family home zones.

Of course, zoning on its own can’t solve the problem. But as Beveridge argues, it’s hard to see how Westchester County could meaningfully allow more racial and economic integration without addressing zoning. That’s both because market-rate multifamily housing tends to be much more affordable than single-family housing built at the same time, and below-market housing in places with high land costs is only financially feasible to build as multi-family housing. Fixing exclusionary planning laws, then, may not be sufficient, but it is necessary.

But most of these municipalities, along with Westchester County executive Robert Astorino, have been defiant. Though they claim they are on pace to create the required 750 below-market housing units (out of more than 340,000 units across the county), fair housing advocates say that many of those are themselves segregated from higher-income neighborhoods.

These results are disappointing, given that the Westchester case may be among the most high-profile legal interventions against segregated housing since an earlier generation of litigation that included the Mount Laurel case in New Jersey. One lesson, perhaps, is that if segregated white and affluent local governments have the tools to enact exclusionary housing policies, they will generally use them—and find other ways to resist court mandates.

Rather, anti-segregation advocates may need to find ways to legislatively curtail the power of exclusionary communities. As we’ve argued before, this is most likely to happen at the state level, because state officials have to answer both to highly privileged, exclusionary communities as well as their less-privileged constituents who may want access to those communities. And in fact, places where states have more power in development policy are less segregated than those with more local power.

These approaches might include measures that disallow regulatory barriers to new housing that don’t serve an important social or environmental safeguard, as with California Governor Jerry Brown’s recent proposals; or they may directly mandate that all municipalities allow a minimum amount of multifamily housing, as in Oregon; or they may allow the state to override local zoning in places with severe affordability issues, as in Massachusetts. But Westchester County—as with the rest of New York state, and the country as a whole—has much farther to come in breaking down public policies that produce and perpetuate segregation.

Rules of the road

Earlier, we wrote about the first fatal crash of a partly-self-driving car. A Tesla, operating on autopilot mode, failed to detect a semi-trailer crossing in its path, and the resulting collision killed its human driver.

The crash has provoked a great deal of discussion in the media about safety data, the potential for future technology, and the problems of human-interaction with partially automated systems. A key challenge is that current (and at least foreseeable) implementations of self-driving technology are likely to require human supervision and intervention, and the man-machine combination likely poses its own risks. The seeming inerrancy of the machine systems in route circumstances may lull humans into a sense of complacency or inattention, with disastrous consequences when the machine fails. (Indeed, according to at least one account the victim of the Florida crash was watching a Harry Potter video at the time of the crash).

A parked Tesla. Credit: AJ Batac, Flickr
Tesla (price $101,500) Parking Space (Free!) . Credit: AJ Batac, Flickr


While we may instinctively regard the safety issues surrounding autonomous vehicles as being primarily technological in nature, they also depend critically on institutional arrangements we establish and the policy choices we make about transportation and public space.  Safety will be determined as much by rules of the road as by any safety device.

To many achieving safety will come in the form of fully automated vehicles that would eliminate any human role in the driving process. Not only are such vehicles still years—if not decades—away, but then there’s the challenge navigating a transitional period in which self-driving vehicles share the road populated mostly with human-piloted vehicles.

To avoid these problems altogether, Jerry Kaplan writing in the Wall Street Journal, has suggested that self-driving vehicles be given their own infrastructure. Lanes on highways would be reserved for self-driving vehicles.

Taking the initiative in this way would better foster innovation and let the free market work its magic. What might such a plan look like? Perhaps we could start by reserving high-occupancy-vehicle lanes or certain roads at specific times for automated vehicles.

It’s breathtaking that neither the Kaplan—nor apparently his editors at the Wall Street Journal—grasped the glaring contradiction between “free market” and “government prohibiting non-automated vehicles from using roads.”

There’s no such thing as a free market for transportation: transportation hinges directly on public policy, particularly spending on roads and the rules that govern their use. A technologically advanced car is essentially useless without a network of public roads on which it can operate. The (largely) private market for vehicles depends directly on a public policy of building roads and regulating them in ways favorable to vehicle travel.

How we get from today’s technology to tomorrow’s, whatever form it takes, will be very much about public policy choices. That’s the way its always been.  It’s worth spending a moment thinking back about this process. In the early days of the automobile, the rules of the road were quite different. There were no traffic signals, and wagons, streetcars, and pedestrians freely mixed on city streets. In the earliest days, some cities required cars be preceded by a flag-bearer to warn other travelers of its approach.

A key victory of what Vancouver’s Gordon Price calls “motordom” came in literally re-writing the rules of the road. By law and custom, other users were marginalized or completely excluded from the roadway. Pedestrians not crossing at marketed crosswalks were branded “jay-walkers”—a derisive and entirely manufactured term, designed to shame what had long been common behavior on city streets.

There’s no such thing as a free market for roads

While it’s cloaked in the rhetoric of markets, Kaplan’s call to dedicate a portion of the public right of way exclusively to autonomous vehicles is really the latest incarnation of Asphalt Socialism: We ought to give massive public subsidies to private vehicle movement, privilege these cars over other forms of transportation, and generally subordinate the quality of place to the movement of vehicles.

It may make sense for fully automated vehicles to have their own right of way: but if they do, they ought to pay for the privilege. The root of many of our transportation and urban problems is the consistent under-pricing, and consequent massive subsidies to private vehicle transportation. Our decision to subsidize freeway construction in cities—ostensibly to speed travel—has chiefly led to much more sprawling development patterns. Its an open question whether fleets of cheap, comfortable authonomous vehicles would lead people to choose to commute longer distances from even more far-flung locations.  Subsidized infrastructure for automated vehicles would recapitulate this mistakes of the past with a whole new set of technologies.

Likewise, the advent of driverless vehicles raises important issues about the legal liability for damages when car crashes occur.  Will driverless vehicle manufacturers or software providers or map makers be subject to legal recourse under product liability laws?  At least one study has suggested a fairly sweeping legal framework that would shift liability to vehicle owners.  How the legal architecture of liability is re-written will likely have a profound impact on the deployment of this technology.

The advent of highly instrumented vehicles should instead be treated as an opportunity to revisit archaic and failed choices about how we regulate, price and pay for roads. If vehicles had to pay for the cost of the public roads on which they travel (and the public street space that is routinely used for free car storage), drivers would make very different decisions about when, where and how much to travel.  Realizing the safety and other benefits that can potentially come from self-driving vehicles will be just as much a matter of working out the right public policies as it is tackling the technological challenges.

Less than perfect

Last week, sadly, two tragic deaths represented unfortunate, but predictable firsts in transportation. They are also reminders that despite the very real potential benefits of new technology, operating large metal objects at high speeds is an inherently dangerous activity, and public safety is best served by reducing people’s exposure to the risk—which means designing urban spaces to minimize necessary driving and keep most vehicular traffic traveling at low speeds.

On May 7, Joshua Brown had his Tesla sedan operating in auto-pilot mode crash into a semi truck that turned across his path on a four-lane Florida highway. Neither driver nor operator reacted to the truck, the car’s self-driving mechanism apparently fooled by the low contrast between the truck and a bright sky, or its own programming that led it to disregard large metal rectangles as highway signs. As Tesla put it: Neither Autopilot nor the driver noticed the white side of the tractor trailer against a brightly lit sky, so the brake was not applied.” (The passive voice here suggests autonomous vehicles are well on their way to developing the key driving skill of minimizing responsibility when crashes occur).

A Tesla. Credit: Lummi Photography, Flickr


Then on July 1, bike sharing recorded its first fatality. In Chicago, 25-year old Virginia Murray riding a Divvy bike was struck by a flat-bed truck as they both turned right from Sacramento on Belmont in the city’s Northwest side.

Until these crashes, both technologies had enviable safety records. But as they become more widely used, it was a statistical certainty that both would fail. What lessons can we draw from these tragedies?

Gizmodo hastened to point out that the Tesla, while using its lane-keeping, object-detection and speed-maintaining functions, was not truly a fully autonomous vehicle. (Tesla’s system requires the driver to keep his or her hands on the wheel, or the car starts slowing down). Arguably, the Tesla’s systems don’t have all of the functionality or redundancy that might be built into such vehicles in the future. To Gizmodo, the Tesla crash is just a strong argument for fully autonomous vehicles—humans can neither be counted upon to intervene correctly at critical moments, and in theory, vehicle-to-vehicle communication between the Tesla and truck could have avoided the incident entirely.

In its press release on the crash, Tesla pointed out that its vehicles, collectively, now have recorded one fatality in 130 million miles of auto-piloted driving, which compares favorably with a US average fatality rate of one fatality per 94 million miles driven.

In a subsequent tweet-exchange in response press coverage of the Florida crash, Tesla CEO used that disparity to claim that if all cars worldwide were equipped with the auto-pilot function it would save half a million lives per year. Elon Musk upbraided a Fortune reporter, insisting he “take 5 mins and do the bloody math before you write an article that misleads the public.”

But the math on safety statistics hardly supports Musk’s view, for a variety of reasons, as pointed out in Technology Review. So far, the sample size is very small: until Tesla has racked up several tens of billions of miles of driving, it will be hard to say with any validity whether its actual fatality rate is higher or lower than one in 94 million. Second, it’s pretty clear that current Tesla owners only use the autopilot function in selected, and largely non-random driving situations, i.e. travelling on freeways and highways. Limited access freeways, like Interstates, are far safer than the average road; in 2007, the crash rate on Interstates was one fatality per 143 million miles driven (100 million divided by .70). The most deadly roads are collectors and local streets, where auto-pilot is less likely to be used.

Fatality Rates Per Million Miles Traveled, 2007

Screen Shot 2016-07-11 at 8.37.58 AM

Statistically, it’s far too early to make any reasonable comparisons between this emerging technology and human drivers. But our experience with managing risk and safety with other technologies suggest that the problem will be daunting. As Maggie Koerth-Baker pointed out at FiveThirtyEight, the complexity of driving and of coping with every possible source of risk—and selecting the safest action—is mind-boggling. Plus, computers may not make the same mistakes as humans, but that doesn’t mean that they won’t sometimes act in ways that lead to crashes.

Part of the problem is that the very presence of safety systems may lull drivers into a false sense of security. Crashes, especially serious ones, are low-probability events. Humans may be very leery about trusting a machine to drive a car the first few times they use it, but after hundreds or thousands of repetitions, they’ll gradually believe the car to be infallible. (This logic underlies the Gizmodo argument in favor of full autonomy, or nothing).

This very process of believing in the efficacy the safety system can itself lead to catastrophes. Maggie Koerth-Baker describes the meltdown of the Three Mile Island nuclear reactor. It had highly automated safety systems, including ones designed to deal with just the abnormalities that triggered its accident. But they interacted in unanticipated ways, and operators, trusting the system, refused to believe that it was failing.

While some kinds of technology—like vehicle-to-vehicle communication—might work well in avoiding highway crashes, there’s still a real question of whether autonomous vehicles can work well in an environment with pedestrians and cyclists—exactly the kind of complex interactions with un-instrumented vulnerable users that resulted in Virginia Murray’s death in Chicago.

Increasingly, safety problems affect these vulnerable users. Streetsblog reported that the latest NHTSA statistics show that driver deaths are up six percent in the past year, pedestrian deaths are up 10 percent and cyclist deaths are up 13 percent, reversing a long trend of fewer deaths, and making 2015 the deadliest year on the road since 2008.

For the time being, it’s at best speculative to suggest that all of these deaths can be avoided simply by the greater adoption of technology. And as many observers have noted, today’s technology, while impressive and developing quickly, is far from achieving the vision of full vehicle autonomy; some robotics experts predict self-driving cars may be 30 years away. With present technology, as we’ve noted more driving means more deaths. The most reliable way to reduce crash-related deaths is to build environments where people don’t have to drive so much, and where cyclists and pedestrians aren’t constantly exposed to larger, fast moving and potentially lethal vehicles even when making the shortest trips. That’s something we can actually do with the technology that exists today.

The Week Observed: July 8, 2016

The Week Observed recently celebrated its first birthday! At the end of June 2015, we sent our first roundup of the most important urbanist news to about 700 people; since then, we’ve faithfully published a new issue every Friday, and we’re proud that today’s message will reach over 1,600 subscribers in every part of the country and beyond, from City Hall planners to university researchers to neighborhood organizers.

Whether you’ve been with us since the beginning or just signed up this week, thanks for being a part of this community!


What City Observatory did this week

1. Each year, Harvard’s Joint Center on Housing Studies publishes a huge “State of the Nation’s Housing” report. Some of it ought not to be a surprise, especially if you’ve been reading City Observatory: Rents continue to outpace incomes, thanks in part to a zoning-induced shortage in many parts of the country; single-family home production is up, but remains far, far below its pre-recession peak, and the occasional reports about the return of “McMansions” are really a statistical glitch: Large new single-family home construction is drastically below its 2006 peak, but moderate-sized single-family home construction is doing even worse. But JCHS’s report is odd in how it manages to compartmentalize housing-related spending: It laments that federal housing subsidies are “dwindling,” but the truth is that total outlays have climbed by tens of billions of dollars—in the form of money given to mostly wealthy homeowners. If we’re going to be serious about finding funds for the kinds of subsidies that will tackle affordability problems, we can’t just ignore that spending.

2. Ask a random person on the street why public transit is good, and they’ll probably be able to name at least three things: It’s environmentally friendly; it’s a cheap option for the poor; and new transit might provide a boost to economic development. But Uber Pool appears to be encroaching on all of those points: Theoretically, electric, autonomous carpool vehicles could emit fewer emissions per passenger; a new Uber pilot in Boston would give monthly passes for less money per ride than public transit; and Uber has sold itself to more than one city on the grounds that it provides a big economic boost. So is there any reason left to use transit? Yes: space efficiency. Even packed carpool vehicles will take up drastically more space per person than trains or buses, making travel impractical or impossible in many dense, walkable areas. This advantage of transit needs to become a part of the broad debate as services like Uber Pool become more common.

3. Blogs like Copenhagenize have helped transform many American cities’ attitudes towards biking in the last decade. What would it mean to make a similar transformation with respect to the workhorse of urban transit: city buses? In this post, we call for American cities to Londonize: commit to common-sense, comprehensive, and mostly low-cost policies that make getting around without a car convenient and reliable. Some of the pillars of London’s excellent bus service, which serves more people than the famous Tube, and nearly half as much as every bus service in the United States put together: Frequent service (no more than 12 minute gaps); simple routes and wayfinding; and prioritizing speed with bus lanes and all-door boarding.


The week’s must reads

1. When we suggested that housing vouchers could be made universal to those whose income qualifies, just like food stamps, we were hardly the first to make such a proposal. Now, Jake Blumgart at Slate has picked up the argument, drawing on data on evictions and the broader problem of housing affordability to make the case that housing vouchers—which currently reach just 17 percent of low-income households—ought to be for everyone. Blumgart also gets into some of the weeds of implementation, like the small-area Fair Market Rent pilot that attempts to make vouchers usable even in high-cost neighborhoods.

2. The US Department of Transportation is planning to overhaul the way it measures traffic congestion—a shift with big implications for the evaluation of future transportation projects. We’ve written that the measures fail on several fronts: Measuring travel by vehicle, not by people, and not taking into account the length of trips in addition to travel speed. Now Transportation for America, which has its own critical take on the proposed rules, is asking people to contact USDOT to comment on its shortfalls, and holding a seminar on the 13th to discuss what a better congestion measure might look like. If you’re interested in better transportation policy for your city, this is a cause you should be concerned with.

3. Many urbanists are highly concerned about road safety. At The Transportist,David Levinson argues that police violence at traffic stops ought to be included in that category. In the wake of another police shooting of a black man during a traffic stop for a broken tail light, Levinson points out that fear of this sort of arbitrary violence during traffic enforcement is a serious issue, especially for people of color, and should be taken into account when urbanists think about how to enforce traffic safety laws. (Similarly, for urbanist advocates of food trucks, street vending, and quasi-legal entrepreneurship like Airbnb and Uber, Emily Badger points out that two high-profile victims of police violence were initially stopped for illegal street vending.)


New knowledge

1. America is aging—but not in the same way all over the country. Governing has put together a report on the shrinkage of the prime working-age population by county, highlighting where demographics are squeezing an important source of economic vitality and tax fiscal health for many cities.

2. The materials that make up a city’s built environment contribute significantly to a neighborhood’s character. Now, Kate Rabinowitz has made a map that shows the building materials of every building in Washington, DC. (Hat tip to Greater Greater Washington.) In this city, the overwhelming majority of buildings are made of brick—but you can see little pockets of other materials, mostly on the outskirts.

3. At The Transport Politic, Yonah Freemark has another entry into the ongoing conversation about whether, and how, population growth is changing in urban areas. He has two main contributions: the first is to show how populations have changed within the footprint of built-up areas in 1960. That reveals that many “fast-growing” cities have grown almost exclusively thanks to annexations and outward growth, rather than infill, with 1960-era neighborhoods losing population. The other is to measure population change both in a broad core—three miles from City Hall, the same measure we’ve used—as well as in a smaller core, 1.5 miles from City Hall.


The Week Observed is City Observatory’s weekly newsletter. Every Friday, we give you a quick review of the most important articles, blog posts, and scholarly research on American cities.

Our goal is to help you keep up with—and participate in—the ongoing debate about how to create prosperous, equitable, and livable cities, without having to wade through the hundreds of thousands of words produced on the subject every week by yourself.

If you have ideas for making The Week Observed better, we’d love to hear them! Let us know at jcortright@cityobservatory.org, dkhertz@cityobservatory.org, or on Twitter at @cityobs.

The values of value capture

Late last month, the Illinois General Assembly passed legislation allowing what may become one of the largest transit value capture measures in the US.

“Value capture” is a transit funding mechanism based on the idea that public transit creates broad social benefits—from more housing demand to swifter commerce in newly accessible shopping districts—and ought to be able to monetize some of those benefits to cover a portion of its construction and operation costs. It takes various forms, from special taxing districts to the direct ownership, development, and selling of transit-adjacent land by transit agencies.

In the case of Illinois, the new law authorizes the city of Chicago and a few inner-ring suburbs to create “tax increment financing” (or “TIF”) districts around four prospective transit projects, including the reconstruction of two heavy rail lines, a rail extension, and improvements to a major commuter rail hub. Essentially, regular property tax revenue within these districts would be capped at current levels, and if property values grow above those levels, the extra revenue would be directed into special funds for these transit projects. Because the projects pass through many neighborhoods where residential and commercial demand has been growing very rapidly, and would last for up to 35 years, they may end up contributing hundreds of millions of dollars, if not more, to these funds.

The old Wilson Red Line station on the North Side. Credit: Zolk, Flickr


In the context of a chronically underfunded system that, like many around the country, has a long maintenance backlog and hasn’t had a major expansion for a generation, these funds are a lifeline. But there are also some tradeoffs to consider.

For one, at a conceptual level, the link between increased property values along these lines and the transit services themselves is murky. As with most value capture in the United States, the additional revenue won’t be based on some sophisticated econometric model meant to capture exactly how much extra value was created by transit: it will just assume that all new value is a result of the transit lines—or perhaps even the additional value of the rehabbed lines over their in-need-of-maintenance state. While evidence certainly suggests that rapid transit contributes to growing property values, many neighborhoods in central Chicago outside of rapid transit sheds have been growing in value as well, suggesting that there is a general trend towards the center city that goes beyond just transit access. And in some other cities, a general shortage of housing has been pushing up real estate values across entire metropolitan areas, making the connection even murkier.

Perhaps this is a philosophical splitting of hairs. But if transit advocates justify new revenue by making the standard value capture argument and it doesn’t hold up, expect opponents to exploit that gap.

There is another political issue with this type of value capture as well. Because of the way property taxes work, TIF districts sometimes function as de facto tax increases: municipalities are allowed to collect a given amount of revenue, and so if a TIF district siphons off some money in one neighborhood, the city will simply make up for it by taking more everywhere else.

Again, this isn’t necessarily a problem: it’s perfectly defensible to support raising taxes to support public transit. But if it’s not sold to the public that way, then voters may understandably feel cheated, and be less likely to support such measures in the future. The famous Measure R sales tax referendum in Los Angeles required building a political coalition in favor of explicitly raising taxes to pay for transit. TIF districts may not enjoy any such coalition. Indeed, a Measure R-style campaign to raise taxes in Chicago’s Cook County for transit has so far failed to take off. That leaves this sort of value capture policy potentially vulnerable to backlash.

The Expo Line in LA. Credit: Prayitno, Flickr


On a more nitty-gritty level, value capture generally requires increasing real estate values. But what about neighborhoods where real estate values are stagnant or falling? One of the approved projects in Chicago is an extension of the Red Line on the far South Side, where home prices have struggled to rebound since the economic crash. The law gets around this problem by appearing to allow the transfer of money collected in the North Side Red Line district to the South Side—but that just exacerbates the already-strained “value capture” justification, and allows residents of the North Side to complain that money they thought would be returned to their communities is instead being used twenty miles or more away.

But if these sorts of transfers aren’t allowed—or aren’t available—then value capture has little to offer most working-class or high-poverty neighborhoods, which are often in the greatest need of both economic development and low-cost transportation options.

Finally, the Chicago value capture bill appears to be entirely focused on building new infrastructure, rather than supporting service—more frequent buses or trains, for example. This isn’t a necessary part of all value capture policies, but their structures often encourage it. More frequent service generally makes sense as a policy enacted across an entire system—if not on every line, then on a selection of lines that span many parts of a city—but value capture tends to be focused on particular neighborhoods or lines. TIF districts almost always have a pre-established limited lifespan, and relying on a revenue source that will one day disappear for ongoing expenses like operations makes little sense. Indeed, virtually all of the value capture examples provided by the American Public Transportation Association involve capital construction, not operations. That means value capture is unlikely to help reverse the ongoing deterioration of bus service and ridership.

Value capture has helped pay for significant new transit projects in cities across the country, and the bill in Illinois provide funding for undoubtedly necessary maintenance and rehabilitation that has no other obvious funding sources. But there are political and substantive issues to work through before embracing it as the answer to transit funding problems more generally.

Londonize!

One of the first “urbanist” blogs I found was Copenhagenize. It’s a brilliantly simple name that carries its argument in a single word: Here is a place, Copenhagen, that does something right, so let’s be more like them.

The thing Copenhagenize has in mind is biking. From particular styles of bike lanes, to more general street design, safety management, and so on, Copenhagenize uses real-life examples not to show what a really bike-friendly city might look like on a planning mockup, but what it actually looks like in the world today. It’s not a bulletproof approach, of course—critiques range from standard “but Boston/Dallas/Overland Park is different” objections to calls to hold up non-European cities as urban exemplars—but when your task is to convince people to change to something that’s new to them, you need to have a clear and positive vision of how your changes might function, and an attractive real-life city that has implemented them well is as good as you can get. More than one city planner has been converted to the bike infrastructure gospel on a trip to northern Europe.

Screen Shot 2016-07-07 at 9.54.29 AM

But other forms of urban transportation haven’t been as fortunate. People come back from New York, Paris, or Tokyo and marvel about their subways, but heavy rail is far too expensive and logistically impractical for the vast majority of American cities to consider as a major form of transit. Other people return with photos of street-running trams in Europe or Portland, but the record of the new generation of streetcars has been decidedly mixed—and, again, they’re too expensive to really serve more than a few lines in most places. Visitors to Mexico City or Bogotá might be convinced of the utility of Bus Rapid Transit—but, once more, only as an approach for a few flagship lines, and even then few US cities seem interested in pursuing the full-on BRT treatment adopted widely in Latin America.

What we need instead is a model that can be applied broadly to entire transit systems, like the bike infrastructure highlighted by Copenhagenize, in metropolises and small cities.

Allow me to humbly suggest: Londonize.

Really, any number of cities could fit the bill in terms of smart, high-quality routine bus service, and I don’t make any claim that London is necessarily the best. But London is a city everyone is (at least vaguely) familiar with, and—perhaps more auspiciously—it has those iconic double-decker buses that are a worldwide symbol of friendly public transportation.

Credit: oatsy40, Flickr


Moreover, though the Tube might get more glamorous press, London’s bus service really is impressively massive: It carries roughly 2.3 billion passengers per year—much more than the Tube (1.3 billion), close to the New York City subway (2.8 billion), and nearly half as much as every bus service in America combined (5.1 billion), while serving a population roughly 1/35 as large.

So London has buses that are iconically attractive and manage to be useful enough to garner millions of rides per day—without massive, or massively expensive, infrastructure projects. What are the basic building blocks of its success? If Denver or Cincinnati wanted to Londonize, what might they do?

Transport for London (TfL) itself identifies four pillars of its service:

Frequency. TfL says that if it can run buses at least every 12 minutes all day, people will think of that line as “show up and go” service—convenient enough to just turn up at a stop without having to go through the hassle of consulting (and the psychological leap of trusting) a schedule. That makes them much more likely to depend on the bus. Wherever possible, then, 12 minutes is the minimum standard frequency for bus lines. Some American cities have started to reflect this principle in “frequent networks,” which come at least every 12 to 15 minutes—but just like a handful of marquee protected bike lanes don’t add up to much if most streets are bike-hostile, a loose network of “show up and go” bus lines aren’t worth much if most routes remain very infrequent. That’s especially true in networks that rely on transfers for much of their reach.

Reliability. If you say a bus comes every 12 minutes, they should come every 12 minutes—not two every 24 minutes. Bus bunching, and the long gaps between buses that result, is a problem that plagues many systems, but it’s not unsolvable. Technologies like transit-signal priority, which holds green lights and shortens red lights to speed buses, as well as bus-only lanes (about which more in a minute) and good dispatch management, can help maximize reliability.

Simplicity. The bus system should be easy for new and experienced users to ride. At a macro level, this means designing routes that are intuitive and as straightforward as practical. At a micro level, it can mean good signage at the actual bus stops—ranging from metal signs that show where a route goes, how often it comes, and where you might transfer to other services, to electronic signs that can show bus arrival time estimates, real-time notifications about delays or other service changes, and other information. London has more than 2,500 of these boards all around the city, and some US systems like Chicago and Boston have begun to install similar boards as well.

Credit: Tom Page, via Flickr
An electronic bus countdown screen in London. Credit: Tom Page, via Flickr


A new static, high-information bus sign in the Twin Cities. Credit: Metro Transit


Comprehensiveness. TfL’s service standards suggest that Londoners ought to be no more than 400 meters, or about a five minute walk, from a bus stop—and in fact about 90 percent of residents are that close or closer. Low population densities in American cities might make that goal impractical, but the principle that people are supposed to be able to walk from their origin to a bus stop and from another bus stop to their destination does mean that extremely wide spacing between lines simply won’t make for a practical network. (See Jarrett Walker for a discussion of the tradeoffs between coverage and ridership.) In sparsely-populated areas where a denser network wouldn’t work, it might make sense to look into subsidies for taxis or rideshare services to solve first/last mile problems.

To these four principles, I would add three more:

Speed. To make buses a time-efficient way of getting around, they need to come frequently and reliably, but they also need not to crawl along once you’re on board. One way to avoid that, especially in cities with traffic congestion problems, is bus lanes—sections of the road that cars and trucks aren’t allowed to travel in. Because of their incredible space-efficiency, buses are able to move many times more people through a single lane than private vehicles, without creating congestion—as long as those private vehicles aren’t allowed to get in their way. For that reason, London has created nearly 200 miles of bus lanes.

Another common problem, especially on high-ridership routes, is the amount of time buses sit waiting for each new passenger to pay their fare. But many London buses have a fare card reader at each door, allowing for much faster boarding than the standard single fare reader at the front door. In the US, San Francisco has also begun implementing this form of “all-door boarding.”

Land Use. Of course, if you’re a regular reader of City Observatory, you know that transportation isn’t just about transportation—it’s also about land use. By American standards, London is an exceptionally compact, walkable city. That means that it’s easier to make sure everyone’s within a five minute walk of a bus stop; easier to ensure that destinations are near a stop; and likelier that trips will be relatively short, which suit a frequent-stop service like most bus lines. But while most American cities won’t be hitting London-level density any time soon, that just means they have lots of room for improvement. “Transit-oriented development” has become a well-known buzzword in the planning world, but research shows that TOD works in places that only have bus service, as well as near rail stations.

And finally: Road Pricing. London put in place a system of a congestion charge for its central area in 2003. It charges private cars 11.50 pounds (roughly $15) per day to travel in the cordoned area between 7am and 6 pm. This simultaneously reduces car traffic, and provides a source of funds to help subsidize transit improvements. In 2015, the charge generated more than 170 million pounds of net revenue to support the transit system. Reducing car traffic helps buses move faster, benefiting a majority of London commuters, and speeding all traffic through the center.  

In large part because of the movement that websites like Copenhagenize have helped push forward, over the last decade or so American cities have made incredible strides in making cycling a safe, viable, attractive option for getting around. It’s time to take the same approach with the most broadly accessible transit mode: the city bus.

Review: State of the Nation’s Housing 2016

At City Observatory, we love fat reports full of data, especially when they shed light on important urban policy issues. Last week, we got the latest installment in a long-running series of annual reports on housing produced by Harvard’s Joint Center on Housing Studies (JCHS). The State of the Nation’s Housing, 2016—aka SONH2016—presents copious details on the housing situation. This year, it particularly highlights the growing problem of housing affordability. (We summarized last year’s report here.)

There’s a lot to digest in this report. Our review focuses on four big issues, how the report describes affordability, its analysis of recent developments in the housing market, the outlook for homeownership as a wealth building strategy, and the implications of all this for housing policy.

Housing Affordability

SONH2016’s headline finding is the growing number of households spending half or more of their income on housing. Using the 30 percent of income standard, the report estimates the number of rental households with affordability problems has increased by 3.6 million since 2008. The report continues to use the 30 percent of income standard even though there are real questions as to whether it really reflects affordability, or addresses the housing/transportation cost tradeoff. And the number of households spending 50 percent or more of their income on rent has increased by 21 million to 11.4 million over that same time period (p. 4).

Credit: SONH2016
Credit: SONH2016


We agree that housing affordability is a widespread and serious problem. But what seems lacking from SONH2016 is a thorough diagnosis of the causes of the affordability problem and an appropriately scaled set of solutions. There’s passing reference to local land use controls as a contributing factor to the problem of housing affordability: “High rents reflect several market conditions, including a limited supply of land zoned for multifamily use and a complex approval process that adds to development costs.” (p. 4) But the report emphasizes the impact of land use controls on building affordable housing, and aside from this brief mention, offers little comment—and no policy recommendations—about how to ameliorate the effects of supply constraints by changing local zoning.

While SONH2016 does a thorough job of amassing statistics that chronicle the growth and extent of affordability issues, it spends relatively little time describing policy actions that might make a dent in the problem. On the last full page of the report, the authors offer their outlook on housing challenges. The note that only modest additional resources have been made available to support low income housing construction —we’re told (p. 36) the biggest program in the past decade is the recent authorization of the $174 million Housing Trust Fund (which works out to about $16 for each of the 11 million households spending 50 percent or more of their income on housing). In effect, we’re presented with a daunting problem without any commensurate solution.

The Housing Market

The report tries to sound some optimistic notes about about single-family homeownership. But they come off as weak reeds in the face of what continues to be a highly depressed sector of the economy. The report highlights an increase in single family housing construction (p. 1: “new home construction was up by a healthy 11 percent”) but later concedes that the total number of homeowners, and the homeownership rate, has continued to fall (p. 16).

On the plus side, the report helps dispel a commonly reported misperception about the growth of McMansions. The data show that though large homes (greater than 3,000 square feet) have become a bigger share of the market, that has more to do with the utter collapse of the market for small homes than it does with any expansion of the appetite for large ones. In fact, McMansion-sized homes are still being built at just half the rate of a decade ago (200,000 units per year compared to 400,000 at the peak). (See p. 8). As we’ve explained at City Observatory, the “McMansion/Multi-Millionaire” ratio has actually been falling.

Screen Shot 2016-07-06 at 10.30.09 AM


Very much to its credit, SONH2016 calls out the growing economic segregation of US housing. It says that poverty in the US has become more concentrated, and bluntly calls out the location of public housing and exclusionary local zoning as major causes of this problem (p. 35).

Homeownership, Wealth and Home Prices

State of the Nation’s Housing continues to promote homeownership as a reliable wealth-creating strategy, what it calls “the wealth building potential of sustained home ownership” (p. 21) The report cites data for the net wealth gains of homeowners who managed to hang on to their homes, but combines data from those who bought over the entire decade (1999 to 2009), which conceals the key fact that those who bought in say 2001 or 2002 had a very different experience than those who bought at the height of the bubble. The report omits the fact that homeowners collectively lost something on the order of $7 trillion in the housing bubble, and that these losses fell disproportionately on low income and minority households. And, as Calculated Risk’s Bill McBride points out, a decade after the peak of the housing bubble, real, inflation-adjusted home prices are still 17 percent below their peak.

Credit: Calculated Risk


This series of State of the Nation’s Housing reports have been been issued for nearly three decades. Over the years, there have been a number of recurring themes. Concerns about housing affordability have been hardy perennials. A decade ago, concerns about affordability were also in the report’s headlines, although for very different reasons. The 2006 State of the Nation’s Housing dealt primarily with how rising home prices were reducing affordability for homebuyers. (This particular aspect of the affordability problem was corrected by the popping of the housing bubble, something that that year’s SONH didn’t forsee.)

In 2006, with the nation’s housing bubble about to burst, it offered confident reassurance: “large house price declines seem unlikely for now . . . the long term outlook for housing is bright . . . STRONG DEMAND FUNDAMENTALS . . . with each generation exceeding the income and wealth of its predecessor, growth in expenditures on home building and remodeling should match if not surpass the current pace . . . (State of the Nation’s Housing 2006, page 2). Now, nearly a decade later, the housing sector’s contribution to GDP remains fully one-third lower than its historic average (SONH 16, Figure 12).

The point here isn’t that so much the SONH made a bad forecast, but more than it gave bad advice. Far from being a reliable source of wealth generation, housing was a very risky proposition that was about to impose huge costs of millions of households. Prior to 2007, one might argue that a 20 or 30 percent drop in home prices was improbable.  But in light of the human and personal costs of the last housing bubble, it seems like the report ought to be a bit more cautious in its approach to the question of whether, for whom and under what circumstances home ownership is a good investment.

Federal Housing Policy

There are some surprising omissions from the report. You’ll find no mention of the biggest and most expensive federal housing subsidy programs: the favorable tax treatment of owner-occupied housing, in the form of the mortgage interest deduction, the exclusion of imputed rental income and favorable treatment of capital gains on housing. Collectively, these policies amount to a $250 billion annual subsidy for homeownership, which thanks to a falling homeownership rate, is going to a smaller fraction of American households each year.

It’s also interesting to note that at a time when SONH16 frets that our nation’s housing problems are being aggravated by “dwindling federal subsidies” (p. 31), that federal resources for housing are “dwindling” (page 31), the value of the federal tax subsidies has increased sharply. According to the Congressional Budget Office, the combined value of favorable tax treatment for owner occupied housing increased by $39 billion between fiscal years 2013 and 2015.


If we’re really concerned about housing affordability, we have to do more than periodically trumpet alarming statistics. We really ought to plainly identify root causes, and spell out the public policy choices that we’ve made — through local zoning and public subsidies — and talk about the scale of the effort required to materially change the situation.

A casual reader of the SONH16 may come away with the impression that federal housing policies are ineffectual and under-funded, but that’s hardly the case. We have a well-funded federal housing policy that works quite well—if you agree that its intended purpose is to provide generous support, particularly for the wealthiest households, to own their own homes.   In our view, a more comprehensive framing of federal housing policy–one that encompasses tax subsidies to homeownership–provides a much more useful context to understanding our housing problems and formulating commensurate solutions.

If you’re interested in housing, particularly the tale of the tape when it comes to a wide range of housing statistics, SONH 16 is an invaluable resource. But when it comes to thinking about housing policy, and specifically, identifying the root causes of our affordability problem and the nature and scale of the policy solutions that would need to be undertaken to actually move the needle on the indicators presented here, you’ll have to look elsewhere.

The fourth virtue of public transit

For most Americans, public transit basically has three virtues. The first two cater to liberal sensibilities: it’s environmentally friendly, and because it’s cheap, it’s effectively a sort of transportation safety net for the poor. On top of those feel-good benefits, there’s a “business” case, which is that public transit is good for economic development.

These three virtues are broadly understood—or at least, understood as standard arguments in favor of transit, even if not everyone finds them convincing—by most people, even those who couldn’t get into the weeds about dedicated lanes for streetcars or all-door fare payment. They are accessible to average voters and local elected officials alike.

By Ibagli (Own work) [Public domain], via Wikimedia Commons

But as city centers are changed by both demographic shifts and technological innovation, it seems increasingly necessary to add a fourth virtue to the broad public debate over urban transportation: Public transit is space-efficient.

But the knock on transit is that it’s slow.  Or slower than a private car.  And the results of a recent race in Chicago shows that transit is considerably slower than UberPool, Uber’s carpool like ride sharing service. The race was results were confirmed by a study from DePaul University’s Chaddick Institute for Metropolitan Development, which found that Uber Pool was significantly faster than Chicago’s public rail and bus system for most trips. While Uber Pool also cost more, its price was significantly below that of regular Uber service—and even further below the cost of traditional taxis. The implication of the head-to-head comparison is that, for a significant number of people, switching some proportion of the CTA’s 1.7 million daily trips to Uber Pool might be worth it.

And even Uber Pool’s cost disadvantage over public transit might disappear if a new pilot program in Boston catches on. This month, Uber announced that it would introduce monthly Uber Pool passes—like transit passes—for just $2 per ride, or less than the MBTA’s $2.25 fare. While these temporary low fares are no doubt a money-losing loss leader, if UberPool fares are anywhere close to the price of public transit it would seem like we’re probably looking at a massive shift from public transit to these sorts of ride-hailing services. And wouldn’t that be a good thing, if it’s both faster and nearly as cheap?

But here’s where the importance space-efficiency comes in. When one person switches from the bus to Uber, two things happen. One is that they get a faster trip almost by definition: A vehicle that makes many stops (the bus) is going to be slower than a vehicle that makes few or no stops (the Uber) unless the bus has some other advantage, like transit lanes that allow it to avoid traffic congestion. And the vast majority of American bus lines are given no such benefit.

The second thing is that they switch from a very space-efficient vehicle, where they probably take up only a few square feet on the road, to a very space-inefficient vehicle, where they take up many, many times more.

Screen Shot 2016-07-05 at 9.38.11 AM

Screen Shot 2016-07-05 at 9.38.00 AM

(Yes, the above image isn’t totally fair—Uber and autonomous vehicles could theoretically reduce the space needed for parking by quite a bit, and potentially services like Uber Pool could shrink the space it takes up on the road as well. But regardless, there’s no doubt that while traveling, Uber and autonomous vehicles consume space much more like private vehicles than like public transit, pedestrians, or bikes.)

When one person makes that switch, it doesn’t affect traffic very much. But if many people were to make that switch, particularly on streets that carry a decent number of public transit passengers, the implications are quite serious. Even in an Uber Pool, riders will be increasing the road space they take on manyfold—and thereby radically decreasing the number of people who can use the road at a time. In other words, they will be creating serious traffic congestion.

In many cases, there’s just no plausible way to physically move everyone who currently uses a road if bus riders were to switch to Uber-like services. On Lake Shore Drive in Chicago, roughly a quarter of all the people on the road at rush hour are on public buses, and travel speeds already regularly fall well below the speed limit. Were a large proportion of those bus riders to switch to Uber, they may very well see their own travel times become longer, as they suffer from the congestion that they have helped to create. Uber makes it possible for one person, or even many people, to take a faster trip; but if we were all to take Uber, we’d all have even slower trips.

Crucially, though, no matter how slow traffic gets, Uber will almost always be faster than street-running, mixed-traffic transit services, meaning no one will have an incentive to fix the problem by switching back to the bus. This is an issue that can only be resolved by public policy: Re-prioritizing space-efficient transportation by, for example, creating bus lanes.

The broader point here is that the kind of dense, pedestrian-friendly neighborhoods that are increasingly in demand can’t function without very space-efficient forms of transportation. For very dense areas, like central business districts, that’s often because you literally can’t fit all the people traveling to and from them on roads in cars. In lower-density residential neighborhoods and commercial corridors, travel congestion may be less of a barrier, but parking becomes the pinch point: if everyone arrives by car, the amount of parking required would end up leveling half the neighborhood. (Recall the parking requirements in downtown Kalamazoo, which call for parking lots so big that they wouldn’t fit on their parcels, even without any actual building.)

If this virtue of public transit (and, of course, walking and biking) is understood, then calls for there to be “enough” parking, or to “solve” the congestion problem in popular, dense neighborhoods, stop making any sense: allowing everyone to arrive by car is just physically incompatible with those types of communities.

The Week Observed: July 1, 2016

What City Observatory did this week

1. Last week’s big news was Brexit: the vote by the United Kingdom to leave the European Union. What does that have to do with urban policy on our side of the Atlantic? Well, it turns out that just as urban density predicts voting behavior in America, with denser neighborhoods strongly trending more liberal, the Brexit vote was also highly correlated with urban population patterns: the higher a district’s residential density, the higher the “Remain” vote.

2. A common knock on more compact metro areas is that the cost of living is higher—in particular, the cost of housing. But while it’s true that our policy-induced “shortage of cities” has led to higher housing prices than necessary in many sought-after urban communities, many analyses miss a big part of the cost-of-living picture: transportation costs. Using our own “sprawl tax” estimates of the extra time and money costs of longer commutes in more spread-out metropolitan areas, we show that places with higher housing costs tend also to have lower transportation costs.

3. We’ve previously argued that the difference in housing price growth in urban cores and suburban peripheries can act as a sort of “Dow of cities,” indicating shifting patterns of demand for different kinds of neighborhoods. Now we haveanother such indication that the demand for inner-city neighborhoods is increasing: new housing price data based on repeat-sales models by Zip code for cities across the country confirms that central city property values are growing faster than those on the periphery—especially in larger metro areas.

4. What are the next steps for the urbanist movement? At the “Act Urban” convening in Philadelphia last week, hosted by Gehl Institute, our own Joe Cortright spoke on three challenges for the civic commons moving forward: transitioning from “micro” to “macro” interventions in public spaces; understanding and responding to the market demand for space in urban centers, and its relationship to vibrant public spaces; and adopting metrics that can help drive policy around more than just vehicular traffic.


The week’s must reads

1. Two interesting pieces of Uber news this week: First, Bloomberg‘s Justin Fox looks at the ease with which Uber competitors are challenging the ride-hailing company’s dominance abroad, and notes that the idiosyncratic, city-by-city markets for its services leaves it vulnerable to competition in ways that other companies that depend on network effects to dominate their sectors aren’t. Meanwhile, Uber announced that it would be launching a trial monthly subscription service for just $2 per ride in Boston—an almost public transit-like service package.

2. The Chicago Sun-Times covers the results of perhaps the country’s greatest experiment in public housing reform, the Chicago Housing Authority’s Plan for Transformation. While the teardown of midcentury public housing towers have broken up some of the intentionally concentrated pockets of poverty, providing former residents with vouchers that gives them more of a choice of neighborhoods has not yet to as much desegregation as some proponents originally imagined.

3. Google’s Sidewalk Labs is attempting to leverage the technology company’s tools to improve urban life. The Guardian unearthed some of the documents developed for Columbus’ “Smart City” proposal that include a role for Google technology in transit, parking, and related payments, raising suspicions about the company’s objectives. At CityLab, Laura Bliss countered that there’s nothing nefarious in Google’s approach. In a column at Fast Company, the Labs’ CEO Daniel Doctoroffsheds some light on what they think of as their major problems to solve: understanding travel demand; managing parking supply; supplementing traditional fixed-route transit with ride-hailing services; and more. While many of these ideas hold some promise, we hope that all sides moving forward will keep in mind some of the pitfalls of treating cities simply as engines to be optimized—and that broader social or political questions are sometimes as or more important than technological innovations.


New knowledge

1. At the Washington Post, Emily Badger reviews even more research on the growing demand for inner-city living, but the results are more nuanced than you might think. While there has been a clear pattern of people with greater means moving to city center over the last few decades, these centers remain, on average, populated by people of lower socioeconomic status than residents of outlying suburbs. Badger also digs into the urban demographics of the 1880s to suggest some of the inherent advantages of more central living that may explain some of today’s shifting preferences.

2. There’s a treasure trove of gentrification-related research from this research symposium held by the Philadelphia Federal Reserve (mentioned in the Post story), ranging from whether falling crime triggers more in-moving of higher-income households (it appears so) to the effect of gentrification on small businesses (on average, there is no evidence of “business displacement,” though effects may vary by neighborhood). If you work on gentrification-related issues, this would be a good page to bookmark.

3. New York City has released new data on the performance of their “Select Bus Service” lines, which are given a basket of improvements designed to improve speed and reliability at a relatively low cost. On the Nostrand SBS in Brooklyn, travel times have fallen 15 to 31 percent. A breakdown of the improvement shows significant gains from bus-only lanes, with the amount of time spent stuck in traffic declining by 40 percent—but even bigger gains from “proof of purchase” fare payment, which allows buses to avoid long lines of people paying when the bus arrives by installing prepayment kiosks at stations.


The Week Observed is City Observatory’s weekly newsletter. Every Friday, we give you a quick review of the most important articles, blog posts, and scholarly research on American cities.

Our goal is to help you keep up with—and participate in—the ongoing debate about how to create prosperous, equitable, and livable cities, without having to wade through the hundreds of thousands of words produced on the subject every week by yourself.

If you have ideas for making The Week Observed better, we’d love to hear them! Let us know at jcortright@cityobservatory.org, dkhertz@cityobservatory.org, or on Twitter at @cityobs.