How well are “stay at home” and “shelter in place” policies working in different metro areas?
“Big data” from smartphones gives us a picture of how we’re dialing back on travel in response to “stay-at-home” orders to combat the Covid-19 pandemic. We’ve compiled the data from Google and Cuebiq on the variations in travel behavior in the nation’s largest metro areas.
- Google reports that since mid-February, workplace visits have declined by between a third and a half in nearly all large US metro areas
- Cuebiq estimates that its total travel index has fallen by between 25 and 95 percent in large US metro areas, with the typical metro experiencing a decline of about 55 percent.
We’re currently analyzing these data, but have some early observations:
- Hard hit cities (New York, New Orleans) have big travel declines.
- Well-educated, tech-oriented cities have consistently high travel declines, possibly reflecting the ability of many workers to work remotely
- Tourism centers have (Las Vegas, Orlando) have seen declines in travel
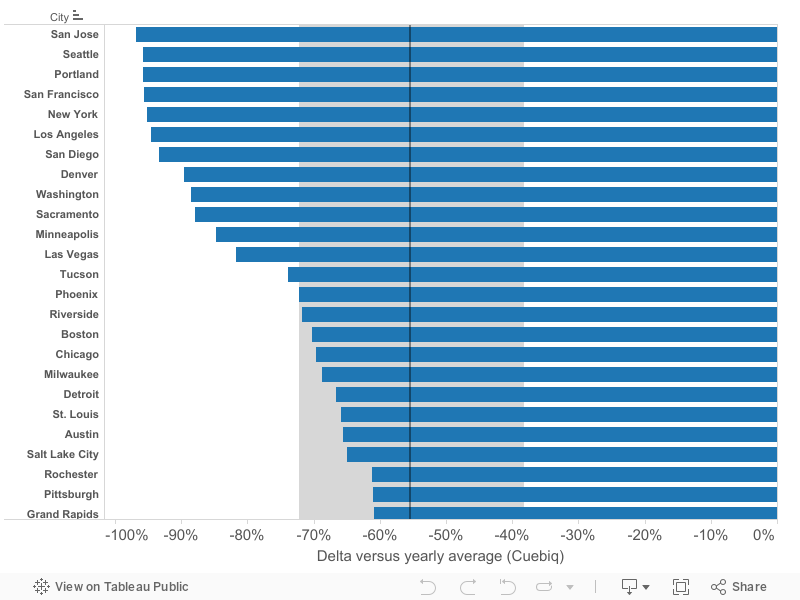
Metro areas ranked by decline in travel (Cuebiq)
Cuebiq estimates how much travel has changed in each county in the US compared to the year earlier. By its estimates, all metro areas have seen declines in its travel index. Declines range from less than 25 percent in Virginia Beach and Jacksonville to more than 95 percent in New York, Seattle, Portland, San Francisco and Seattle. The typical large metro area has seen a decline of about 55 percent compared to the year earlier. (We use data for the most central county in each metro area as a proxy for overall change in travel in that metropolitan area).
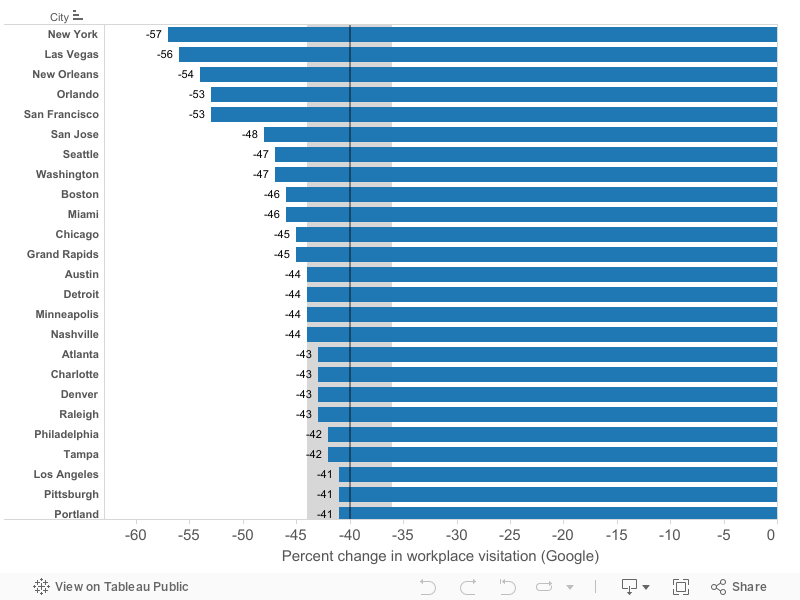
Metro areas ranked by decline in workplace visiting (Google)
Google estimates how much visiting to workplaces had changed between the middle of February and the end of March. By its estimates, workplace visits have declined in all metro areas. Declines range from as little as 33 percent in Jacksonville, Memphis and Phoenix to more than 50 percent in New York, New Orleans, and San Francisco. The typical large metro has seen a decline of about 40 percent compared to February. (We use data for the most central county in each metro area as a proxy for overall change in travel in that metropolitan area).
Comparing the Google and Cuebiq estimates
There are obvious differences in definitions, methodology and measures between Google and Cuebiq. As the above summary suggests, the percentage decline in travel as measured by Cuebiq is considerably greater in magnitude than the percentage change in workplace visitation as measured by Google. The following chart shows the estimated change in the travel index for each metro (per Cuebiq) compared to the average change in workplace visitation (per Google).
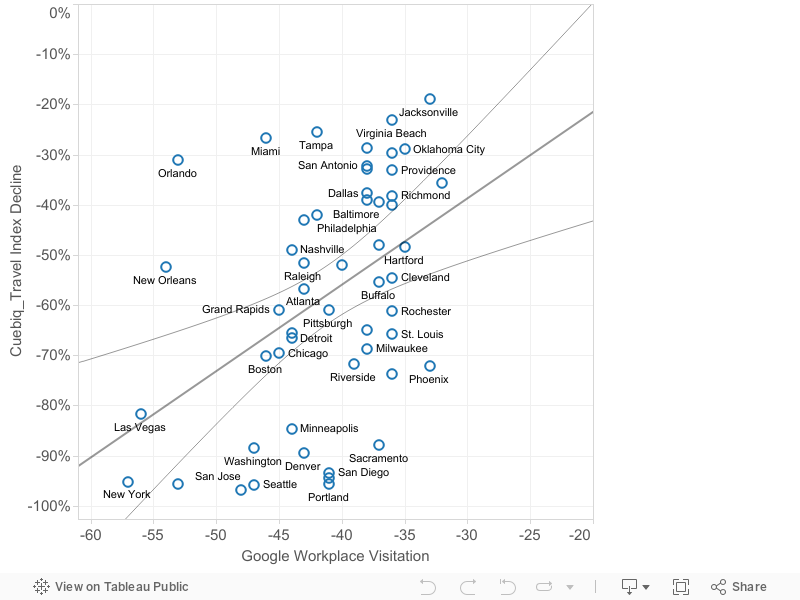
Overall, there’s a reasonable correlation between the two measures. Cities that rank high on the Google index, also rank high on the Cuebiq index. Statistically, the coefficient of determination (R2) between the two series is .19.
Some Initial Findings
Hard hit cities show big declines. New York and New Orleans show large declines on both indices. New Orleans ranks first in cases per 100,000, and has the third largest decline in workplace visitation according to Google. Cuebiq estimates that New York has seen a 95 percent reduction it its travel index; Google ranks it number one for reduction in workplace visitation. It seems likely that the higher level of concern in these areas due to the prevalence of reported cases gives people strong incentives to avoid travel.
Well-educated, tech-oriented cities seem to have high levels of travel reduction. The top of both the Google and Cuebiq lists are dominated by the nation’s tech centers including San Jose, San Francisco, Seattle, Portland, San Diego, Denver, Washington. This may reflect a high level of awareness and concern about the Covid-19 pandemic, and the ability and proficiency to work remotely. The lower-left hand corner of our scatter chart comparing the Google and Cuebiq estimates (which represents cities with the biggest declines on both indices, is populated by this well-educated tech centers.
The hit to tourism is apparent: Las Vegas and Orlando are striking outliers in our analysis of the Google data, with large declines in total travel (which may directly reflect lower visitor counts) and indirectly, from layoffs in accommodations, food service, travel, and entertainment businesses. The industry sector with the largest declines in employment appears to be accommodations and food service; it’s no surprise that metro areas heavily dependent on these industries would experience larger declines in associated travel.
These are just our first initial impressions: We’ll be digging into this data in future commentaries, so stay tuned.
About the Data
This commentary draws on two sources of data: Google’s “community mobility reports” and Cuebiq’s “mobility index”. Both of these reports are based on these company’s analyses of data from smart phone and other device users. Cuebiq tracks the trips we take, and has an index of total daily travel per person (really, per device) for the nation’s counties. It’s unclear whether this is a distance measure or a count of trips, or some other measure. Google has aggregated and anonymized user location data to measure (apparently) the amount of time we spend or number of trips we make to various locations. (We say “apparently” because Google’s explanation of its measures and methodology is quite vague.) It, too, reports data for counties.
Because we focus on metropolitan areas, we used data for the central county in each large metropolitan area as an indicator for the entire metropolitan region. Unfortunately, in our view, neither Google nor Cuebiq enable users to download their county level data in a machine readable format, such as CSV. Consequently, assembling these county level estimates requires laboriously clicking through their interfaces (Tableau for Cuebiq and PDF for Google) and manually transcribing the data, and then entering it into a database for analysis. (Our apologies if there are any transcription errors: they could be avoided, and this data would be of infinitely greater value if both companies would release machine readable versions of their reports. In the public interest, we call on them to do so at their earliest opportunity).
Google Community Mobility Reports
Google has started publishing “Community Mobility Reports” that tap the location data from smart phones to measure the approximate number of trips we take to various destinations. Data are available at the county level (subject to minimum data requirements), and are available for six broad categories destinations such as retail, recreation, work, home, and parks. As this screenshot for Portland’s Multnomah County shows, work trips are down about 41 percent, retail trips are down more than 60 percent and grocery/pharmacy trips are down about 30 percent compared to a pre-pandemic baseline.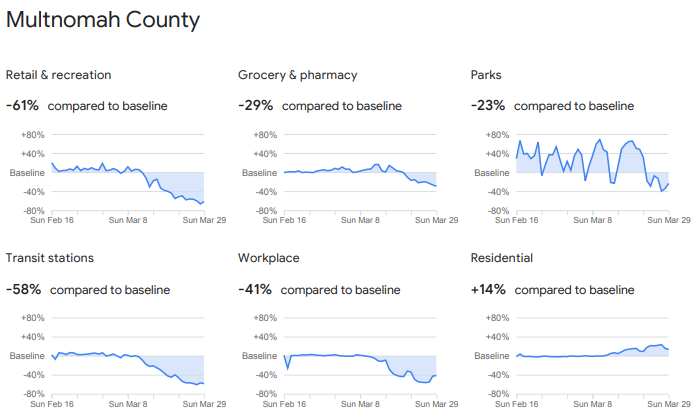
Google produces separate estimates for the percentage change in “visiting” at each of six categories of destinations between February 16 and March 29. Google’s six categories are workplaces, retail shops, grocery and drugstores, parks, transit centers, and residences. Google’s data show universal decreases for time spent at work, in stores of all kinds and in transit centers. They show an increase in time spent in residences. The pattern for time spent in parks varies across metropolitan areas (and over time, within metropolitan areas) with a wide range of increases and decreases.Its a very exiting and useful dataset, but inexplicably, Google has chosen to make it available only as a series of state-by-state PDF files, which make it extremely tedious for linking to other research.
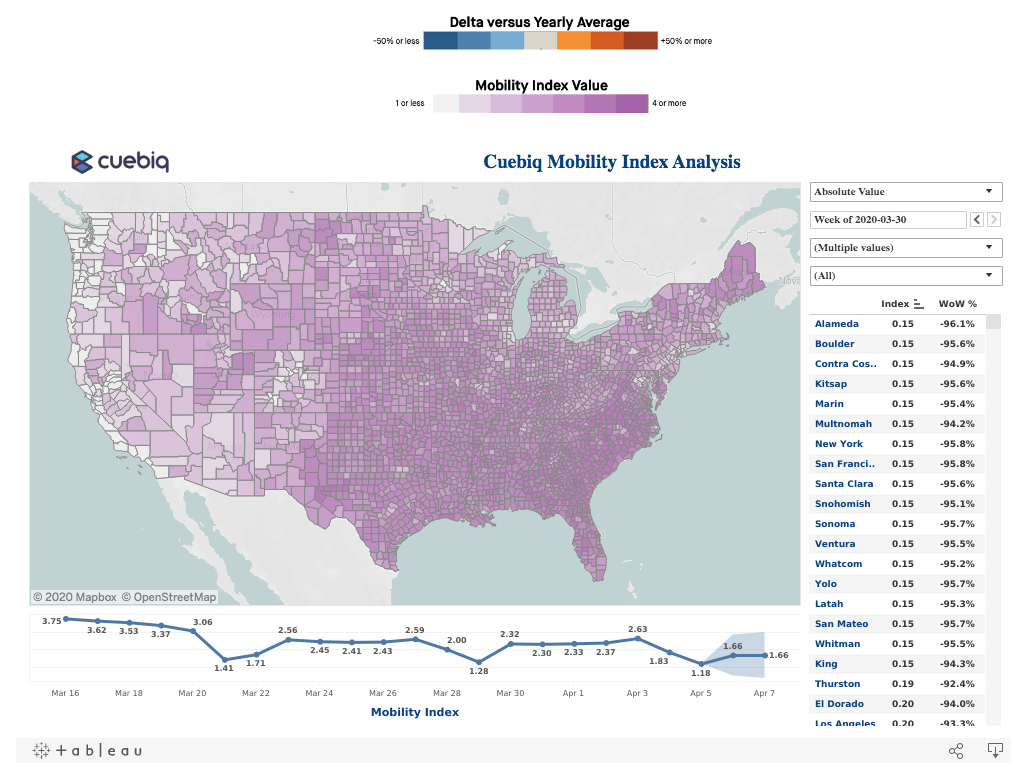
Cuebiq Mobility Index Analysis
We examine Cuebiq‘s estimates of the total percentage change in its travel index between what it calls the “delta versus yearly average” (unclear whether this is 2019, 2020 or some other base period), and the estimated index for the current week (in this case the week ending March 30). Cuebiq’s estimates show a pattern of universal declines in travel for all metro areas we examined.