Originally published April 12; Revised and Corrected April 14
The Covid-19 pandemic is hitting two regions in the US much harder than others: The NE Corridor and the Great Lakes
Metro areas in these regions have the highest rates of reported cases per capita, and the highest levels of growth
In contrast, incidence and growth rates are subdued in the South and West.
At City Observatory, we’ve been tracking the spread of the Covid-19 pandemic among the nation’s 53 largest metropolitan areas since the middle of March. Our emphasis has been on identifying the incidence (reported cases per 100,000 population) and the growth (the daily growth rate averaged over the previous seven days), as a way of establishing which cities have been hardest hit, and which ones seem to be making progress in flattening the curve. Today, we step back and look at the regional geography of the incidence and growth of the pandemic: What regional patterns do we observe in where the virus is spreading most rapidly. As always, the usual caveats about the ambiguity of reported case data apply: Testing isn’t done randomly, and is constrained by testing capacity, and is conditioned by medical necessity. As a result, reported case data don’t necessarily accurately reflect the actual number of cases in a city or region.
The national pattern
Our core measure of the incidence of Covid-19 is the number of reported cases per 100,000. We’ve mapped them for April 13 here:

Shaded areas depict each of the nation’s 53 most populous metropolitan areas (all those with a million or more residents). Darker red shading indicates metro areas with the highest rates of reported cases per capita; the numbers superimposed on the shaded areas are the number of cases per 100,000 reported through April 13, 2020, according to the county level data compiled by The New York Times. As this map makes clear, the pandemic has affected the entire nation, but the incidence of the virus seems much higher in some places than others.
There are a couple of somewhat isolated hotspots. Seattle was the site of the first significant outbreak, and still ranks among the top twelve in cases per capita. New Orleans has the second most serious outbreak of the disease (with about 1,048 cases per 100,000). Interestingly, however, nearby metros are far less affected. Portland (less than 200 miles from Seattle) has a rate of reported cases (41) that is in the bottom quartile of large metros; similarly Houston (350 miles from New Orleans) has a rate of reported cases (75) that is slightly below the median.
The Northeast Corridor
As The New York Times has said, New York City is the epicenter of the pandemic. and a quick look at nearby metro areas suggests that proximity to New York City may be a factor explaining the spread of the virus. As this map focusing on the Northeastern United States makes clear, all of the metropolitan areas in the Northeast Corridor (i.e. between Washington and Boston) have above median levels of reported Covid-19 cases per capita.
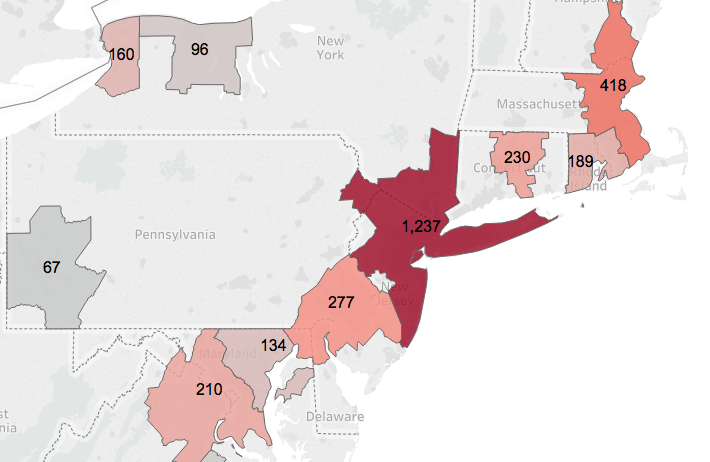
Six Northeast Corridor metros rank in the top eleven for cases per capita: New York is first, Boston is fourth, Philadelphia is fifth, and Hartford is seventh, Washington is ninth and Providence is eleventh. The following chart shows the top 12 metro areas for incidence of reported Covid-19 cases per capita on April 13.

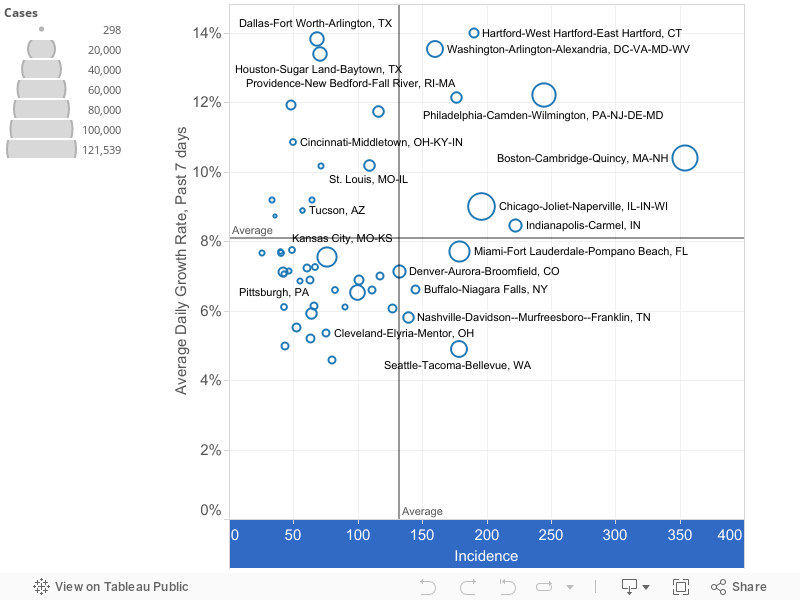
What is particularly disconcerting about the high rates of reported cases per capita in the Northeast Corridor is that several of these cities are also seeing their rate of increase in the number of reported cases continuing to be higher than the national average. Among all large metro areas, we estimate that the daily rate of increase for the week ending April 13 averaged about 6.9 percent. While New York has lowered its rate of increase to this level, other NE Corridor metros are growing faster: Boston and Philadelphia (10 percent), Providence (11 percent), Washington (12 percent) and Hartford (14 percent). The combination of faster growth in reported cases and a higher incidence per capita puts them in the upper right hand quadrant of our classification of metros according the the incidence and growth of the virus.
The Great Lakes Region: Detroit, Indianapolis, Chicago
Three metro area in the Great Lakes region have levels of reported Covid-19 cases per capita that are in the top ten of all large metro areas. Detroit is third (478 per 100,000), Indianapolis is sixth (245) and Chicago is seventh (226). Milwaukee’s rate (134) is above the median as well. Other nearby metro areas have rates of reported cases that are at or below the median, including Cleveland (82) , Grand Rapids (41), and Columbus (69). Unlike the hard hit cities in the Northeast Corridor, the growth rate of reported cases in Detroit (6 percent), Indianapolis (6 percent) is slightly below the national average of 6.9 percent , and at 8 percent Chicago’s is still higher.

There appear to be emerging and persistent regional differences in the spread of the Covid-19 pandemic. In general, metro areas in the West and South have seen lower incidence of cases, and in the past several weeks, slower growth in new reported cases than the rest of the country. Meanwhile, as described here, cities in the Northeast Corridor and several cities in the Great Lakes region have experienced the highest incidence of reported cases, and continue to experience higher than average levels of growth. At this point, we don’t have an explanation for this regional disparity, but as our knowledge about the pandemic grows, it bears closer investigation.
Note: This post has been revised to include data for April 13. The original post contained an incorrect estimate of cases per capita in the New York metropolitan area. For more information, see our daily tabulation of metro area data.