On the Road Again

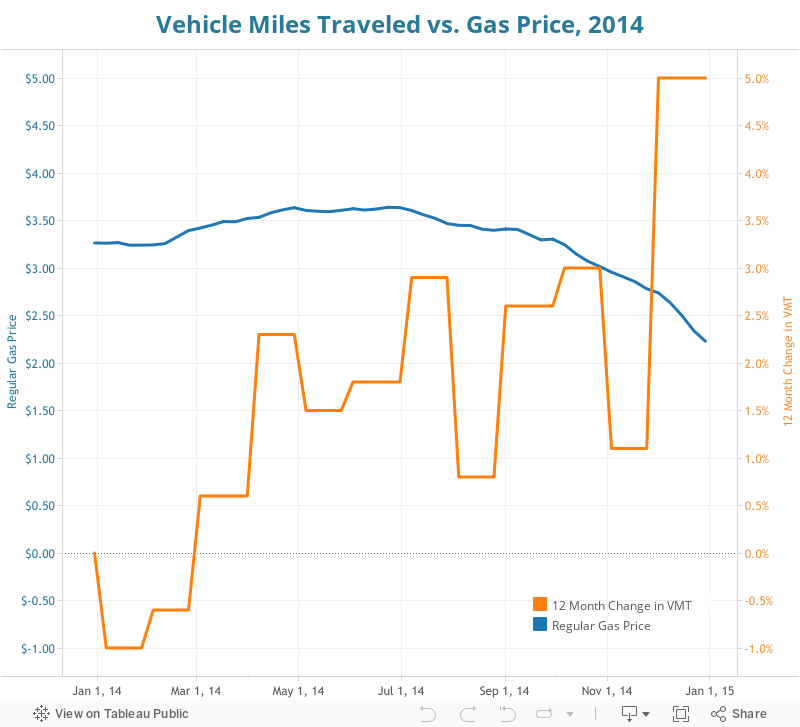
The last few months have witnessed a notable rebound in vehicle miles traveled. The U.S. Department of Transportation reports that for the year ended December, 2014, American’s drove 3.015 trillion miles, up about 1.7 percent from the previous year–the first noticeable increase in driving in more than a decade. The upward trend has led the highway lobby to excitedly claim that “demand on the roadway system is returning to historical trends of increased freight traffic and more overall use of passenger vehicles.”

But is that really the case? What is behind the increase in driving–and do the last few months of data really signal a return to a period of increasing driving?

It’s very clear what’s behind the surge in VMT. The big news of the energy market last year was the collapse in oil prices. Oil that had averaged roughly $100 a barrel for more than five years suddenly dropped to less than $50, taking gasoline prices down with it. According to the Energy Information Administration, the average price of a gallon of regular gas fell from $3.26 in January 2014, to $1.99 in February 2015.

The data for the last calendar year show that the rebound in driving roughly corresponds to the last quarter of the year–the time when gas prices dropped the most. The blue line shows the price of a gallon of gas in dollars, by week, and the orange line shows the percentage change in vehicle miles traveled compared to the same month one year earlier.

It would be extremely surprising if the lower price of gasoline didn’t prompt Americans to drive more. It’s quite clear that the run up in gas prices since 2004 was a major factor in reducing the amount of automobile travel. Academic studies suggest that the short-run elasticity (price responsiveness) of driving is about -0.1 to -0.2, meaning that a 10 percent increase (decrease) in fuel prices will result in a 1-2 percent decrease (increase) in miles driven.

As our colleague Clark Williams-Derry at the Sightline Institute has pointed out, the increase in driving is about what you’d expect given the historic relationship of gas prices and driving. The increase in driving is likely to lead to more traffic congestion and more crashes–externalities of automobile use that have been easing in recent years.

Lower gas prices also influence vehicle purchasing patterns. Sales of light trucks increased about 3.6 percent, year-over-year from December 2012 to December 2013. Truck sales accelerated briskly in 2014, recording a 12.4% increase between December 2013 to December 2014, to a total of more than 9 million light trucks.

The net effect was to slow the rate of improvement in the average fuel economy of newly purchased cars. The University of Michigan computes the sales-weighted average fuel economy of newly purchased cars on a monthly basis. Over the past seven years, Americans have been purchasing progressively more fuel efficient vehicles–average fuel economy of newly purchased cars has increased from 20.8 miles per gallon in model year 2007 to 25.3 miles per gallon last year.

In the last quarter of 2014, the year-over-year rate of improvement in vehicle fuel efficiency declined sharply. For the first three quarters of the year, new cars sold in each month averaged about 0.7 more miles per gallon than cars sold in the same month in 2013. For the last quarter of 2014 (when gas prices were dropping precipitously) the fuel economy of new cars averaged only about 0.3 more miles per gallon that cars sold in the same month in the previous year.

There’s a lot of emphasis put on the raw mileage number–3 trillion miles–but a better way of thinking about whether we’re driving more or less as individuals is to adjust these gross mileage numbers by population. Nearly half of the 1.7 percent increase in miles driven is due simply to having more people. Adjusted for population, the increase isn’t an impressive, about 0.9%. Per capita driving is still well below its 2005 peak– we’re driving about as much as we did in 1998.

fred2

You can see the underlying data for this chart here.

The big question going forward is whether this uptick is the harbinger of a reversal in the decade-long decline in driving, or whether it’s just a temporary blip. The evidence so far is simply too fragmentary to draw hard conclusions. But the recent rebound in gas prices–up 18% to $2.36 per gallon, according to the Energy Information Administration– may mean that the boost to driving that was provided by cheap gas is already ebbing.

What does it mean to be a “Smart City?”

The growing appreciation of the importance of cities, especially by leaders in business and science, is much appreciated and long overdue.  Many have embraced the Smart City banner.  But it seems each observer defines “city” in the image of their own profession.  CEOs of IT firms say that cities are “a system of systems” and visualize the city as an increasing and dense flow of information to be optimized.  Physicists have modeled cities and observed relationships between city scale and activity, treating city residents as atoms and describing cities as conforming to “laws.”

In part, these metaphors reflect reality.  In their function, cities have information flows and physical systems.  However, it is something more than its information flows and physical systems, and its citizens need to be viewed as something other than mindless atoms.

The prescriptions that flow from partial and incomplete metaphors for understanding cities can lead us in the wrong direction if we are not careful.  The painful lessons of seven decades of highway building in U.S. cities is a case in point.  Epitomized by the master builder, Robert Moses, we took an engineering view of cities, one in which we needed to optimize our cities to facilitate the flow of automobiles.  The massive investments in freeways (and the re-writing of laws and culture on the use of the right of way) in a narrow way made cities safe for much greater and faster travel–but at the same time they produced massive sprawl, decentralization and longer journeys, and eviscerated many previously robust city neighborhoods.

If we’re really to understand and appreciate cities, especially smart cities, our focus has to be elsewhere:  it has to be on people.  Cities are about people, and particularly about the way they bring people together.  We are a social species, and cities serve to create the physical venues for interaction that generate innovation, art, culture, and economic activity.

What does it mean for a city to be smart?

The most fundamental way a city can be smart is to have highly skilled, well-educated residents.  We know that this matters decisively for city success.  We can explain fully 60% of the variation of economic performance across large U.S. metropolitan areas by knowing what fraction of the adult population has attained a four-year college degree.  There’s strong evidence that the positive effects of greater education are  social–it spills over to all residents, regardless of their individual education.

Educational attainment is a powerful proxy measure of city economic success because having a smart population and workforce is essential to generating the new ideas that cause people and businesses to prosper.

So building a smart city isn’t really about using technology to optimize the efficiency of the city’s physical sub-systems.  There’s no evidence that the relative efficiency of water delivery, power supply, or transportation across cities has anywhere near as strong an effect on their success over time as does education.

It is in this process of creating new ideas that cities excel.  They are R&D facilities and incubators, and not just of new businesses, but of art, music, culture, fashion trends, and all manner of social activity.  In the process Jane Jacobs so compelling described, by juxtaposing diverse people in close proximity, cities produce the serendipitous interactions that generate what she called new work.

We don’t have an exacting recipe for how this happens.  But we do know some of the elements that are essential.  They include density, diversity, design, discovery and democracy.

Density. The concentration of people in a particular place.  Cities, as Ed Glaeser puts it, are the absence of space between people.  The less space, the more people, and the greater the opportunities for interaction.  Cities are not formless blobs; what happens in the center–the nucleus–matters, because it is the place that provides key elements of identity and structure and connection for the remainder of the metropolitan area it anchors.

Diversity. The range of different types of people in a place.  We have abundant evidence that the diversity of the population– by age, race, national origin, political outlook,and other qualities– helps provide a fertile ground for combining and recombining ideas in novel ways.

Design.  We are becoming increasingly aware that how we populate and arrange the physical character of cities matters greatly.  The arrangement and aesthetic of buildings, public spaces, streetscapes and neighborhoods matters profoundly for whether people embrace cities or abandon them.  We have a growing appreciation for urban spaces that provide interesting variety and are oriented to walking and “hanging out.”

Discovery.  Cities are not machines; citizens are not atoms.  The city is an evolving organism, that is at once host to, and is constantly being reinvented by, its citizen inhabitants.  A part of the attraction of cities is their ability to inspire, incubate, and adapt to change.  Cities that work well stimulate the creativity of their inhabitants, and also present them all with new opportunities to learn, discover, and improve.

Democracy.  The “mayor as CEO” is a tantalizing analogy for both mayors and CEOs; CEOs are used to wielding unitary, executive authority over their organizations; many mayors wish they could do the same.  But cities are ultimately very decentralized, small “d” democratic entities.  Decision-making is highly devolved, and the opportunities for top-down implementation are typically limited.  Citizens have voice (through voting) and the opportunity to “exit” by moving, appropriately limiting unilateral edicts.  Cities also give rise to new ideas, and when they work well, city political systems are permeable to the changing needs and values of their citizens– this is when many important changes bubble up.

All of these attributes of cities are susceptible, at least in part to analysis or description using the constructs of “information flows” or “systems of systems.”  They may be augmented and improved by better or more widespread information technology. But it would be a mistake to assume that any of them are capable of being fully captured in these terms, no matter how tempting or familiar the analogy.

Ultimately, when we talk about smart cities, we should keep firmly in mind that they are fundamentally about people; they are about smart people, and creating the opportunity for people to interact.  If we continuously validate our plans against this key observation, we can do much to make cities smarter, and help them address important national and global challenges.

Who’s Vulnerable to Retail Retrenchment?

This week comes news that Target is laying off 1,700 workers at its Minneapolis headquarters, looking to become leaner and more efficient. It’s just the latest move in a shifting retail landscape in the United States.

Target is not just downsizing its headquarters, it’s shifting to smaller urban stores–Target Express. Other retailers like Walmart and Office Depot have have also been developing smaller stores. The days of big boxes and power centers seem to be giving way to to more urban-centered and smaller-footprint retailing, undermining the economics of larger-scale retailing. It’s estimated that there are over 1,200 dead or dying malls in the U.S. It appears that we’re way overbuilt for retail space. Finding productive uses for these disused spaces is now a major undertaking for communities around the nation.

Several factors seem to be driving the tectonic shifts in retailing. Part of the problem is that retail, like housing,was overbuilt during the bubble: commercial developers typically followed new housing development, and as the housing stock sprawled in the last decade, so too did the expansion of retail space.

Another important factor is the technological change in the form of growing e-commerce. More and more, we’re purchasing goods and services via the Internet and mobile devices. According to data compiled by Erik Brynjolfsson, e-commerce now accounts for about 30 percent of non-food, non-auto retailing, and is continuing to grow:

fred

There’s a bit of irony here: big box stores only become economically feasible thanks to earlier technological advances, including universal product codes, computerized inventory management, real-time ordering, and global data networks. These same technologies now help enable smaller stores (tailoring inventory to localized demand) and empower consumers to order online at home and via pervasive mobile devices.

The shifting retail environment will have impacts on the transportation system as well. The latest transportation data show a decline in the number and length of shopping trips (which decreases transport intensity of retailing), but this is at least partially offset by more travel by commercial delivery vehicles (like UPS and Fedx). It’s an open question as to how this will play out: will these shifts encourage (more) fleets of smaller transit trucks, or will increasing e-commerce retail sales and smaller urban stores mean larger trucks on urban roads? (Regardless, the D.O.T. believes e-commerce will significantly impact our road infrastructure by 2045, and that despite the hopes of Jeff Bezos, drones may not help solve that any time soon.)

To judge who’s most likely to be affected by these trends, we compiled some metropolitan level data on the amount of retail space per capita. The data come from Co-Star, a private firm that tracks retail space leasing throughout the nation. (They helpfully make their market reports available here). These data are for 2007 and we’ve computed retail space per capita in each market by dividing total square footage by each metropolitan area’s 2007 population.

The national average is about 46 square feet of retail space per capita, with most metropolitan areas having between 40 and 55 square feet per capita. There are a number of outliers, however.

Milwaukee/Madison has the highest amount of retail space per capita, and many southern, sprawled metros rank higher on this metric as well. These are the places most likely to struggle with a dwindling appetite for retail space, and the economic consequences that follow, be it in fewer retail jobs, large swathes of unused space, or transportation costs. At the other end of the spectrum, some metropolitan areas have far more space-efficient retailing: Portland has just 30 square feet of retail space per capita, fully one-third less than the national average.

By global standards, the U.S. has much more space devoted to retailing than anyone else: comparable estimates for other countries include: 23 square feet per capita in the United Kingdom, 13 square feet per capita in Canada, and 6.5 square feet per capita in Australia. If the experience of these countries is any indication, it’s a good bet that there’s lots there’s still lots of room for downsizing in the U.S. retail sector. However, despite these trends, Miami apparently isn’t concerned.

How much could US retail shrink? And where?

The first quarter of 2017 has marked a parade of announced store closures. The long awaited axe has fallen on 68 more Macy’s stores around the country. J.C. Penney has announced it will close another 138 stores. Other major national retail chains, including The Limited, Gap, Walgreens, Aeropostale and Chico’s, have also announced similarly large closures.  These are just the latest moves in a shifting, mostly shrinking retail landscape in the United States.

One retailer, Target is not just downsizing its store count, it’s shifting to smaller urban stores–Target Express. Other retailers like Walmart and Office Depot have have also been developing smaller stores. The days of big boxes and power centers seem to be giving way to to more urban-centered and smaller-footprint retailing, undermining the economics of larger-scale retailing. It’s estimated that there are over 1,200 dead or dying malls in the U.S. It appears that we’re way overbuilt for retail space. Finding productive uses for these disused spaces is now a major undertaking for communities around the nation.

Several factors seem to be driving the tectonic shifts in retailing. Part of the problem is that retail, like housing,was overbuilt during the bubble: commercial developers typically followed new housing development, and as the housing stock sprawled in the last decade, so too did the expansion of retail space.

Another important factor is the technological change in the form of growing e-commerce. More and more, we’re purchasing goods and services via the Internet and mobile devices. Census Bureau data on retail sales show that e-commerce continues to increase its market share.  Excluding restaurant sales, and sales of vehicles and gasoline, e-commerce now accounts for about 12 percent of all retailing, a figure that has effectively doubled in the past six years.

There’s a bit of irony to the technological displacement at work here: big box stores only became economically feasible thanks to earlier technologies, like universal product codes, computerized inventory management, real-time ordering, and global data networks. These same technologies now help enable smaller stores (tailoring inventory to localized demand) and empower consumers to order online at home and via pervasive mobile devices.

The shifting retail environment will have impacts on the transportation system as well. The latest transportation data show a decline in the number and length of shopping trips (which decreases transport intensity of retailing), but this is at least partially offset by more travel by commercial delivery vehicles (like UPS and Fedex). It’s an open question as to how this will play out: will these shifts encourage (more) fleets of smaller transit trucks, or will increasing e-commerce retail sales and smaller urban stores mean larger trucks on urban roads? There’s some evidence that Internet delivery will mean less car travel, as the decline in shopping travel will more than offset the increased vehicle travel associated with deliveries. And delivery efficiency actually increases as volumes increase.

To judge who’s most likely to be affected by these trends, we compiled some metropolitan level data on the amount of retail space per capita. The data come from Co-Star, a private firm that tracks retail space leasing throughout the nation. (They helpfully make their market reports available here). These data are for 2007 and we’ve computed retail space per capita in each market by dividing total square footage by each metropolitan area’s 2007 population.

The national average is about 46 square feet of retail space per capita, with most metropolitan areas having between 40 and 55 square feet per capita. There are a number of outliers, however.

Milwaukee/Madison has the highest amount of retail space per capita, and many southern, sprawled metros rank higher on this metric as well. These are the places most likely to struggle with a dwindling appetite for retail space, and the economic consequences that follow, be it in fewer retail jobs, large swathes of unused space, or transportation costs. At the other end of the spectrum, some metropolitan areas have far more space-efficient retailing: Portland has just 30 square feet of retail space per capita, fully one-third less than the national average.

By global standards, the U.S. has much more space devoted to retailing than anyone else: comparable estimates for other countries include: 23 square feet per capita in the United Kingdom, 13 square feet per capita in Canada, and 6.5 square feet per capita in Australia. If the experience of these countries is any indication, it’s a good bet that there’s lots there’s still lots of room for downsizing in the U.S. retail sector. However, despite these trends, Miami apparently isn’t concerned.

What does it mean to be a “Smart City?”

Cities are organisms, not machines; So a smart city has to learn and not be engineered

The growing appreciation of the importance of cities, especially by leaders in business and science, is much appreciated and long overdue.  Many have embraced the Smart City banner.  But it seems each observer defines “city” in the image of their own profession.  CEOs of IT firms say that cities are “a system of systems” and visualize the city as an increasing and dense flow of information to be optimized.  Physicists have modeled cities and observed relationships between city scale and activity, treating city residents as atoms and describing cities as conforming to “laws.”

In part, these metaphors reflect reality.  In their function, cities have information flows and physical systems.  However, it is something more than its information flows and physical systems, and its citizens need to be viewed as something other than mindless atoms.

The prescriptions that flow from partial and incomplete metaphors for understanding cities can lead us in the wrong direction if we are not careful.  The painful lessons of seven decades of highway building in U.S. cities is a case in point.  Epitomized by the master builder, Robert Moses, we took an engineering view of cities, one in which we needed to optimize our cities to facilitate the flow of automobiles.  The massive investments in freeways (and the re-writing of laws and culture on the use of the right of way) in a narrow way made cities safe for much greater and faster travel–but at the same time they produced massive sprawl, decentralization and longer journeys, and eviscerated many previously robust city neighborhoods.

If we’re really to understand and appreciate cities, especially smart cities, our focus has to be elsewhere:  it has to be on people. We take the Jane Jacobs view: Cities are about people, and particularly about the way they bring people together.  We are a social species, and cities serve to create the physical venues for interaction that generate innovation, art, culture, and economic activity.

What does it mean for a city to be smart?

The most fundamental way a city can be smart is to have highly skilled, well-educated residents.  We know that this matters decisively for city success.  We can explain fully 60% of the variation of economic performance across large U.S. metropolitan areas by knowing what fraction of the adult population has attained a four-year college degree.  There’s strong evidence that the positive effects of greater education are  social–it spills over to all residents, regardless of their individual education.

Educational attainment is a powerful proxy measure of city economic success because having a smart population and workforce is essential to generating the new ideas that cause people and businesses to prosper.

So building a smart city isn’t really about using technology to optimize the efficiency of the city’s physical sub-systems.  There’s no evidence that the relative efficiency of water delivery, power supply, or transportation across cities has anywhere near as strong an effect on their success over time as does education.

It is in this process of creating new ideas that cities excel.  They are R&D facilities and incubators, and not just of new businesses, but of art, music, culture, fashion trends, and all manner of social activity.  In the process Jane Jacobs so compelling described, by juxtaposing diverse people in close proximity, cities produce the serendipitous interactions that generate what she called new work.

We don’t have an exacting recipe for how this happens.  But we do know some of the elements that are essential.  They include density, diversity, design, discovery and democracy.

Density. The concentration of people in a particular place.  Cities, as Ed Glaeser puts it, are the absence of space between people.  The less space, the more people, and the greater the opportunities for interaction.  Cities are not formless blobs; what happens in the center–the nucleus–matters, because it is the place that provides key elements of identity and structure and connection for the remainder of the metropolitan area it anchors.

Diversity. The range of different types of people in a place.  We have abundant evidence that the diversity of the population– by age, race, national origin, political outlook,and other qualities– helps provide a fertile ground for combining and recombining ideas in novel ways.

Design.  We are becoming increasingly aware that how we populate and arrange the physical character of cities matters greatly.  The arrangement and aesthetic of buildings, public spaces, streetscapes and neighborhoods matters profoundly for whether people embrace cities or abandon them.  We have a growing appreciation for urban spaces that provide interesting variety and are oriented to walking and “hanging out.”

Discovery.  Cities are not machines; citizens are not atoms.  The city is an evolving organism, that is at once host to, and is constantly being reinvented by, its citizen inhabitants.  A part of the attraction of cities is their ability to inspire, incubate, and adapt to change.  Cities that work well stimulate the creativity of their inhabitants, and also present them all with new opportunities to learn, discover, and improve.

Democracy.  The “mayor as CEO” is a tantalizing analogy for both mayors and CEOs; CEOs are used to wielding unitary, executive authority over their organizations; many mayors wish they could do the same.  But cities are ultimately very decentralized, small “d” democratic entities.  Decision-making is highly devolved, and the opportunities for top-down implementation are typically limited.  Citizens have voice (through voting) and the opportunity to “exit” by moving, appropriately limiting unilateral edicts.  Cities also give rise to new ideas, and when they work well, city political systems are permeable to the changing needs and values of their citizens– this is when many important changes bubble up.

All of these attributes of cities are susceptible, at least in part to analysis or description using the constructs of “information flows” or “systems of systems.”  They may be augmented and improved by better or more widespread information technology. But it would be a mistake to assume that any of them are capable of being fully captured in these terms, no matter how tempting or familiar the analogy.

Ultimately, when we talk about smart cities, we should keep firmly in mind that they are fundamentally about people; they are about smart people, and creating the opportunity for people to interact.  If we continuously validate our plans against this key observation, we can do much to make cities smarter, and help them address important national and global challenges.

“Smart Cities” have to be about much more than technology

A framework for thinking about smart cities

Cities are organisms, not machines

The growing appreciation of the importance of cities, especially by leaders in business and science, is much appreciated and long overdue.  Many have embraced the Smart City banner. But it seems each observer defines “city” in the image of their own profession.  CEOs of IT firms say that cities are “a system of systems” and visualize the city as an increasing and dense flow of information to be optimized.  Physicists have modeled cities and observed relationships between city scale and activity, treating city residents as atoms and describing cities as conforming to “laws.”

In part, these metaphors reflect reality.  In their function, cities have information flows and physical systems.  However, it is something more than its information flows and physical systems, and its citizens need to be viewed as something other than mindless atoms.

The prescriptions that flow from partial and incomplete metaphors for understanding cities can lead us in the wrong direction if we are not careful.  The painful lessons of seven decades of highway building in U.S. cities is a case in point.  Epitomized by the master builder, Robert Moses, we took an engineering view of cities, one in which we needed to optimize our cities to facilitate the flow of automobiles.  The massive investments in freeways (and the re-writing of laws and culture on the use of the right of way) in a narrow way made cities safe for much greater and faster travel–but at the same time they produced massive sprawl, decentralization and longer journeys, and eviscerated many previously robust city neighborhoods.

If we’re really to understand and appreciate cities, especially smart cities, our focus has to be elsewhere:  it has to be on people. We take the Jane Jacobs view: Cities are about people, and particularly about the way they bring people together.  We are a social species, and cities serve to create the physical venues for interaction that generate innovation, art, culture, and economic activity.

Technology shouldn’t be just about optimizing the status quo

So building a smart city isn’t really about using technology to optimize the efficiency of the city’s physical sub-systems.  There’s no evidence that the relative efficiency of water delivery, power supply, or transportation across cities has anywhere near as strong an effect on their success over time as does education.

The big gains from technology come not from marginal improvements to existing organizational arrangements, but to the ability to create entirely new arrangements that create new value and opportunities to do different things in entirely different and better ways. When information technology was first introduced into the office, it was envisaged as primarily a way to “automate the typing pool”–improving the efficiency of a small army of women who did all the typing.  What it turned out to be was a way to dramatically reorganize corporate and managerial activity, and led to successive generations of entrepreneurship that have transformed economic activity and cities.

We can be blinded by big data

Much of the smart city discussion is highly technocratic:  If we just had perfect, detailed, real time information on say, traffic demand, we could optimize the function of our existing systems. The trouble with this is that in reality, the data that we have is always only partial, and importantly, has a strong status quo bias.  Take transportation data for example, it reveals a pattern of behavior that has emerged in response to the current pattern of land use and highway infrastructure.

We have copious data about automobile travel, and that avalanche of data effectively dominates thinking about transportation. We don’t measure whole categories of activity, like walking and cycling, and so they are invisible in policy discussions. More importantly, a vast treasure trove of data about existing travel patterns doesn’t tell us anything about what kind of places we might aspire to build.

This isn’t simply a matter of somehow instrumenting bike riders and pedestrians with GPS and communication devices so they are as tech-enabled as vehicles. An exacting count of existing patterns of activity will only further enshrine a status quo where cars are dominant. For example, perfectly instrumented count of pedestrians, bicycles, cars in Houston would show—correctly—little to no bike or pedestrian activity. And no amount of calculation of vehicle flows will reveal whether a city is providing a high quality of life for its residents, much less meeting their desires for the kinds of places they really want to live in.

Unintended consequences

As our experience with the private automobile shows, the advent of a new technology can have powerful unintended consequences. As with previous advances in transportation technology, the car generated a vast decentralization of population and economic activity–and this new pattern of suburban sprawl made us vastly more dependent on cars for transportation, and have been a principal contributor to air pollution and global warming. The consequences for cities have been devastating. For example, as Nathan Baum-Snow has illustrated, each additional radial freeway built to facilitate car travel reduced a city’s population by 18 percent.

Prices matter

While technology is important, new technologies are deployed and paid for in specific ways that materially affect how their impacts. A key reason for the dominance of the automobile in US cities is a series of public policy decisions that have subsidized the car and insulated car users from the economic, social and environmental costs that they create. We’ve provided very extensive freeway systems, and don’t charge users directly for their use. Our failure to price peak hour road use is the direct cause of recurring traffic congestion in US cities. We mandate that new housing and businesses build parking as a condition of development. Cars pay little or nothing toward offsetting the damage they do to the atmosphere.

If we project the existing system of financing and pricing forward with new technologies, we’re likely to only worsen many of the problems we face.  Cheap autonomous vehicles could further flood the nation’s already crowded transportation infrastructure. But technological inflection points are good opportunities to revisit financial and institutional arrangements.  Its worth recalling that the gas tax was invented a little over a century ago as a way to pay for roads:  in the horse and buggy era, we didn’t pay for roads with a tax on hay.  The advent of robust communication and geolocation systems for cars, coupled with the growing consumer familiarity with per trip and per mile pricing, illustrate the ways in which we could change

Ultimately, when we talk about smart cities, we should keep firmly in mind that they are fundamentally about people; they are about smart people, and creating the opportunity for people to interact.  If we continuously validate our plans against this key observation, we can do much to make cities smarter, and help them address important national and global challenges.

Lost in Place

Lost in Place: Why the persistence and spread of concentrated poverty–not gentrification–is our biggest urban challenge.

A close look at population change in our poorest urban neighborhoods over the past four decades shows that the concentration of poverty is growing and that gentrification is rare.

While media attention often focuses on those few places that are witnessing a transformation, there are two more potent and less mentioned storylines. The first is the persistence of chronic poverty. Three-quarters of 1970 high-poverty urban neighborhoods in the U.S. are still poor today. The second is the spread of concentrated poverty: three times as many urban neighborhoods have poverty rates exceeding 30 percent as was true in 1970 and the number of poor people living in these neighborhoods has doubled.

The result of these trends is that the poor in the nation’s metropolitan areas are increasingly segregated into neighborhoods of concentrated poverty. In 1970, 28 percent of the urban poor lived in a neighborhood with a poverty rate of 30 percent or more; by 2010, 39 percent of the urban poor lived in such high-poverty neighborhoods. The data, methodology and results of our study are spelled out in our full report, available in PDF format here. The highlights are as follows:

  • High poverty is highly persistent. Of the 1,100 urban census tracts with high poverty in 1970, 750 still had poverty rates double that of the national average four decades later.
  • Though poverty persisted, these high-poverty neighborhoods were not stable—in the aggregate they lost population, with chronic high-poverty neighborhoods losing 40 percent of their population over four decades.
  • Moreover, few high-poverty neighborhoods saw significant reductions in poverty. Between 1970 and 2010, only about 100 of the 1,100 high-poverty urban neighborhoods experienced a reduction in poverty rates to below the national average. These 100 formerly high-poverty census tracts accounted for about five percent of the 1970 high-poverty neighborhood population. In contrast to chronically high-poverty neighborhoods, which lost population, these “rebounding” neighborhoods recorded an aggregate 30 percent increase in population.
  • Urban high-poverty neighborhoods proliferated between 1970 and 2010. The number of high-poverty neighborhoods in the core of metropolitan areas has tripled and their population has doubled in the past four decades. A majority of the increase in high-poverty neighborhoods has been accounted for by “fallen stars”—places that in 1970 had poverty rates below 15 percent, but which today have poverty rates in excess of 30 percent.
  • The growth in the number of poor persons living in “fallen star” neighborhoods dwarfs the decrease in the poverty population in “rebounding” neighborhoods. Since 1970, the poor population in rebounding neighborhoods fell by 67,000 while the number of poor persons living in fallen star neighborhoods increased by 1.25 million.
  • The data presented here suggest an “up or out” dynamic for high-poverty areas. A few places have gentrified, experienced a reduction in poverty, and generated net population growth. But those areas that don’t rebound don’t remain stable: they deteriorate, lose population, and overwhelmingly remain high-poverty neighborhoods. Meanwhile, we are continually creating new high-poverty neighborhoods.

To be poor anywhere is difficult enough, but a growing body of evidence shows the negative effects of poverty are amplified for those who live in high-poverty neighborhoods—places where 30 percent or more of the population live below the poverty line. Quality of life is worse, crime is higher, public services are weaker, and economic opportunity more distant in concentrated poverty neighborhoods. Critically, concentrated poverty figures prominently in the inter-generational transmission of inequality: children growing up in neighborhoods of concentrated poverty have permanently impaired economic prospects.

Our analysis focuses on the 51 largest US metropolitan areas–all those with a population of 1 million or more in the latest Census. The following tables summarize, by metro area, the key variables in our research–the number of high poverty neighborhoods in 1970 and 2010, and the numbers of neighborhoods transitioning between various categories over time.

Listen to the author speak about the report on Think Out Loud, Oregon Public Broadcasting, December 9, 2014:

The Strong Towns Podcast also had the author on to speak about the report.


For people interested in tracking the performance of a single metropolitan area across all of our measures of concentrated poverty, we offer a Metro-level dashboard. You can select an individual metropolitan area and see how it performs on each of our indicators.

Finally, you can drill down to the level of individual census tracts to examine population change, and the change in the number of persons living in poverty in each metropolitan area covered in our report. (See the full-sized version here)

You can also see the findings in this easy-to-share infographic:

Click for full infographic.

America’s Most Diverse Mixed Income Neighborhoods

In a nation increasingly divided by race and economic status, where our life prospects are increasingly de ned by the wealth of our zip codes, some American neighborhoods are bucking the trend.

These neighborhoods—which we call America’s most diverse, mixed-income neighborhoods—have high levels of racial, ethnic and income diversity. This report identifies, maps and counts the nation’s most diverse mixed-income neighborhoods. In these neighborhoods, residents are much more likely than the average American to have neighbors from different racial/ethnic groups than themselves, and neighbors with different levels of income. We find that:

  • Nearly 7 million Americans live in neighborhoods with both high levels of racial/ethnic and economic diversity.
  • Roughly half of these neighborhoods are found in three of the nation’s largest, most diverse metropolitan areas: New York, Los Angeles and San Francisco.
  • Most large metropolitan areas have several neighborhoods that are among the nation’s most diverse and mixed income. Forty-four of the nation’s 52 largest metro areas have at least one diverse, mixed-income neighborhood.
  • The racial and ethnic diversity of a metropolitan area sets the context for having diverse, mixed income neighborhoods. Whether metropolitan diversity is reflected in the lived experience in the typical neighborhood depends on how segregated a metropolitan area is by race, ethnicity and class.
  • Some metropolitan areas come much closer to realizing their potential for neighborhood racial/ethnic diversity, given their metropolitan demographic composition.

We identified the nation’s most diverse, mixed income neighborhoods using Census data on the race, ethnicity and household income of neighborhood residents. For each of more than 31,000 urban neighborhoods, we computed a Racial and Ethnic Diversity Index (REDI), which corresponds to the probability that any two randomly selected individuals in a neighborhood would be from different racial/ethnic categories. (Using Census data, we tabulated the number of white, black, Asian, Latino and all other persons in each neighborhood). We used a similar approach to compute an Income Diversity Index (IDI) which measures the variety of household incomes. Neighborhoods that ranked in the top 20 percent of all urban neighborhoods nationally on both of these measures were classified as diverse mixed income neighborhoods.

Which cities have the highest levels of diversity and mixed income?

Nearly all of the nation’s largest cities have at least one neighborhood that meets our definition as being both racially and ethnically diverse and mixed income. Three large cities–New York, Los Angeles and San Francisco account for nearly half such neighborhoods, but some smaller cities also rank high in the fraction of their population living in these diverse, mixed income neighborhoods.

Which cities are performing up to their potential?

Whether a city has many diverse, mixed income neighborhoods depends directly on the demographics of the metropolitan area in which it is located. There is still a wide range of racial and ethnic diversity among metropolitan areas. The following chart shows the relationship between a metropolitan area’s overall racial and ethnic diversity (shown on the horizontal axis) and the percentage of that region’s population that lives in diverse, mixed income neighborhoods. More diverse metros generally have a larger share of their population living in diverse, mixed income neighborhoods. The regression line shows the typical relationship between metro diversity and the share of population living in diverse, mixed income neighborhoods. Cities above that line are performing better, on average, than one would expect based on their diversity; cities below that line are performing less well.

Some cities do a better job of realizing their diversity at a neighborhood level, than others. For each large metropolitan area we’ve computed the racial and ethnic diversity of the median neighborhood–reflecting lived experience of the typical resident. We’ve then compared that with the racial and ethnic diversity of the metropolitan area to see how closely the experience of the typical neighborhood resident comes to matching the diversity of the metropolitan area in which they live. Cities at the top of the list have neighborhood diversity that closely resembles metro diversity; those at the bottom are much more segregated, and don’t experience at the neighborhood level much of the diversity of their region.

Where are the most diverse, mixed income neighborhoods?

We’ve mapped the locations of the most racially and ethnically diverse and most mixed income neighborhoods in each of the nation’s 52 largest metropolitan areas. The map for San Francisco–one of the higher ranking metro areas–shows strong concentrations of diverse, mixed income neighborhoods in the City of San Francisco and the East Bay.

Detailed maps of the location of diverse, mixed income neighborhoods for each of the nation’s 52 largest metropolitan areas are available here. These on-line maps enable you to see the patterns of diversity in each metro area, and drill-down to the census tract level to inspect data for individual neighborhoods.

Why integration matters

A growing body of social science research confirms the importance of diversity to economic success. Greater socioeconomic mixing is facilitated in neighborhoods that re ect America’s racial and ethnic diversity, and which offer housing that is affordable to people with a range of incomes. In a series of studies led by Stanford’s Raj Chetty and his colleagues at the Equality of Opportunity Project, racial and economic segregation have been shown to reduce intergenerational economic mobility (the probability that children of low income families will, as adults, earn higher incomes than their parents). A recent post at City Observatory presents a synopsis of the literature on this subject, with citations to key works.

For a long time, we’ve known that neighborhoods of concentrated poverty are toxic to the life prospects of children who grow up there. Rothwell and Massey have shown that your neighbors’ educational attainment is nearly half as large as your parents’ educational attainment in shaping your life prospects. Living in a neighborhood with greater diversity and a mix of incomes generally means that families enjoy better-resourced public services and civic assets (including schools, parks and libraries) and develop stronger, more diverse social networks. Diverse, mixed-income neighborhoods are a platform for helping kids from lower-income families to escape poverty and realize the American dream.

Want to know more?

We’ve laid out our data, methodology and more detailed findings on our analyses of racial and ethnic diversity, and of income diversity in our technical report “Identifying America’s Most Diverse Inclusive Neighborhoods.”

Is life really better in Red States (and cities)?

The red state/blue state divide is a persistent feature of American politics. Political differences among states are also associated with important economic differences, and a similar patterns hold across and within metro areas. Big cities are more likely to be blue, and smaller towns and rural areas are red. The more densely populated portions of every metro area are also more likely to be blue. Understanding and eventually bridging these fissures is a major challenge for the nation.

In an article in last week’s New York Times, urbanist Richard Florida seems to have, if perhaps only inadvertently, given aid and comfort to the persistent myth that people are somehow worse off in big cities compared with smaller towns and suburbs.

It could be that this impression is amplified by the headline writer’s provocative question: “Is life better in America’s Red States?” While he doesn’t directly answer this question, Florida seems to imply that because housing is on average cheaper in red states, people who live there must be better off.

But is it the case that cheap housing is a reliable marker of economic well-being?

While it’s true that average home prices are higher in blue states, it’s important to consider why that is, and what it signifies. First and most importantly, blue state housing prices are driven higher because incomes and economic productivity are higher in bluer states and bluer cities. GDP per capita tends to be higher in metro areas that favored President Obama’s re-election by the widest margin, as shown here:


Note: if you hover over the orange trend line, you will see that the p-value is low and significant at the 1% threshold. (The p-value measures the statistical likelihood that the relationship between vote margin and productivity –measured by GDP per capita–is different from zero).  It measures correlation and tells us nothing about causality.    You can see the now familiar red-blue pattern on the attached map; the size of circles for each city corresponds to GDP per capita:  

The question then is, are higher housing prices in blue places an indication that the standard of living is lower?

Focusing on dollars per square foot misses the important fact that, unlike our stone age ancestors, we don’t rely on shelter solely as a means of warding off the cold, dark and wild beasts. We don’t value houses just as boxes—location matters. The reason the price of a square foot of land in Manhattan is worth as much as an acre of farmland in North Dakota has everything to do with the access it provides to a range of services, experiences and goods.

To an economist, if people are willing to pay a higher price for something—like housing in Manhattan or San Francisco or Honolulu—it’s a good indication that it has a higher value. A big part of the reason housing prices are higher in bigger cities than small ones is that we value the personal and economic opportunities that come from being close to lots of other people. As University of Chicago economist and Nobel Laureate Robert Lucas famously put it: “What can people be paying Manhattan or downtown Chicago rents for, if not being near other people?”

Harvard’s Ed Glaeser, author of Triumph of the City, has explored this theme in great depth. Increasingly, he argues, the biggest driver of city growth is the consumption advantages of living in cities, with close proximity to a wide range of goods, services, experiences, social interactions and cultural activities. This “consumer city” theory means that cities increase the well-being of their residents by facilitating all kinds of consumption. Indeed there are whole categories of goods, and especially services that are simply unavailable at any price outside major cities: think of everything from diverse ethnic restaurants to specialized medical care to cutting edge live art and music.

Provocative new work by Jessie Handbury shows once you adjust for the variety and quality of goods available in different places, the cost of living in big cities is actually lower than smaller cities. Her work looks at variations in the price and availability of food. It’s almost certain that differences in services are even more skewed in favor of city residents.

Moreover, looking just at differences in housing costs ignores important city advantages of density, proximity and convenience. Higher rents invariably provide city residents with better physical access to jobs, shopping, culture and social interaction. As Scott Bernstein and his colleagues at the Center for Neighborhood Technology have shown, savings in transportation costs in cities largely, and in some cases fully, offset differences in rents.

People who live in blue cities drive much less on average than those who live in red cities, and the savings in time and expense are substantial. My own work shows that residents of blue Portland Oregon drive about 20 percent less than in other large metro areas, saving them more than a billion dollars a year in transportation costs.

Florida makes one point that we all ought to pay attention to: as a nation we’d be much better off if we created more opportunities for people to live and work in blue cities. Because residents in big blue cities are so much more productive than otherwise identical workers in smaller red cities, we take a substantial hit to national economic productivity and growth. Enrico Moretti estimates GDP would be 13 percent or so higher if it weren’t for constrained population growth in these highly productive cities.

There’s an old adage that claims than an economist is someone who knows the price of everything and the value of nothing. Assuming that difference in house prices per square foot across metropolitan areas accurately reflects cost of living differences is arguably wrong. Cheap houses entail high costs for other things—like transportation—and to believe cheap houses automatically equals better quality of life misses the huge and tangible differences in the price and availability of a whole range of goods, services and experiences that make life nicer.

The political message here ought to be the high prices for blue cities generally, and the growing market premium for housing in dense, urban neighborhoods particularly, is a signal that Americans want more cities, and more opportunities for urban living. It’s a fair criticism of blue cities to say that they haven’t done a good enough job of making it possible for more people to live there—and this has a lot to do with local land use planning. But it has also been amplified by decades of federal subsidies to sprawling low-density development.

One final addendum on Richard Florida’s political analysis: as troubling as the persistent red/blue divide is among states and cities, it’s probably wrong to attribute the 2014 election results to this dichotomy. The huge fall off in turnout, especially among younger voters compared to 2012, is clearly the big driver of November’s red tide. Not only was 2014 the lowest off-year election turnout—only 37 percent—in six decades, but the electorate skewed far older in 2014 than in 2012. Voters over 65 made up 22 percent of voters in 2014, up from 16 percent in 2012; voters under 30 made up 13 percent of the electorate down from 19 percent in 2012. The 2014 red surge wasn’t so much geographic as it was demographic.

How Should Portland Pay for Streets?

For the past several months, Portland’s City Council has been wrestling with various proposals to raise additional funds to pay for maintaining and improving city streets. After considering a range of ideas, including fees on households and businesses, a progressive income tax, and a kind of Rube Goldberg income tax pro-rated to average gasoline consumption, the council has apparently thrown up its hands on designing its own solution.

The plan now is for the street fee solution to be laid at the feet of Portland voters in the form of a civic multiple choice test: Do you want to pay for streets with a monthly household street fee, a higher gas tax, a property tax, an income tax or something else entirely?

Given voter antipathy of taxes of any kind, it’s likely that “none of the above” would win in a landslide if it’s included as an option on the ballot (not likely).

All of these options have their own merits and problems, and it’s doubtful that there is a majority consensus for any one of them. How, how much, and who pays for streets is a key issue for every city. From an urbanist and public finance perspective, and as a guide to thinking about which—if any—of these approaches Portland should adopt, here are my eight suggested rules for paying for streets:

1. Don’t tax houses to subsidize cars. Despite mythology to the contrary, cars don’t come close to paying for the cost of the transportation system. The Tax Foundation estimates that only 30% of the cost of roads is covered by user fees like the gas tax. Not only do cars get a free ride when it comes to covering the cost of public services—unlike homes, they’re exempt from the property tax—but we tax houses and businesses to pay for car-related costs. Here are three quick examples: While half of storm runoff is from streets, driveways and parking lots, cars aren’t charged anything for stormwater—but houses are. A big share of the fire department’s calls involve responding to car crashes—and cars pay nothing toward fire department costs. Similarly, the police department spends a significant amount of its energy enforcing traffic laws—this cost is borne largely by property taxes—which houses pay, but cars don’t. If we need more money for streets, it ought to be charged on cars.

Adding a further charge on houses to subsidize car travel only worsens a situation  in which those who don’t own cars subsidize those who do. One in seven Portland households doesn’t own a car, and because they generally have lower incomes than car owners, fees tied to housing redistribute income from the poor to the rich.

2. End socialism for private car storage in the public right of way. Except for downtown and a few close-in neighborhoods, we allow cars to convert public property to private use for unlimited free car storage. Not asking those who use this public resource to contribute to the cost of its construction and upkeep makes no sense and ultimately subsidizes car ownership and driving. This subsidy makes traffic worse and unfortunately—but understandably—makes it harder and more expensive to build more housing in the city’s walkable, accessible neighborhoods. If, as parking expert Don Shoup has suggested, we asked those who use the streets for overnight car storage to pay for the privilege, we’d go a long way in reducing the city’s transportation budget shortfall—plus, we’d make the city more livable.  We should learn from the city’s success in reforming handicapped parking that getting the prices right makes the whole system work better.

3. Reward behavior that makes the transportation system work better for everyone. Paying for the transportation system isn’t just about raising revenue—it should be about providing strong incentives for people to live, work and travel in ways that make the transportation system work better and make the city more livable. Those who bike, walk, use transit, and who don’t own cars (or own fewer cars) actually make the street system work better for the people who do own and use cars. We ought to structure our user fee system to encourage these car-free modes of transportation, and provide a financial reward to those who drive less. The problem with a flat-household fee or an income tax is it provides no incentive for people to change their behavior in a way that creates benefits for everyone.

4. Prioritize maintenance. There’s a very strong argument that we shouldn’t let streets deteriorate to the point where they require costly replacement. Filling potholes and periodically re-surfacing existing streets to protect the huge investment we’ve already made should always be the top priority. Sadly, this kind of routine maintenance takes a back seat to politically sexier proposals to expand capacity. We need an ironclad “fix it first” philosophy. Also, we need to guard against “scope creep” in maintenance. There’s a tendency, once a “repair” project gets moving, to opt for the most expensive solution (see bridges: Sellwood, Columbia River Crossing). That’s great if your project gets funded, but a few gold-plated replacements drain money that could produce much more benefit if spread widely.  We need to insist on lean, cost-effective maintenance.

5. Don’t play “bait and switch” by bonding revenue to pay for shiny, big projects. There’s an unfortunate and growing tendency for those in the transportation world to play bait-and-switch with maintenance needs. They’ll tell us about the big maintenance backlog to justify tax and fee increases. Then they bond two or three decades worth of future revenue to pay for a shiny new project; the Sellwood Bridge and the local share of the Portland-Milwaukie light rail have been funded largely by tying up the increase in state gas tax revenue,vehicle registration fees, and flexible federal funds for the next two decades. The state, which routinely financed construction on a pay-as-you-go basis, has also maxed out its credit card: in 2002 ODOT spent less than 2% of its state revenue on debt service; today, it spends 35%. Now it is pleading poverty on highway maintenance. Politically, this makes a huge amount of sense.  You get to build the projects today, and pass the costs into the future. Unfortunately, in practice it leads to a few gold-plated projects now, while jeopardizing the financial viability of the transportation system in the long run.

6. Promote fairness through the “user pays” principle. We all want the system to be “fair.” In the case of general taxes, we often put a priority on progressivity—that taxes ought to be geared toward ability to pay. But for something like transportation (as with water rates, sewer rates, or parking meter charges), fairness is best achieved by tying the cost to the amount of use, or what economists call the “benefit principle.” Charges tied to use are fair for two important reasons: higher income people tend to use (in this case, drive) more than others, and therefore will end up paying more. Also, charges tied to use enable people to lower the amount they pay by changing their behavior.

7. Don’t buy the phony safety card. We’ll hear all about the need to spend money to make our streets safer. The safety argument is an all-purpose smokescreen to justify almost any expenditure, no matter how distantly related to safety. (Ostensibly, the $3.5 billion Columbia River Crossing project was justified as a “safety” project, even though the I-5 bridge had a lower crash rate than the Fremont Bridge). Here’s the key fact of street safety: Smaller, slower streets are safer. Metro’s region-wide analysis of crash data showed that fast-moving, multi-lane arterials are by far the most dangerous streets in the region for cars, cyclists, and pedestrians . The more we get people out of cars, the more crashes and injuries decline. The most effective thing we can do to improve safety turns out to be the cheapest: implement features that slow and calm traffic, and make walking, cycling, and transit more attractive.

Correction:  Commissioner Steve Novick points out correctly  that his proposal contains a specific list of laudable safety projects that he proposes undertaking with street fee proceeds if his proposal is adopted.  These projects don’t fall into the “phony safety” category outlined above.  My apologies if this commentary implied otherwise.  Still, voters should consider two other things.  First, while the proposed list is a good one, it is “preliminary and subject to change” and isn’t binding on future city commissions, and the “safety” category is an elastic one.  Safety projects are defined as those that “reduce the likelihood of a person being killed or injured and address the perception of risk.”  Second, transportation money is very fungible.  Its always possible to re-arrange the budget to tell someone that this “new” money is only being used for good purposes.   The larger question is the overall priorities for the entire transportation budget.  If safety spending out of current revenues is reduced, the net gain could be less than advertised.(Revised, 10.20 PM January 8).

8. Don’t write off the gas tax yet. There’s a widely repeated shibboleth that more fuel-efficient vehicles have made the gas tax obsolete. Despite its shortcomings as a revenue source—chiefly that it bears no relationship to the time of day or roadway that drivers use—there’s nothing wrong with the gas tax as a way to finance street maintenance that a higher tax rate wouldn’t solve. While other methods like a vehicle-miles-traveled fee make a lot of sense, the reason they’re popular with the transportation crowd is because they would be set high enough to raise more money. And there’s the rub: people are opposed to the gas tax not because of what is taxed, but because of how much they have to pay. As an incremental solution to our maintenance funding shortfall, there’s a lot to like about a higher gas tax: it requires no new administrative structure, it’s crudely proportionate to use, and it provides some incentives for better use of streets. So when very serious people gravely intone that the gas tax is “obsolete” or “politically impossible”—you should know what they’re really saying is that people simply don’t want to pay more for streets.

Transportation and urban livability are closely intertwined. Over the past few decades it has become apparent that building our cities to cater to the needs of car traffic have produced lower levels of livability. There are good reasons to believe that throwing more money at the existing system of building and operating streets will do little to make city life better. How we choose to pay for our street system can play an important role in shaping the future of our city. As Portlanders weigh the different proposals for a street fee in the coming months, they should keep that thought at the top of their minds.

How we build our cities: What’s at stake

Guest Commentary by Carol Coletta

It’s a glorious moment to be in the business of promoting the built environment. I use “built environment” to encompass the way we build our buildings, arrange our neighborhoods and public spaces, and interact with one another in place. We’re all consumers of place as individuals, and we are constantly aware of our surroundings. But there’s something bigger going on:

The evidence is mounting that the built environment is hugely important to the success of cities.

We should start by acknowledging this key fact: 64% of the most mobile people in our society – college-educated 25-34 year olds – say, first, they choose the city they want to live in, then they look for a job.

What this means is that quality of life is now more influential than having a job offer when people are deciding where to live. Livability seems to be the new competitive advantage.

Just to put a point on it: 25-34 college-educated year-olds make up the demographic all cities are fighting over.

Now, the built environment is not the whole of quality of life – for 25-34 year-olds or anybody else. But the built environment is a substantial part of how people value cities today.

Let me give you three powerful examples.

First: The growing strength of the center city. You can see evidence of it in cities everywhere.

Over the past four decades, there has been a steady increase in the relative preference of young adults (ages 25 to 34) for close-in neighborhoods – that’s the central business district in metropolitan areas and the 3-mile radius around it. In fact, college-educated young adults today are more than twice as likely to live in these close-in neighborhoods than are other Americans.

This is a 40-year trend that just keeps accelerating.

85% of millennials say they prefer urban-style living, and the numbers prove that they are acting on their preferences.

What is it about the built environment that makes the core city newly valuable to millennials? You know the profile: this part of the city is typically dense, walkable, bikeable, mixed use, mixed age, mixed-type building stock. These are the kinds of neighborhoods we forgot how to build for the past 50 years. Then all of a sudden, we woke up to a back to the future moment.

Now, jobs are following millennials (and increasingly boomers) to core cities. Companies like Google, Biogen, Coca Cola and Visa are moving their offices downtown to tap into the growing talent pool living in cities. It’s happening even in struggling cities like Detroit—where Quicken Loans is explicitly working to promote downtown revitalization.

It’s also true that since the recession, housing prices in America’s most walkable neighborhoods – the ones with higher WalkScores that have more daily destinations nearby — have recovered far more quickly than housing in neighborhoods where you have to drive to get to everything.

See the pattern here? These are no longer anecdotes. This is happening in cities all over the U.S.

The right built environment attracts and keeps mobile talent. The right built environment attracts jobs. And the right built environment adds real estate value.

But there are other ways the built environment Increases the value of cites.

Think about most neighborhoods in your community. They are probably like neighborhoods in Miami or in my hometown of Memphis. The rich live in enclaves, and poor people live in a different part of town. That’s the pattern in cities all over the U.S.

But new research is showing us how deadly that approach is to opportunity… specifically the opportunity to improve your economic status. It turns out that growing up poor in an economically segregated neighborhood significantly lowers the chance that you will improve your financial circumstances.

If zip code is destiny, then the American Dream is dead.

Having people of different incomes living in close proximity to one another and, in effect, sharing their lives in public as people in a community naturally do, results in far more upward mobility for people than does growing up in an economically segregated neighborhood.

Having a civic commons – libraries, parks, rec centers, and the like — that welcomes and delights people of different incomes augments and accelerates the advantages of economic integration. (This is not easy, by the way.)

Consider this: America is becoming ever more bifurcated by income – the rich are getting richer and there is more difference in the incomes earned by those with more and less education. People with less money and less education are getting stuck in place.

If the right built environment can help tackle that problem –delivering even a modicum of progress by bringing rich and poor people into closer physical proximity — that is significant, because today, we are going in the opposite direction.

The right built environment delivers more opportunity to Americans. That’s the second big value-add to cities.

There’s one more piece to the puzzle. The right built environment delivers the kind of engagement that actually moves cities forward.

You may know that Knight Foundation is built on the premise that informed and engaged communities are essential to strong democracies. And the sad fact about engagement is that we’re not doing a very good job of it in most of our communities.

How many of you have been to a public meeting lately?

How many of you enjoyed it? (Count the masochists.)

How many of you think it was a productive discussion about the future of your community?

Clearly, something is wrong here. I’ve run public meetings. I’ve participated in public meetings. I am on a public board that has publicly commented – twice – in each meeting. And it is mind numbing, right? There must be a better way.

Well, a few weeks ago, that better way revealed itself in a most unexpected way. I was interviewing the founders of modern day Portland – the people who became mayors, aides to mayors, state legislators, transit officials, and architects who led important citizen initiatives. They kept using the terms “civic involvement” and “citizen engagement”, and finally I stopped the conversation and asked, what do you mean specifically? What did that look like in Portland?

Their answer stopped me cold.

Here’s what they told me: “For too long, decisions about the future of Portland were made by a few people in the basement of a downtown hotel. We decided that we had to lure people out of the comfort of their living rooms and into public life so that they would engage in an ongoing conversation about the future of their city.”

That was their aim: Get Portlanders to live life in public.

To support that, they began changing policies to allow sidewalk cafes, music in parks, music in taverns, stop the building of expressways through neighborhoods… and you can see the result of that today in Portland: vibrant, compact neighborhoods demarcated by relatively narrow, slow through-streets filled with small commercial enterprises mixed with mid-rise housing.

It is so different from what you see in most American cities, and it all resulted from a desire to get and keep citizens engaged – continuously — in shaping the future of their city.

As the Portland experience shows, citizen engagement is not an event. It is not a process run by consultants. It’s a culture. It’s a constant. It is, crucially, an ongoing conversation about the future of the city. And the built environment, as Portland shows, either supports that kind of ongoing conversation by encouraging people to live life in public, or it discourages it. In fact, in too many places, the built environment actually makes such a conversation impossible.

So why are we surprised when the pitiful processes we create for “engagement” don’t work?

The good news is that we are building smarter and better today than we have in 50 years. The bad news is that we still get it wrong too often. When you get the built environment wrong, you have to live with your mistakes for a very long time.

So growing an engaged citizenry that understands what good design is, why it matters, and will advocate for it forcefully is urgent if we want our cities to be successful. We can’t win this one battle at a time. We can’t treat advocacy for good design as an event. We have to make it part of the culture – the “way we do things around here.” – the rule, not the exception… what we expect for our community.


Carol Coletta is Vice President and leads Community and National Initiatives for Knight Foundation.  You can follow her at @ccoletta.