Yesterday was, famously, cyber-Monday, the day in which the nation’s consumers took to their web-browsers and started clicking for holiday shopping in earnest. Tech Crunch reports that estimated e-commerce sales will yesterday were predicted at $3.36 billion, coming on top of almost $5 billion in on-line sales on Thanksgiving and Black Friday.
The steady growth of e-commerce has many people worrying that urban streets will be overwhelmed by UPS and Fedex delivery trucks ferrying cardboard boxes from warehouses to homes. The latest of these is an article published at Quartz: “Our Amazon addiction is clogging up our cities—and bikes might be the best solution.” Benjamin Reider notes–correctly–that UPS delivered some 14 billion packages this year, and asserts–without any actual data–that truck deliveries are responsible for growing urban traffic congestion.
While there’s no question that its really irritating when there’s a UPS truck doubled-parked in front of you–its actually the case that on-balance, on-line shopping reduces traffic congestion. The simple reason: On-line shopping reduces the number of car trips to stores. Shoppers who buy on line aren’t driving to stores, so more packages delivered by UPS and Fedex and the USPS mean fewer cars on the road to the mall and local stores. And here’s the bonus: this trend benefits from increased scale. The more packages these companies deliver, the greater their deliver density–meaning that they travel fewer miles per package. So if we look at the whole picture, shifting to e-commerce actually reduces congestion.
We’ve sifted through the data on urban truck transport and package delivery economics, and here are four key takeaways:
- Urban truck traffic is flat to declining, even as Internet commerce has exploded.
- More e-commerce will result in greater efficiency and less urban traffic as delivery density increases
- We likely are overbuilt for freight infrastructure in an e-commerce era
- Time-series data on urban freight movements suffer from series breaks that make long term trend comparisons unreliable.

Despite the rapid growth of e-commerce, truck traffic has actually been increasing. Last year, the Brookings Institution’s Adie Tomer performed a significant public service by assembling several decades of US DOT data on vehicle miles traveled. A significant weakness of US DOT’s website is that it mostly presents data a single year at a time, which makes it really difficult to observe and analyze trends in the data.
Tomer’s work plots the US DOT data on urban travel by passenger cars, unit-trucks, and combination trucks. He points to the growth of e-commerce, and the recent entry of Jet.com–which aims to be a challenger to Amazon’s dominance of web-based retailing. Tomer speculates that growing e-commerce will lead to more and more delivery trucks crowding urban streets.
He marshals several decades of data on urban truck VMT to claim that urban truck traffic is up an eye-popping 800 percent since 1966.
Another way to see trucking’s urban trajectory is to view aggregate growth since the 1960s. While urban vehicle miles traveled for both passenger cars and trucks grew steadily between 1966 and 1990—in both cases, far surpassing urban population growth—urban trucking absolutely exploded thereafter, reaching almost 800 percent growth until the Great Recession led to reduced demand. That pattern coincided almost perfectly with the rise of e-commerce and the use of digital communications to manage shipping for logistics firms like UPS and FedEx and major private shippers like Walmart.
The post concludes by warning us that we need to provide for additional infrastructure for urban freight movement.
With new companies like Jet and continued growth in stalwarts like Amazon, we should expect e-commerce and urban trucking to keep growing. Those patterns bring some significant implications at all levels of government.
On the transportation side, freight investment will need to be targeted at pinch points and bottlenecks. Those specific sites of congestion deliver disproportionate costs to shippers, which get passed along to consumers, and create supply chain uncertainty
But the problems of doing time series analysis with DOT’s VM-1 (vehicle miles traveled) data is not limited to the largely cosmetic problem of web-site layout. The more serious problem is the significant series breaks that underlie the published data. Over time, US DOT has had to make important changes to the way it defines urban and rural areas (as urban development has occurred) and has had to cope with changing data sources. And, to be sure, DOT has tried to improve the accuracy of its estimates over time. The cumulative result of these changes is that it is very difficult to make statistically valid statements about the change in truck traffic in cities. (We’ve spelled out our concerns about the series break in the freight data in a technical appendix, below).
Urban truck travel actually peaked in 2008, and has mostly been declining, except for the past year.
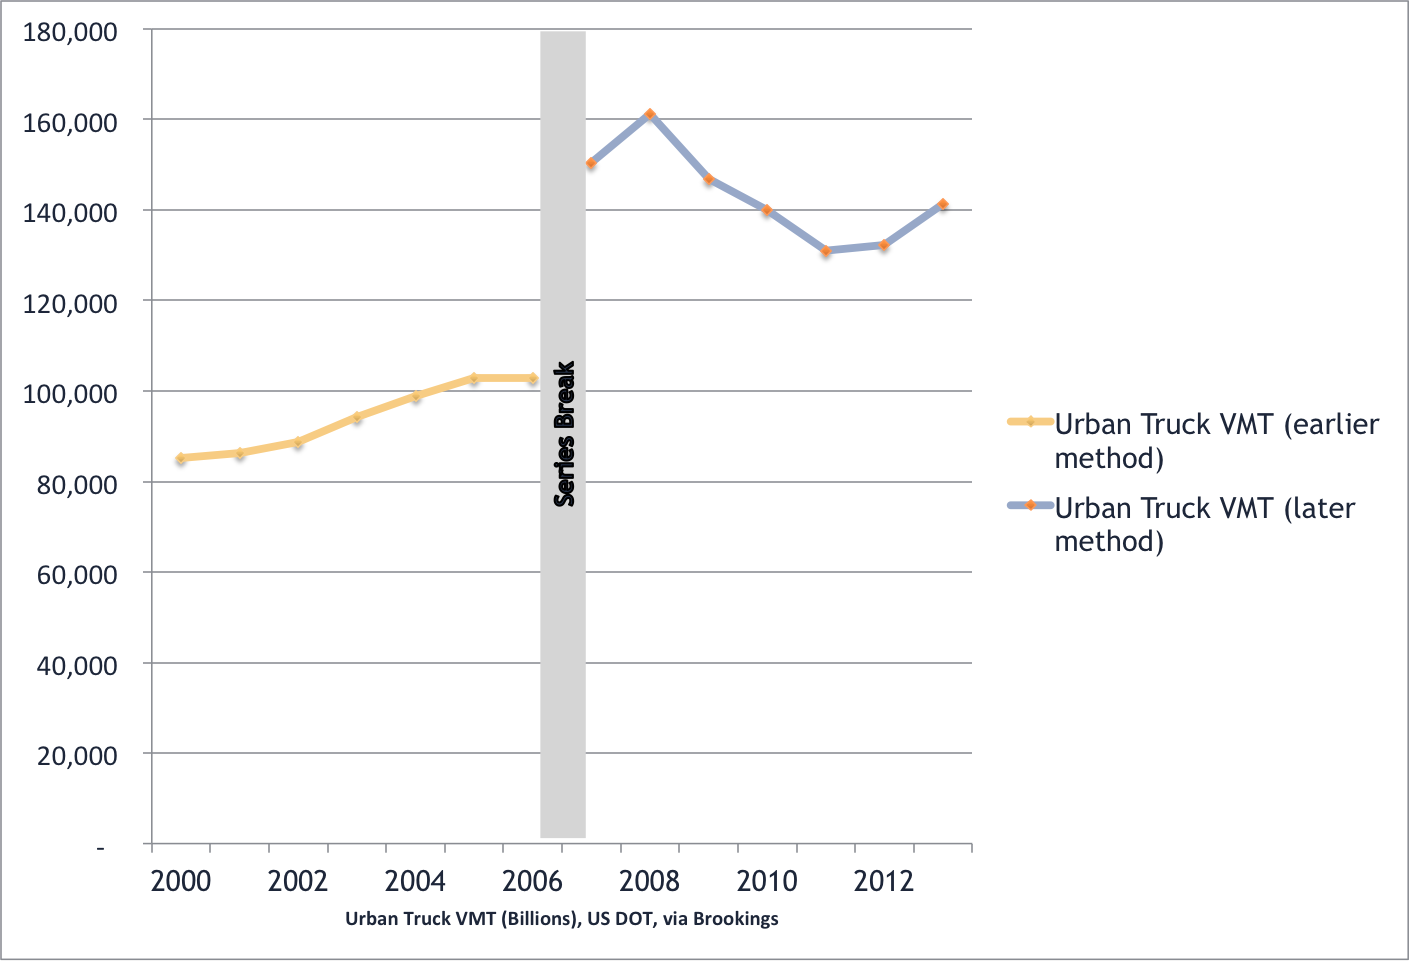
In our view, we ought to heavily discount the published data, and not make comparisons that assume that the pre-2006 data are comparable to the post 2006 data. If we look only at the post-2006 data, a very different picture emerges. For the past six years–a period for which we have apparently comparable estimates, which appear to be not significantly affected by re-definitions of urban and rural areas–there is little evidence that urban truck traffic is increasing. If anything, the data suggest that it is flat to decreasing.
The alarmist implication of the “800% growth” statistic is that urban traffic will be significantly worsened by growing e-commerce sales. For example, the Brookings data prompted bloggers at SSTI to write “Urban truck traffic has boomed alongside the rise in e-commerce. ” and to fret that “If the rapid growth in urban truck VMT is a result of increasing e-commerce deliveries, we are a long way from peak urban truck traffic.”
In our view, such fears are wildly overblown. If anything they have the relationship between urban traffic patterns and e-commerce exactly backwards. The evidence to date suggests that not only has the growth of e-commerce done nothing to fuel more urban truck trips, but on net, e-commerce coupled with package delivery is actually reducing total urban VMT, as it cuts into the number and length of shopping trips that people take in urban areas.
E-Commerce is increasing rapidly; Urban truck travel is flat
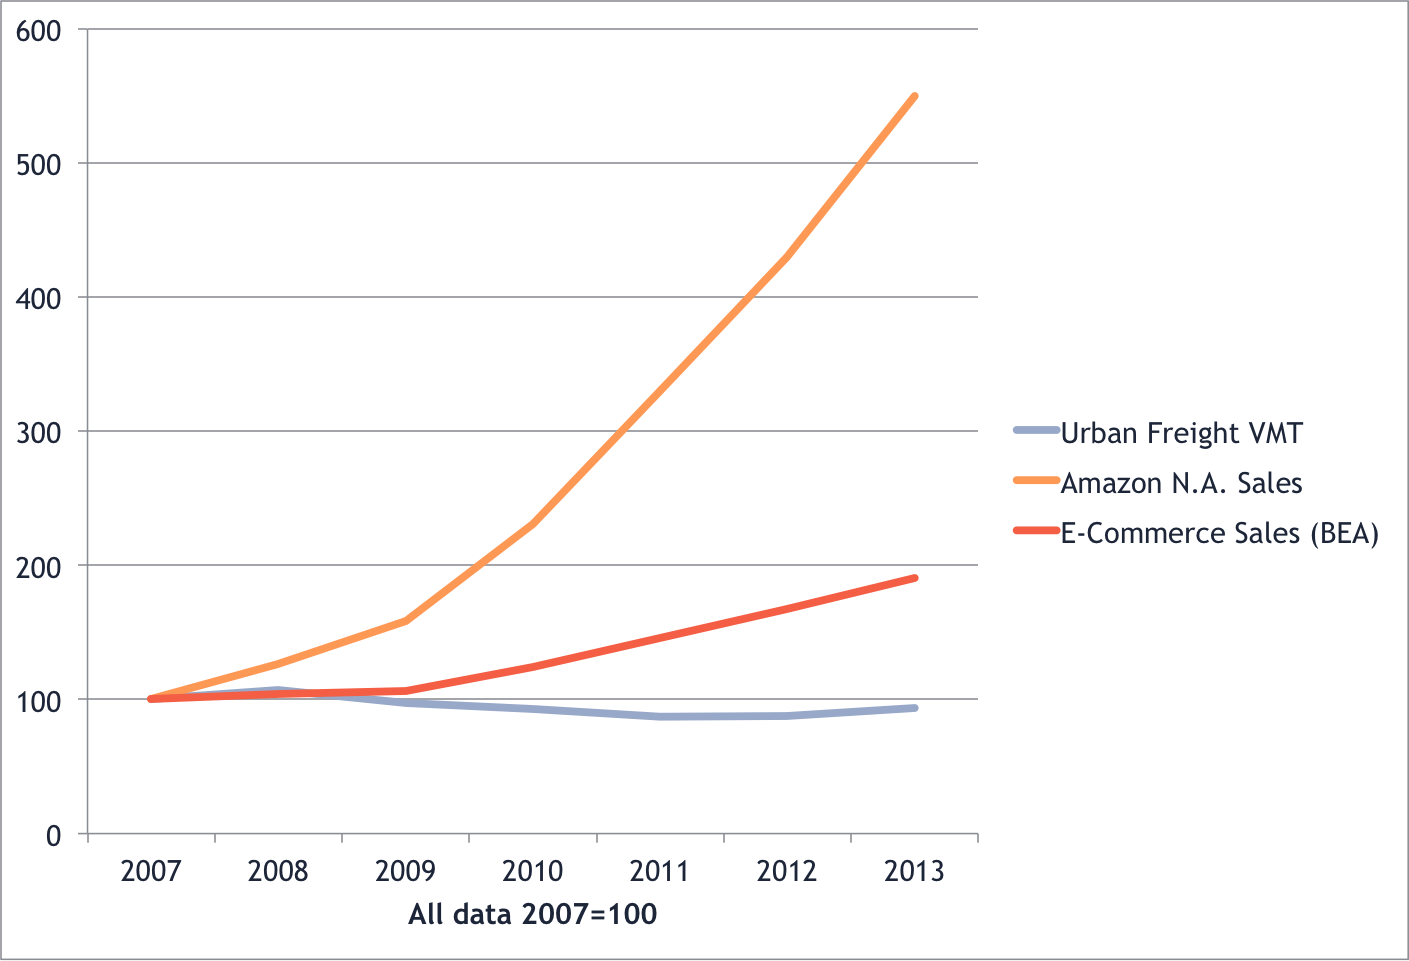
The period since 2007 coincides with the big increase in e-commerce in the U.S. From 2007 to 2013, Amazon‘s North American sales increased by a factor of 5, from $8 billion to$44 billion. Between 20007 and 2013, the total e-commerce revenues United States has doubled, from about $137 billion to about $261 billion according to the U.S. Department of Commerce. But over this same time period, according to the US DOT data as tabulated by Brookings, truck traffic in urban areas actually declined. All the increase in e-commerce appears to have no net effect on urban truck traffic.
Does an increase in package deliveries mean increased urban traffic?
It actually seems like that increased deliveries will reduce urban traffic congestion, for two reasons. First, in many cases, ordering on line substitutes for shopping trips. Customers who get goods delivered at home forego personal car shopping trips. And because the typical UPS delivery truck makes 120 or so deliveries a day, each delivery truck may be responsible for dozens of fewer car-based shopping trips. At least one study suggests that the shift to e-commerce may reduce total VMT and carbon emissions. And transportation scholars have noted a significant decrease in shopping trips and time spent shopping.
But there’s a second reason to welcome–and not fear–an expansion of e-commerce from a transportation perspective. The efficiency of urban trucks is driven by “delivery density”–basically how closely spaced are each of a truck’s stops. One of the industry’s key efficiency metrics is “stops per mile.” The more stops per mile, according to the Institute for Supply Management, the greater the efficiency and the lower the cost of delivery. As delivery volumes increase, delivery becomes progressively more efficient. In the last several years, thanks to increased volumes — coupled with computerized routing algorithms — UPS has increased its number of stops per mile–stops increased by 3.6 percent but miles traveled increased by only about half as much, 1.9 percent. UPS estimates that higher stops per mile saved an estimated 20 million vehicle miles of travel. Or consider the experience of the U.S. Postal Service: since 2008, its increased the number of packages it delivers by 700 million per year (up 21 percent) while its delivery fleet has decreased by 10,000 vehicles (about 5 percent).
As e-commerce and delivery volumes grow, stop density will increase and freight transport will become more efficient. Because Jet.com is a rival internet shopping site to Amazon.com, and not a trucking company, its growth means more packages and greater delivery density for UPS and Fedex, not another rival delivery service putting trucks on the street.
So, far from putative cause of worry about transportation system capacity–and inevitably, a stalking horse for highway expansion projects in urban areas–the growth of e-commerce should be seen as another force that is likely to reduce total vehicle miles of travel, both by households (as they substitute on line shopping for car travel) and as greater delivery density improves the efficiency of urban freight delivery.
As David Levinson reports, data from detailed metropolitan level travel surveys and the national American Time Use Study show that time spent shopping has declined by about a third in the past decade. As Levinson concludes “. . . our 20th century retail infrastructure and supporting transportation system of roads and parking is overbuilt for the 21st century last-mile delivery problems in an era with growing internet shopping.”
So the next time you see one of those white or brown package delivery trucks think about how many car based shopping trips its taking off the road.
Technical Appendix: Urban Truck Data
We’re strongly of the opinion that its not appropriate to treat the pre-2006 and post-2007 truck freight data as a single series that represents the actual year to year growth in urban freight mileage. There are good reasons to treat this as a “series break” look separately at the two series. The technical reasons behind this judgment are two-fold.
Series Break 1: Urbanized area boundaries
Tony Dutzik explored this issue last year in a post for the Frontier Group. Briefly, a number of rural roads were re-classified as urban roads (reflecting changes in development patterns over time). This has the effect of biasing upwards later year estimates of urban VMT when compared to previous years. Some part of the apparent increase in “urban” VMT over the past decade has been a result of reclassifying formerly “rural” traffic as “urban”–not more urban traffic.
Series Break 2: Vehicle classifications
US DOT has used different data and different definitions to classify vehicles pre- and post-2007. Methodologically, what USDOT has done is migrated their vehicle classification system from that used in the now discontinued Vehicle Inventory and Use Survey and instead substituted RL Polk data. As a result of this shift in methodology the number of truck miles on urban roads jumped almost 50 percent in one year, from about 102 billion miles in 2006 to about 150 billion miles in 2007. In 2009, USDOT explained how they’d changed their estimating procedures.
The data now on the website for 2000-2006 were estimated using a methodology developed in the late 1990s. FHWA recently developed a new methodology and used it for this year’s Highway Statistics. This methodology takes advantage of additional and improved information available beginning in 2007 when states were first required to report motorcycle data – before that time, the reporting was not mandatory and the data were missing for a few states. Also, the new methodology does not rely on data from the national vehicle inventory and use survey which provided critical data for the original methodology but was not collected in 2007 as planned.
In April 2011, FHWA recalculated the 2000-2008 data along with the 2009 data to estimate trends. However, after further review and consideration, the agency determined that it is more reliable to retain the original 2000-2006 estimates because the information available for those years does not fully meet the requirements of the new methodology. Thus, the original 2000-2006 estimates are now used, whereas the 2007-2009 data are still based on the new methodology.
The author gratefully acknowledges Adie Tomer’s willingness to share the Excel spreadsheets upon which his analysis was based.
