The secret to reducing the amount of time Americans spend in peak hour traffic has more to do with how we build our cities than how we build our roads.
Our 2010 report, published by CEOs for Cities, looks at how land use patterns determine travel distances. Commonly used measures of traffic congestion, like the travel time index conceal the role of sprawl in adding to travel times. Cities with more compact development patterns have shorter travel times, a fact not reveal by congestion statistics.
While peak hour travel is a perennial headache for many Americans – peak hour travel times average 200 hours a year in large metropolitan areas – some cities have managed to achieve shorter travel distances and actually reduce peak hour travel times. The key is land use patterns and transportation systems that enable their residents to take shorter trips and minimize the burden of peak hour travel.
That’s not the conclusion promoted by years of highway-oriented transportation research. The Urban Mobility Report produced annually by the Texas Transportation Institute and widely used to gauge metropolitan traffic problems has completely overlooked the role that variations in travel distances play in driving urban transportation problems.
This report offers a new view of urban transportation performance. It explores the key role that land use and variations in travel distances play in determining how long Americans spend in peak hour travel. It shows how the key tool contained in the Urban Mobility Report – the Travel Time Index – actually penalizes cities that have shorter travel distances and conceals the additional burden caused by longer trips in sprawling metropolitan areas. Finally, it critically examines the reliability and usefulness of the methodology used in the Urban Mobility Report (UMR), finding it does not accurately estimate travel speeds, it exaggerates travel delays, and it overestimates the fuel consumption associated with urban travel. How we measure transportation systems matters, and the nation needs a better set of measures than it has today.
Why Travel Time Indexes Mislead
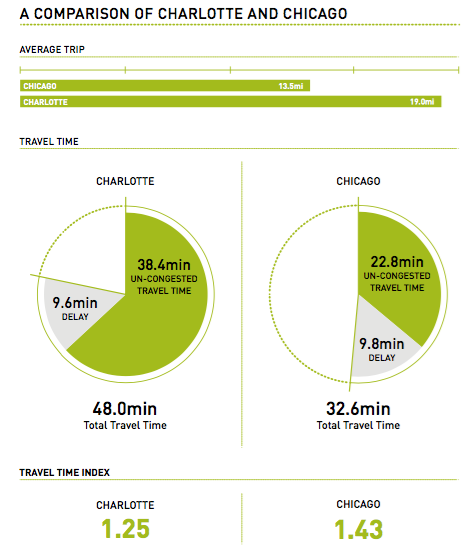
To show how the travel time index conceals the real burden of peak hour travel, we compare two cities, Chicago and Charlotte. According to the travel time index (TTI), congestion is much worse in Chicago, which has a TTI of 1.43, compared to Charlotte’s TTI of 1.25. Chicago’s TTI means a peak hour trip takes 43 percent longer than the same trip taken in off-peak hours. But what the TTI hides is the fact that average trips in Charlotte are much longer (19 miles) than in Chicago (13.5 miles). Chicago commuters face basically the same amount of delay (about 9 minutes), but their total travel time (32 minutes) is much less than in Charlotte (48 minutes) because the region is so much more compact.
Land use patterns and trip distances are the real source of travel burden
Travelers in some cities – those with more compact development patterns – tend to spend less time in peak hour traffic because they don’t have to travel as far.
If every one of the top 50 metro areas achieved the same level of peak hour travel distances as the best performing cities, their residents would drive about 40 billion fewer miles per year and use two billion fewer gallons of fuel, at a savings of $31 billion annually.
In the best performing cities the typical traveler spends 40 fewer hours per year in peak hour travel than the average American because of the shorter distances they have to travel.
In the best performing cities – those that have achieved the shortest peak hour travel distances – such as Chicago, Portland and Sacramento, the typical traveler spends 40 fewer hours per year in peak hour travel than the average American. In contrast, in the most sprawling metropolitan areas, such as Nashville, Indianapolis and Raleigh, the average resident spends as much as 240 hours per year in peak period travel because travel distances are so much greater. These data suggest that reducing average trip lengths is a key to reducing the burden of peak period travel. Over the past two decades, for example, Portland Oregon, which has smart land use planning and has invested in alternative transportation, has seen its average trip lengths decline by 20 percent.