In a nation increasingly divided by race and economic status, where our life prospects are increasingly de ned by the wealth of our zip codes, some American neighborhoods are bucking the trend.
These neighborhoods—which we call America’s most diverse, mixed-income neighborhoods—have high levels of racial, ethnic and income diversity. This report identifies, maps and counts the nation’s most diverse mixed-income neighborhoods. In these neighborhoods, residents are much more likely than the average American to have neighbors from different racial/ethnic groups than themselves, and neighbors with different levels of income. We find that:
- Nearly 7 million Americans live in neighborhoods with both high levels of racial/ethnic and economic diversity.
- Roughly half of these neighborhoods are found in three of the nation’s largest, most diverse metropolitan areas: New York, Los Angeles and San Francisco.
- Most large metropolitan areas have several neighborhoods that are among the nation’s most diverse and mixed income. Forty-four of the nation’s 52 largest metro areas have at least one diverse, mixed-income neighborhood.
- The racial and ethnic diversity of a metropolitan area sets the context for having diverse, mixed income neighborhoods. Whether metropolitan diversity is reflected in the lived experience in the typical neighborhood depends on how segregated a metropolitan area is by race, ethnicity and class.
- Some metropolitan areas come much closer to realizing their potential for neighborhood racial/ethnic diversity, given their metropolitan demographic composition.
We identified the nation’s most diverse, mixed income neighborhoods using Census data on the race, ethnicity and household income of neighborhood residents. For each of more than 31,000 urban neighborhoods, we computed a Racial and Ethnic Diversity Index (REDI), which corresponds to the probability that any two randomly selected individuals in a neighborhood would be from different racial/ethnic categories. (Using Census data, we tabulated the number of white, black, Asian, Latino and all other persons in each neighborhood). We used a similar approach to compute an Income Diversity Index (IDI) which measures the variety of household incomes. Neighborhoods that ranked in the top 20 percent of all urban neighborhoods nationally on both of these measures were classified as diverse mixed income neighborhoods.
Which cities have the highest levels of diversity and mixed income?
Nearly all of the nation’s largest cities have at least one neighborhood that meets our definition as being both racially and ethnically diverse and mixed income. Three large cities–New York, Los Angeles and San Francisco account for nearly half such neighborhoods, but some smaller cities also rank high in the fraction of their population living in these diverse, mixed income neighborhoods.

Which cities are performing up to their potential?
Whether a city has many diverse, mixed income neighborhoods depends directly on the demographics of the metropolitan area in which it is located. There is still a wide range of racial and ethnic diversity among metropolitan areas. The following chart shows the relationship between a metropolitan area’s overall racial and ethnic diversity (shown on the horizontal axis) and the percentage of that region’s population that lives in diverse, mixed income neighborhoods. More diverse metros generally have a larger share of their population living in diverse, mixed income neighborhoods. The regression line shows the typical relationship between metro diversity and the share of population living in diverse, mixed income neighborhoods. Cities above that line are performing better, on average, than one would expect based on their diversity; cities below that line are performing less well.
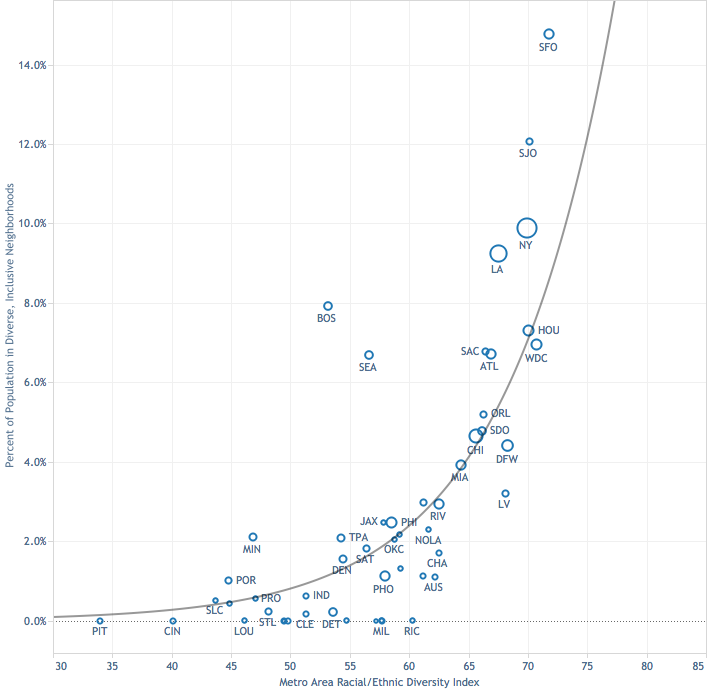
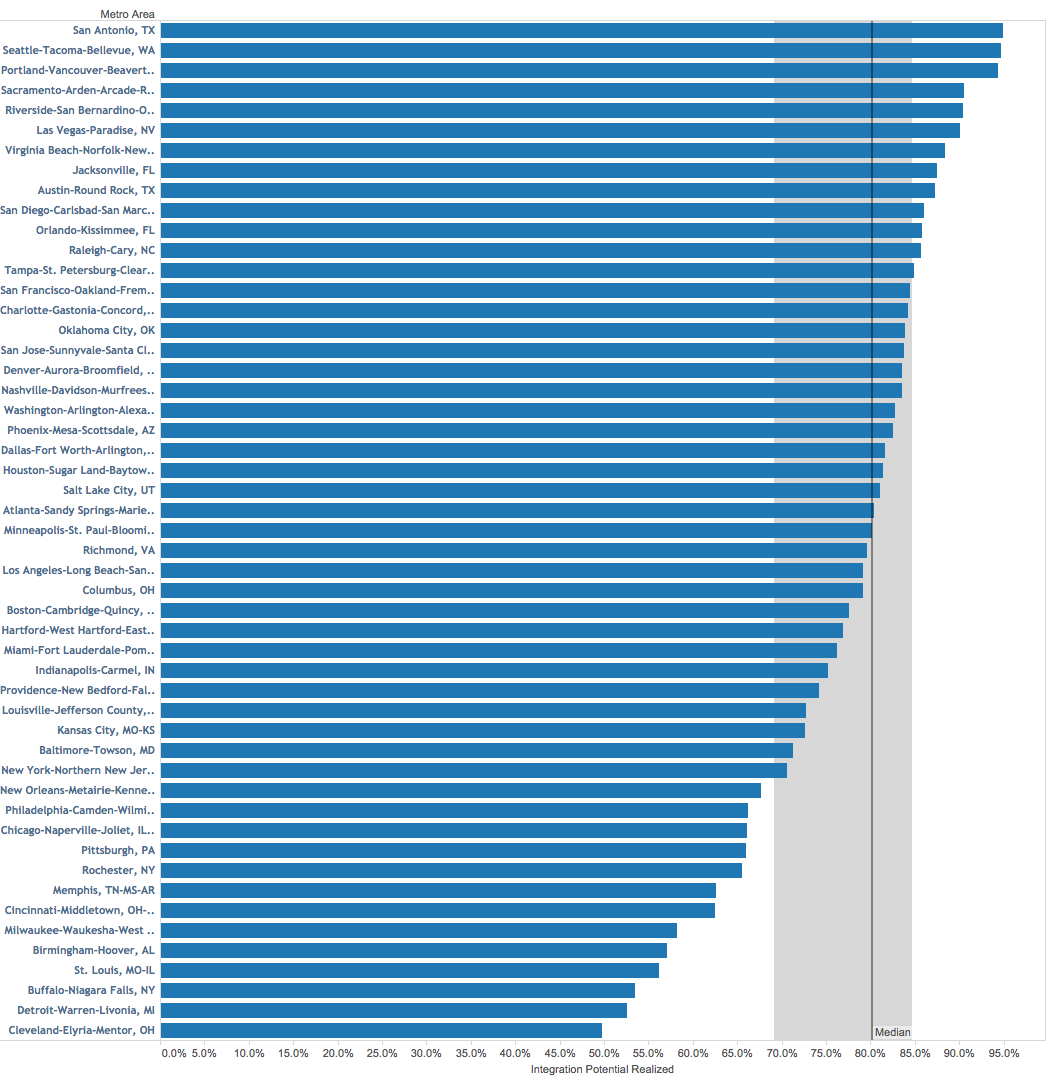
Some cities do a better job of realizing their diversity at a neighborhood level, than others. For each large metropolitan area we’ve computed the racial and ethnic diversity of the median neighborhood–reflecting lived experience of the typical resident. We’ve then compared that with the racial and ethnic diversity of the metropolitan area to see how closely the experience of the typical neighborhood resident comes to matching the diversity of the metropolitan area in which they live. Cities at the top of the list have neighborhood diversity that closely resembles metro diversity; those at the bottom are much more segregated, and don’t experience at the neighborhood level much of the diversity of their region.
Where are the most diverse, mixed income neighborhoods?
We’ve mapped the locations of the most racially and ethnically diverse and most mixed income neighborhoods in each of the nation’s 52 largest metropolitan areas. The map for San Francisco–one of the higher ranking metro areas–shows strong concentrations of diverse, mixed income neighborhoods in the City of San Francisco and the East Bay.
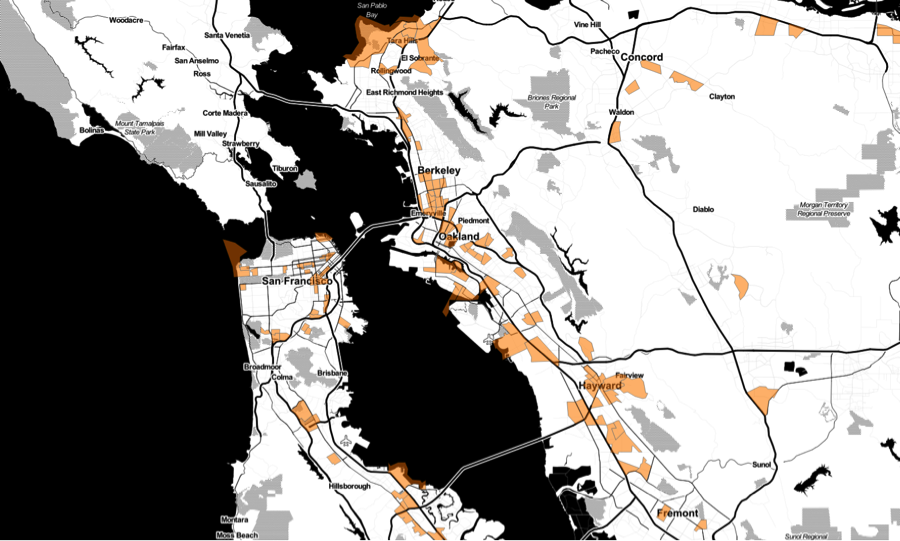
Detailed maps of the location of diverse, mixed income neighborhoods for each of the nation’s 52 largest metropolitan areas are available here. These on-line maps enable you to see the patterns of diversity in each metro area, and drill-down to the census tract level to inspect data for individual neighborhoods.
Why integration matters
A growing body of social science research confirms the importance of diversity to economic success. Greater socioeconomic mixing is facilitated in neighborhoods that re ect America’s racial and ethnic diversity, and which offer housing that is affordable to people with a range of incomes. In a series of studies led by Stanford’s Raj Chetty and his colleagues at the Equality of Opportunity Project, racial and economic segregation have been shown to reduce intergenerational economic mobility (the probability that children of low income families will, as adults, earn higher incomes than their parents). A recent post at City Observatory presents a synopsis of the literature on this subject, with citations to key works.
For a long time, we’ve known that neighborhoods of concentrated poverty are toxic to the life prospects of children who grow up there. Rothwell and Massey have shown that your neighbors’ educational attainment is nearly half as large as your parents’ educational attainment in shaping your life prospects. Living in a neighborhood with greater diversity and a mix of incomes generally means that families enjoy better-resourced public services and civic assets (including schools, parks and libraries) and develop stronger, more diverse social networks. Diverse, mixed-income neighborhoods are a platform for helping kids from lower-income families to escape poverty and realize the American dream.
Want to know more?
We’ve laid out our data, methodology and more detailed findings on our analyses of racial and ethnic diversity, and of income diversity in our technical report “Identifying America’s Most Diverse Inclusive Neighborhoods.”