What City Observatory this week
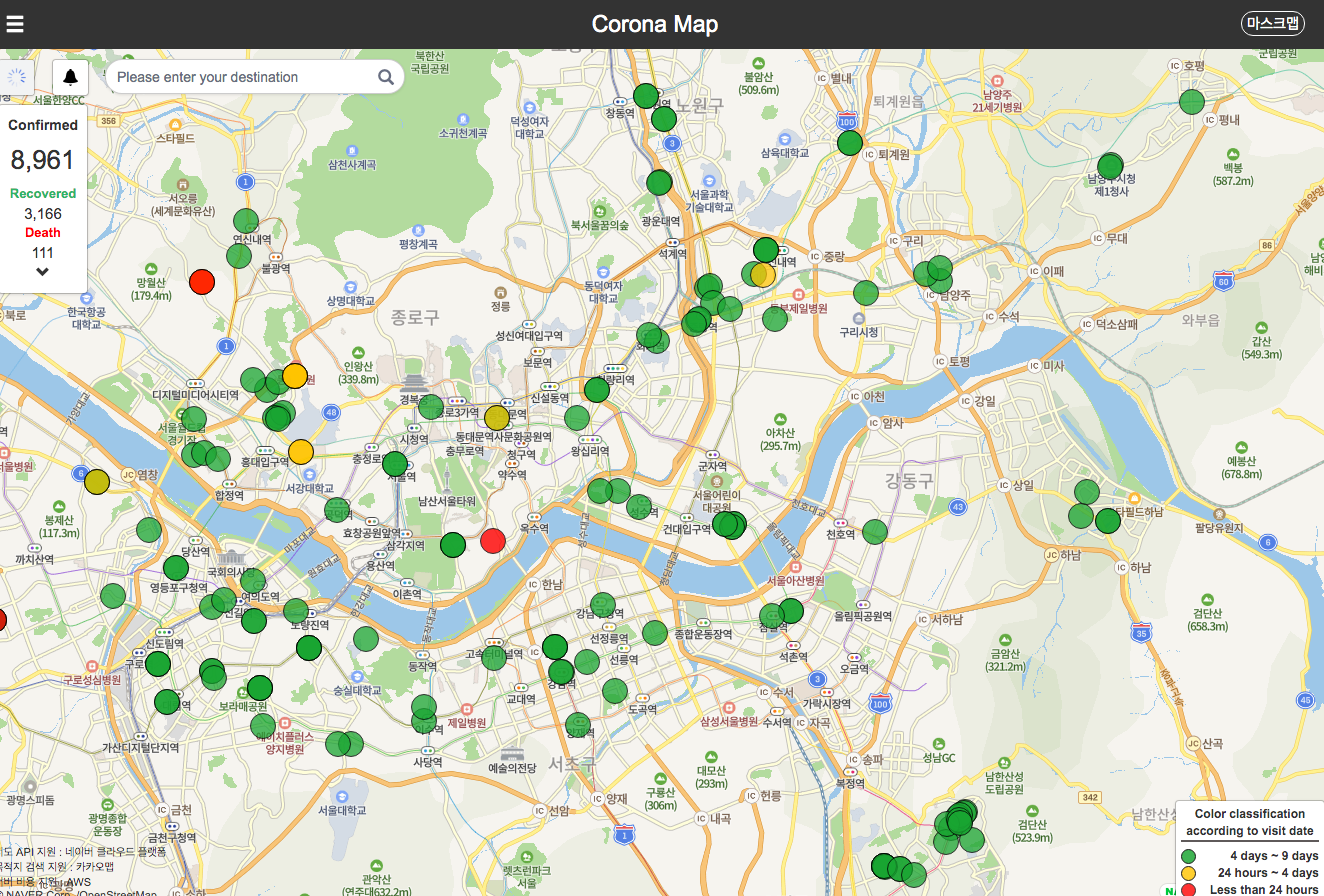
1. The Geography of Covid-19. A week ago, we issued a call to get much more granular with our statistical analysis of the pandemic’s spread. In just the past few days, a number of new localized measures have emerged. We highlight some of the best practices from around the world. South Korea has a government database that geocodes the location of individual cases. They’ve mapped the locations of cases in a way that helps people avoid risky locations. We also highlight excellent data analyses from France and Italy.
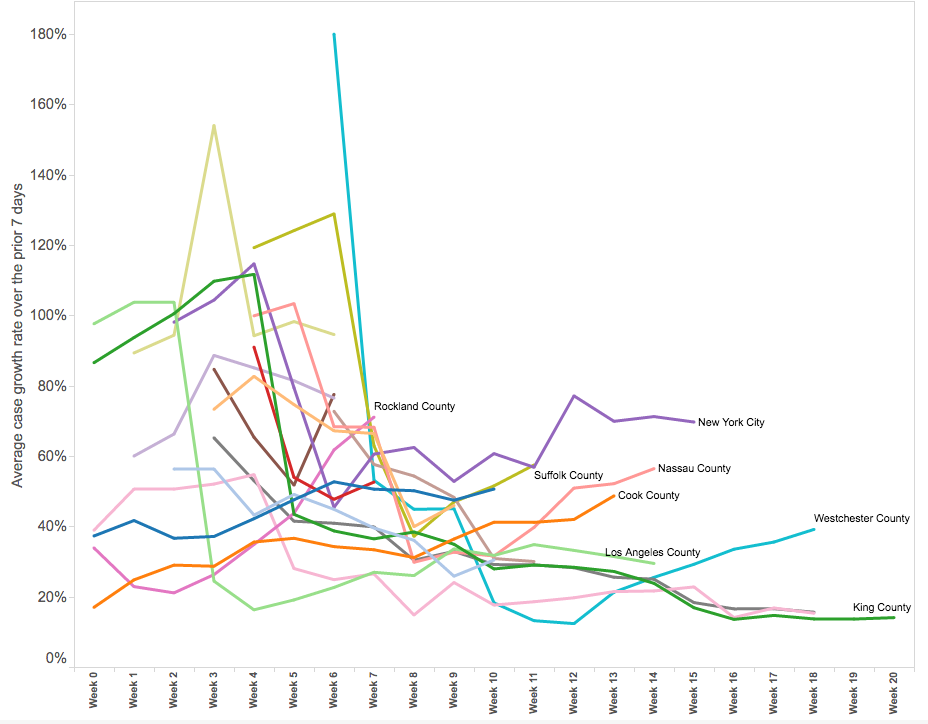
2. County-level growth rates of Covid-19 cases. The big issue with Corona is flattening the curve. But the usual way we present the data (with the ominous upward sloping exponential curve) makes it difficult to pick out whether we’re making progress. There’s an alternative: computing the average percentage increase in the number of diagnosed cases over the last 5 to 7 days. Others, like Lyman Stone have generated these charts for US states: We’ve calculated them for the US counties with the highest numbers of diagnosed cases. This measure shows which places are starting to flatten the curve, and which ones are behind the curve.
3. Metro Covid-19 rates March 22. Between state level data (which are widely published) and county level data (which are noisy and hard to digest) lies data for metropolitan areas. We’ve taken county level data and aggregated it up to the metropolitan level for the 53 metro areas with a million or more population. We’ve also calculated the incidence of the pandemic in each metro: the number of diagnosed cases per 100,000.
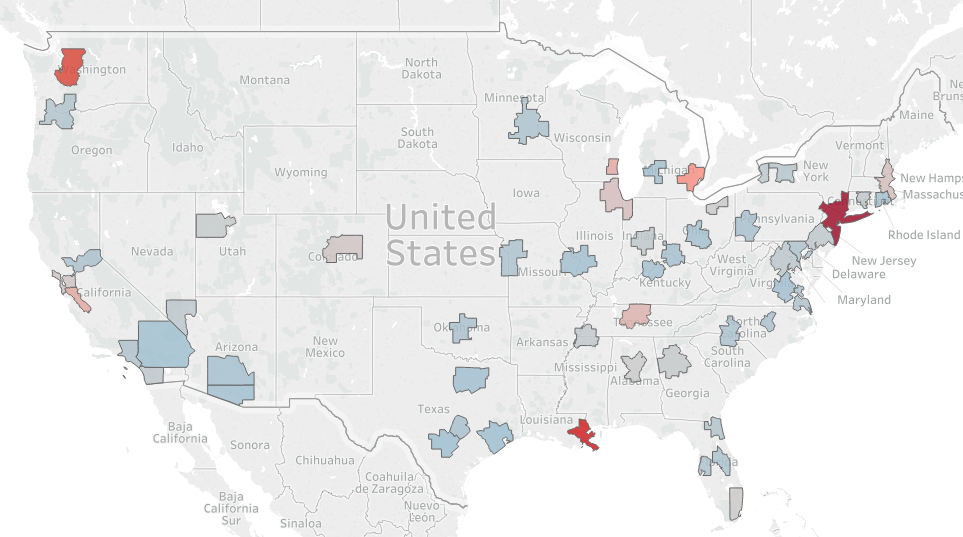
4. We updated our metro level analysis to include data for March 25. New York, New Orleans and Seattle, still topped the list for cases per capita, but showed wildly different growth trajectories. The rate in New York nearly tripled from about 80 cases per 100,000 on March 22, to 250 on March 25. Seattle’s growth rate attenuated, with cases per 100,000 increasing from about xx on March 22, to about yy on March 25 (up xx percent). The number of cases per 100,000 in the median large metropolitan area more than doubled in three days, from about 4 cases per 100,000 on March 22 to about 9 cases on March 25.
Must read
1. Policy Advice on dealing with the Corona Virus. Many of our wonky urbanist friends have put their minds to thinking about what the nation ought to be doing to tackle the pandemic, and mitigate the economic damage from the necessity of social distancing. Richard Florida and Steven Pedigo have their eyes on how cities come out of this crisis and have outlined eight steps we ought to be taking. Xavier de Souza-Briggs, Amy Liu and Jenny Schuetz have outlined the need for a large and comprehensive program to buffer state and local governments from promises to be a brutal fiscal shock, which if not addressed could worsen the pandemic and prolong the economic suffering, as well. Upjohn Institute’s Tim Bartik and colleagues have some useful suggestions about what needed to be in a federal fiscal response. Time will tell whether the measures now emerging from Congress will measure up to the solid advice we’re seeing here.
2. No, Joel, this doesn’t mean the end of cities. Emily Badger delivers your antidote to the “end of urbanism” talk emanating from some quarters. In her article at the New York Times, she points out that cities have long encountered–and always overcome–infectious diseases. There’s a lot about our urban environment that could be strengthened, in ways that would less vulnerable, while also making them even better places to live during normal times.
But if the earlier history of American cities is full of public-health horror stories about substandard housing, factory pollution and poor sanitation, more recent history tells of the health and resiliency density can provide. In practical ways, density makes possible many of the things we need when something goes wrong. That is certainly true of hospital infrastructure — emergency response times are faster, and hospitals are better staffed in denser places. When one store is closed or out of toilet paper, there are more places to look. When people can’t leave home for essentials, there are alternative ways to get them, like grocery delivery services or bike couriers. When people can’t visit public spaces, there are still ways to create public life, from balconies, porches and windows.
3. Trying times: Will they temper us? Ryan Avent, who writes for The Economist, asks some important questions about how the Covid-19 Pandemic will reshape our politics and possibilities. His essay at “The Bellows” challenges us to think about the opportunities this crisis presents:
Not to say that the short-run economic or health consequences of the pandemic aren’t a terrible thing to face. But changes to the system which once looked impossible to achieve increasingly seem within reach, maybe even inevitable. It is just possible to imagine badly needed changes—mandated paid sick leave, the end of the employer-based health insurance system—becoming reality. Something like a universal basic income, the fantastic underpinning of a techno-utopian future, may well emerge as a means to protect people against the economic damage wrought by the pandemic.
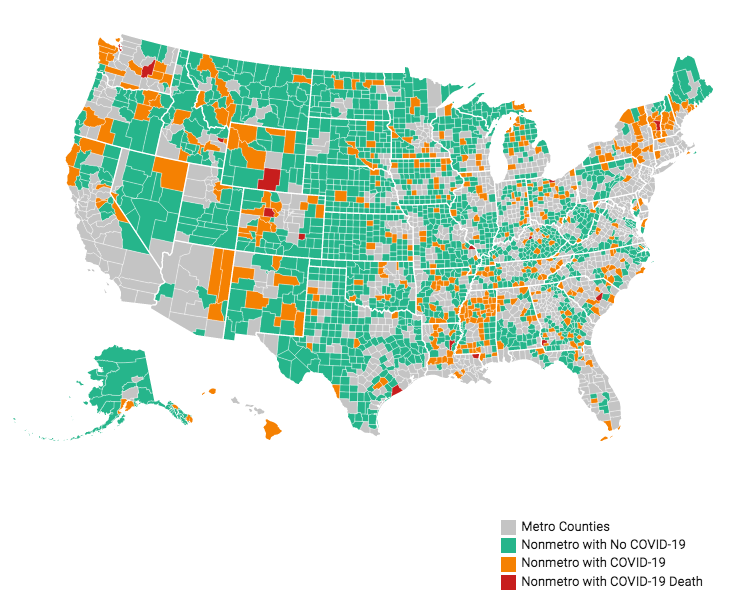
4. Corona is reaching rural areas much more slowly. Perhaps density has something to do with it, but rural areas are generally less connected to the rest of the country and the world, than are cities. This probably explains why rural areas have much lower incidence of Covid-19 than the nation’s cities. Our friend, Bill Biship, at the Daily Yonder has mapped incidence of the virus in the nation’s non-metro counties. The hotspots? They turn out to be disproportionately recreational areas, like those near ski areas in Colorado, Idaho and Utah.
New Knowledge