What City Observatory Did This Week
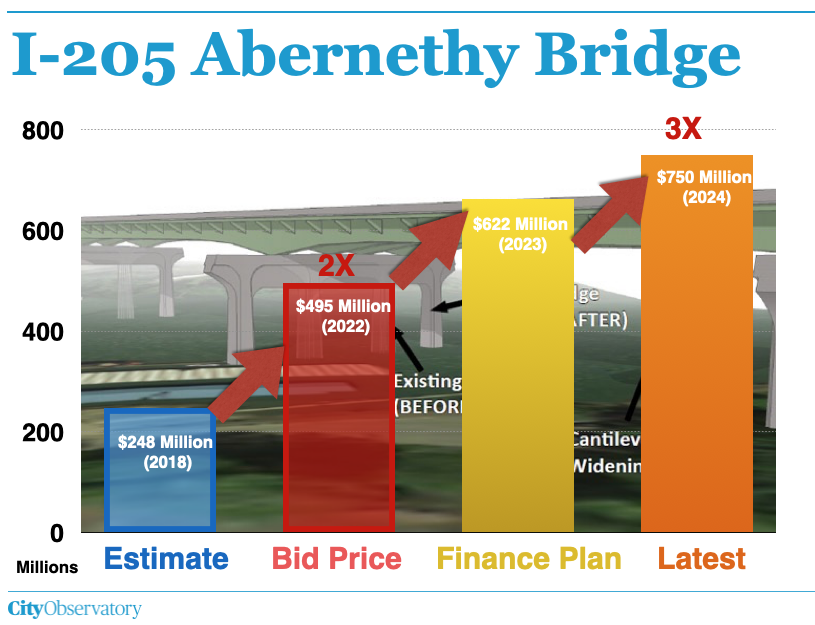
Another Oregon Department of Transportation exploding whale.* The cost of one of OregonDOT’s megaprojects, the expansion of the I-205 Abernethy Bridge over the Willamette River south of Portland just jumped $750 million, now triple the amount the agency said the project would cost when it moved forward five years ago.
ODOT’s plans to cover these cost overruns would mean cancelling dozens of other projects around the state, and/or a huge statewide gas tax increase. ODOT specifically targeted cuts to Great Streets, Safe Routes to School, Pedestrian/Bike Strategic, Innovative Mobility, and transit programs funded from FHWA formula funds. The alternative, a gas tax in place of tolling would mean instead of the actual users paying $2-$3 each time they used one of these new billion-dollar-a-mile roads, every motorist in Oregon would be forced to pay $1-$2 every time they filled up their vehicle.
*- We call ODOT’s chronic cost overruns “exploding whales” in honor of the fifty year old video of Oregon highway engineers trying to remove a dead whale from a Pacific Coast beach with an excess of dynamite. (The video has had 14 million views on Youtube).
The $7.5 Billion Interstate Bridge Project is two years behind schedule. IBR’s Draft SEIS was supposed to be complete in December 2022—It now won’t be done before December 2024. This two-year delay means the environmental review has taken twice as long as IBR promised.

The IBR, like many state highway projects is case study of “Hurry up and wait”–if you have questions or doubts about the project, there’s no time to consider them, without delaying the project. But state DOTs routinely blow through stated deadlines with no consequences. No consequences, except, perhaps added expense, as project costs escalate and consultants continue billing—the total consulting bill now exceeds $200 million.
Must Read
Rent and Inflation rates. Rising rents–and their mis-measurement are key components of overall national inflation. The cost of rent is a significant component of the consumer price index—the nation’s key gauge of inflation. But there’s a quirk in how rents and measured. The Census Bureau uses a survey of newly signed leases that does a decidedly imprecise job of recording current rent levels. Barry Ritholtz has an interesting comparison of Census rental estimates with contemporaneous private market data from Zillow and Apartment List.
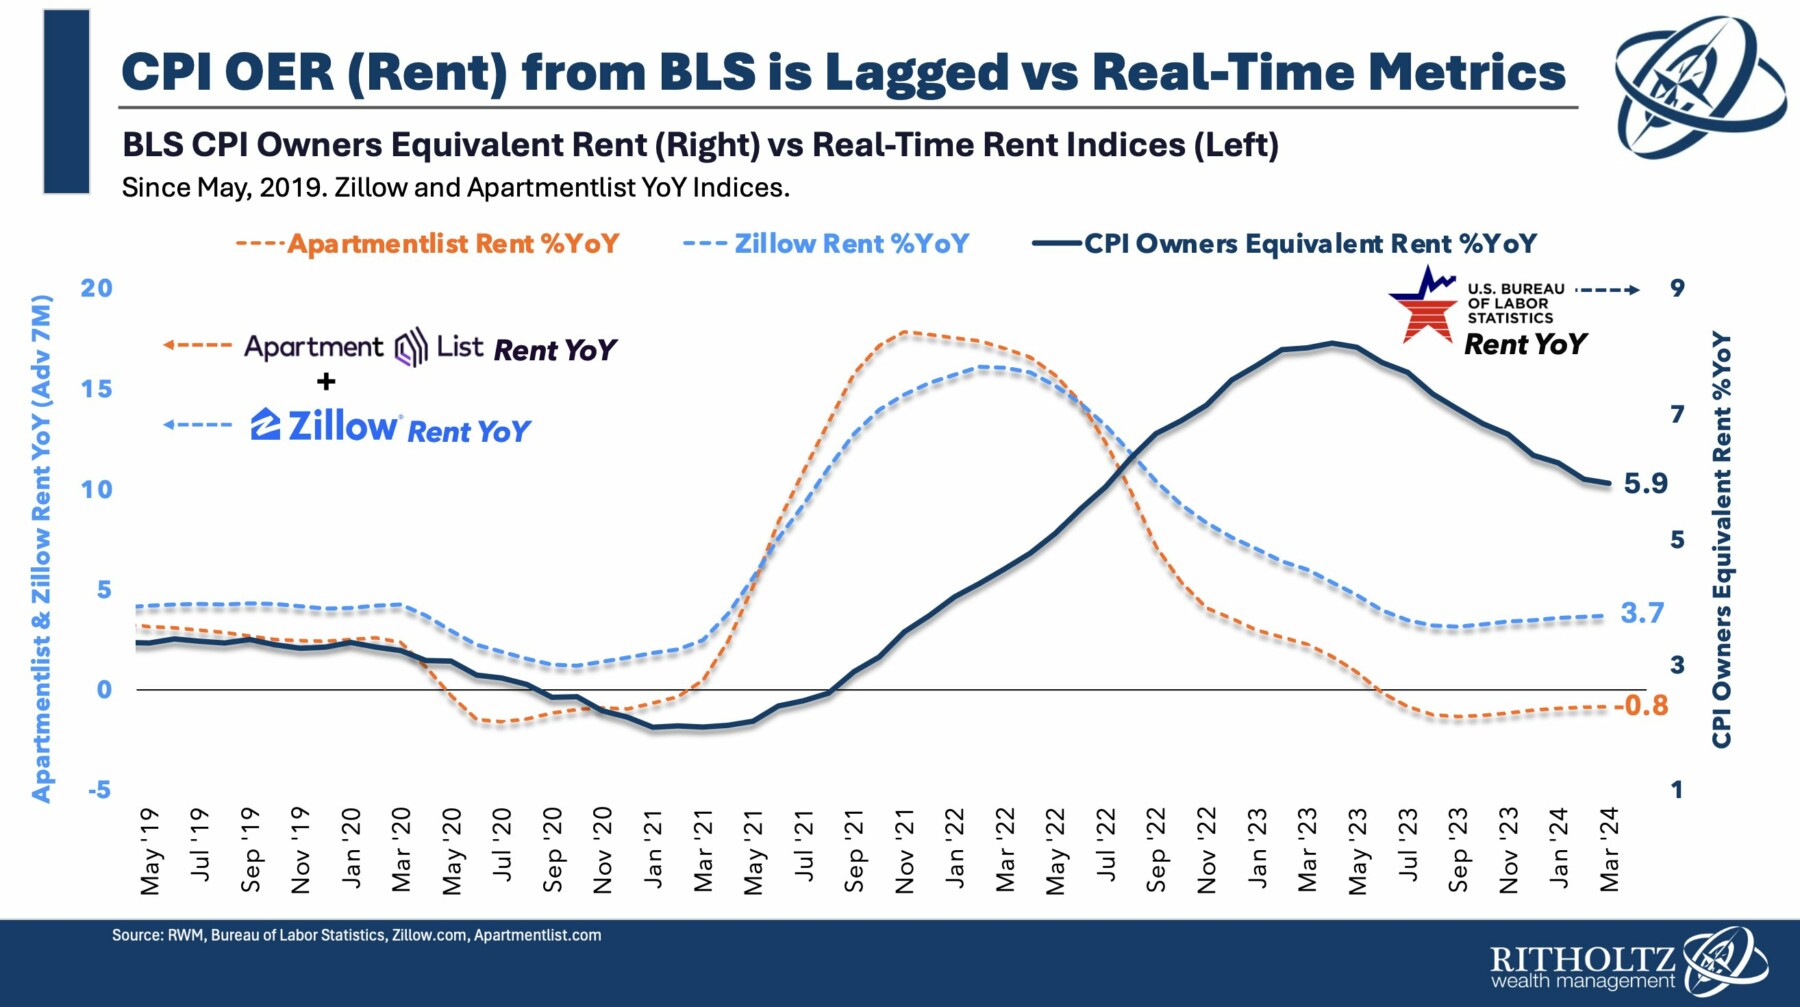
It’s apparent that the Census Bureau’s rent measure (CPI Owners Equivalent Rent) lags what is happening in the market by about 18 months. According to Census data, rental inflation didn’t peak until mid-2023, about a year and a half later than the peaks recorded by the two private-sector measures. The reason, according to Ritholtz, appears to be that the Census data average both new and continuing leases, and an average of leases of various vintages always lags the market (understating increases on the upside, and overstating rents on the downside). As a result, the current CPI is somewhat overstated, and is almost certain to decline further as older leases expire. Ritholtz estimates that excluding rental inflation from the CPI would lower the overall index to about 2.3 percent annually, very near the Fed’s desired target.
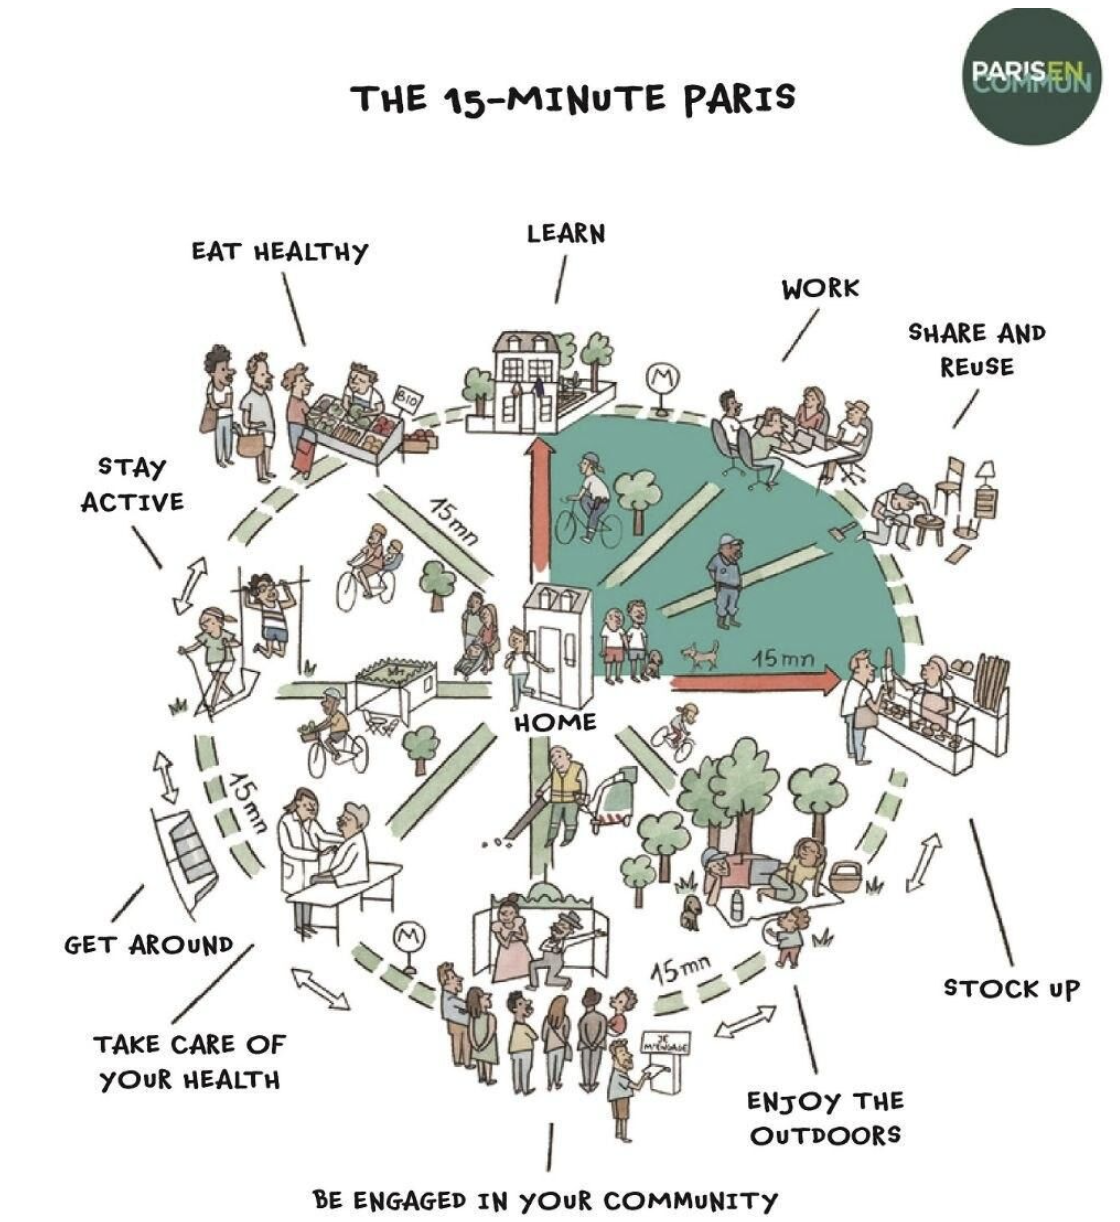
The simple logic of 15-minute living. Bloomberg’s CityLab has an interview with Carlos Moreno, who popularized the 15-minute city idea in Paris. In a new book, Moreno pushes back against the critics of 15-minute cities. The concept has been caricatured and misrepresented as an effort to restrict where people can travel or live, when its real aim is to give people more choices close at hand.
The fundamental idea behind Moreno’s blueprint is that residents can reach essential services within 15 minutes by walking, biking or public transit.
The real social engineering was inflicted upon cities by highway engineers, and planners who insisted on the segregation of people and functions across the landscape, facilitating and necessitating automobile use. As a result, Moreno argues:
. . . neighborhoods lost their vitality and internal coherence as the city became increasingly sprawling and car-dominated — a process in which the suburban house was just as much a culprit as the glass-clad downtown tower.
Why Climate Activists should be Urbanists. Alex Brennan of Washington’s Futurewise has a great essay speaking to the importance of land use—specifically dense livable urban neighborhoods—to any strategy for combatting climate change. Whether its reducing emissions from transportation and buildings, or protecting natural ecosystems, focusing development in urban areas has huge climate benefits:
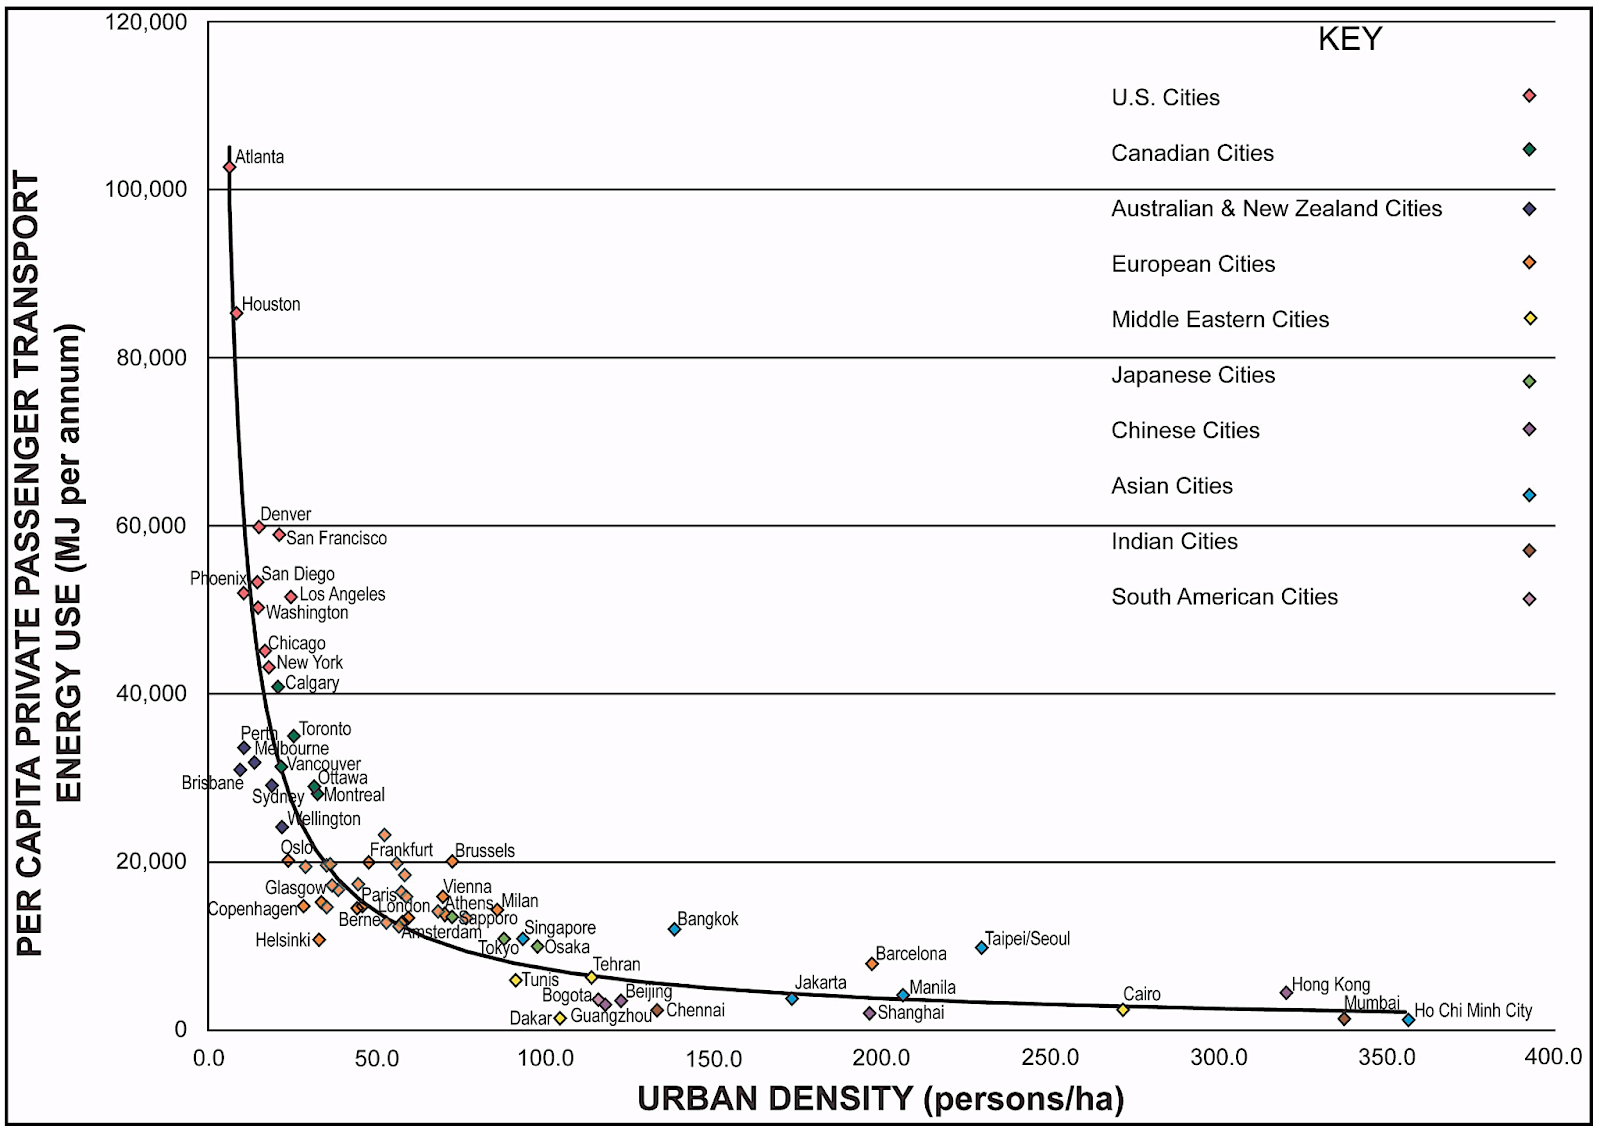
. . . land use policy can have a big impact on greenhouse gas emissions. More compact cities have a lot less driving than suburbs. Apartment buildings use a lot less energy than single family homes. Keeping development in cities protects rural areas and keeps them sequestering carbon.
Brennan bolsters the case for the urbanism/climate connection with solid cross-sectional data on emissions and density.
This is the first of a four-part series exploring this connection–we’re looking forward to what comes next.
New Knowledge
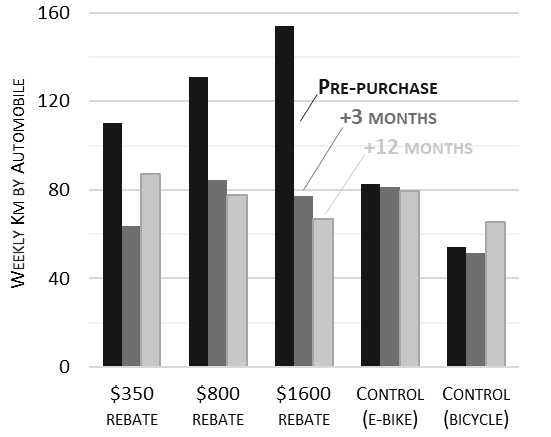
E-Bike incentives reduce driving and greenhouse gas emissions. A new study from the University of British Columbia demonstrates the efficacy of e-bike subsidies. Many local governments are experimenting with subsidies for the purchase of electric bicycles. The idea is that if households have e-bikes available, they’ll use them to substitute for many driving trips. This study examined pre- and post-purchase behaviors of households that received e-bike rebates, and compared them to the travel behavior of a control group that already owned e-bikes (or conventional bicycles). The key result is that automobile use declined significantly among households that purchased e-bikes with subsidies, and that auto use stayed down for an entire year. As the author’s conclude:
The purchased e-bikes were used on average 3 to 4 days, or 32 to 70 km, per week . Around 40% to 44% of the reported e-bike use substituted for automobile travel, directly displacing automobile PKT[person kilometers traveled] by on average 7 km per e-bike (return) trip, or around 25 km per week.
The study looked at the effects of three different subsidy levels—a $350 rebate, a $800 rebate and a $1,600 rebate. The post-purchase auto travel patterns of all three groups were similar, but the larger rebates had the effect of reaching households that drove more prior to participating in the program. The authors explain:
Larger incentives were associated with greater auto travel reduction due to higher pre-purchase auto usage. This was likely achieved due to income-conditioning the larger incentives, which directed them to more financially constrained households who were interested in shifting some of their auto use to cycling, but hindered by the cost of e-bikes. Although e-bikes reduce marginal travel costs, the initial purchase price is still a major barrier, especially for low-income households, which is reflected in the high reported marginality for e-bike purchases made with the largest incentives. I
A key question for e-bike subsidies is how much of the subsidy goes to households that would have bought an e-bike even without a subsidy. This question is essential for gauging the true net benefits of the program. This study finds that even allowing for this effect, the program produces greenhouse gas reductions at a cost comparable to many other transportation investments, and provides collateral health benefits from increased physical activity.
Alexander Bigazzi, Amir Hassanpour & Emily Bardutzl, Travel Behaviour and Greenhouse Gas Impacts of the Saanich E-Bike Incentive Program Final Report Prepared for District of Saanich, University of British Columbia, March 2024
