What City Observatory did this week
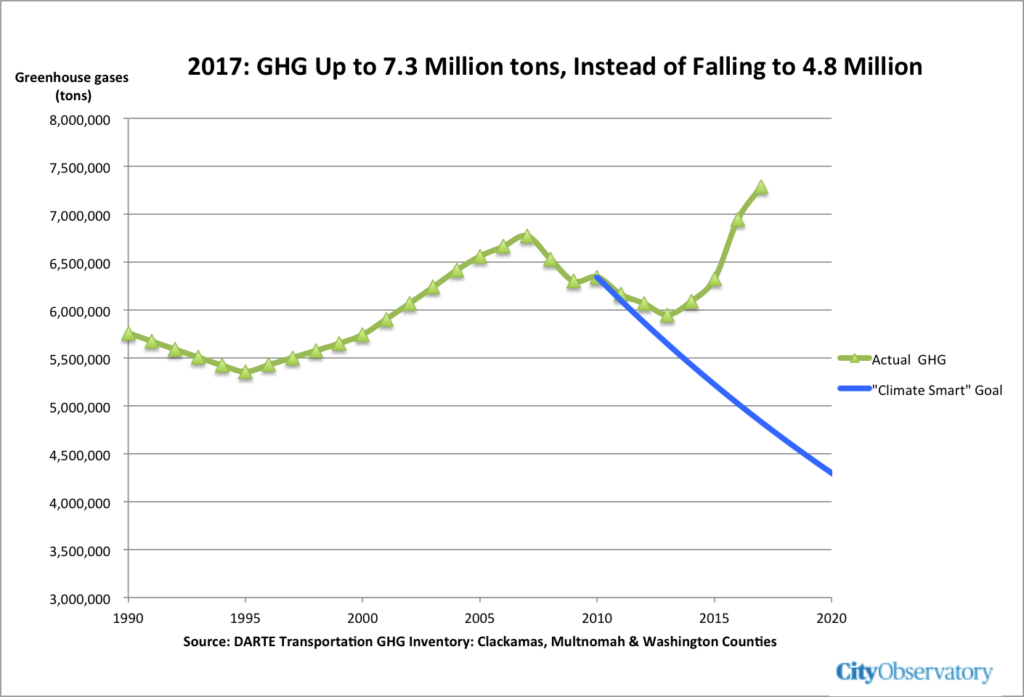
1. Metro’s failing climate strategy. Portland Metro’s Climate Smart Strategy, adopted in 2014, has been an abject failure. Portland area transportation greenhouse gasses are up 22 percent since the plan was adopted: instead of falling by 1 million tons per year, emissions have increased by 1 million tons annually, to more than 7 million tons, putting us even further from our climate goals.
Metro’s subsequent 2018 RTP has watered down the region’s climate effort far below what is needed to comply with Oregon’s statutory greenhouse gas reduction goal, based on the assumption that 90 percent of emission reductions would be accomplished with cleaner vehicles. All of Metro’s key assumptions about transit, vehicle turnover, technology adoption, and driving, have been proven wrong. The plan has set a goal for reducing vehicle miles traveled that is actually weaker than the reductions the region achieved in the decade prior to the adoption of the “Climate Smart Strategy.” The agency has not acknowledged the failure of its climate efforts, and is at the same time moving forward to allow the Oregon Department of Transportation to build a series of freeway widening projects that will add more than 140,000 tons of greenhouse gasses per year.
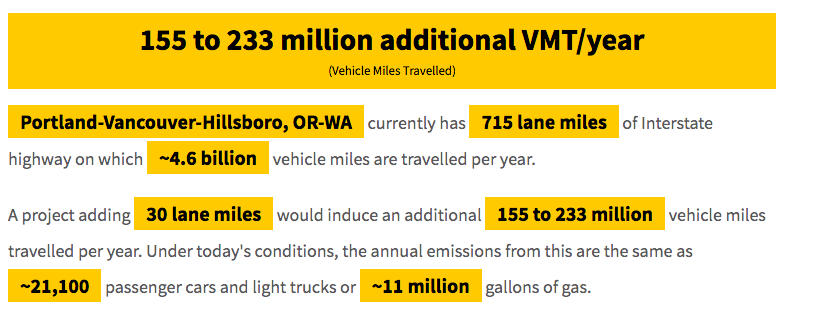
2. Why the I-5 Bridge Replacement is a Climate Disaster. The plan to spend $5 billion widening the I-5 Bridge Over the Columbia River would produce 100,000 additional metric tons of greenhouse gases per year, according to the induced travel calculator. Metro’s 2020 transportation package would have cut greenhouse gases by 5,200 tons per year– 20 times less than the additional greenhouse gases created by freeway widening.
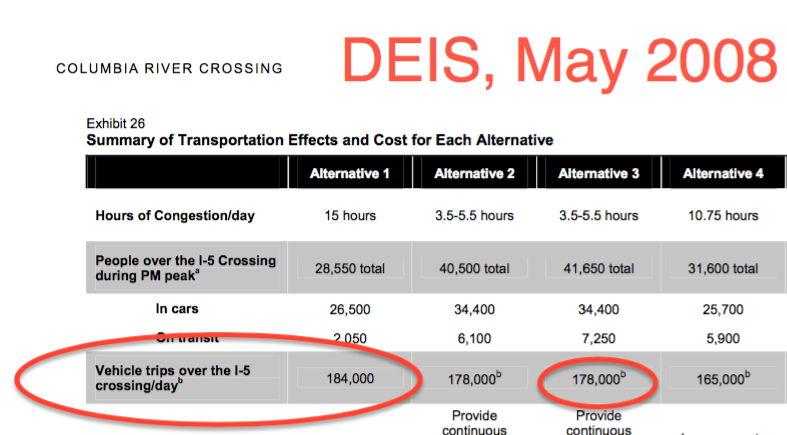
3. Oregon, Washington advance I-5 bridge based on outdated traffic projections. The Oregon and Washington Departments of Transportation are advancing their $5 billion freeway widening plan based on outdated 15-year-old traffic projections. No new projections have been prepared since the 2007 estimates used in the project’s Draft Environmental Impact Statement.
The two state DOTs are essentially “flying blind” assuming that out-dated traffic projections provide a reasonable basis for sizing and designing and new bridge, and rejecting other alternatives. The two agencies have spent two years and tens of millions of dollars but not done the most basic preliminary work to accurately predict future traffic levels. The Oregon DOT has specifically violated Governor Kate Brown’s pledge that new traffic analyses would be done prior to determining the “best solution” for the I-5 bridge project. The two agencies have no plans to publish new traffic studies until mid-to-late 2022—months after determining a final design and asking for other local sponsors to approve.
Must read
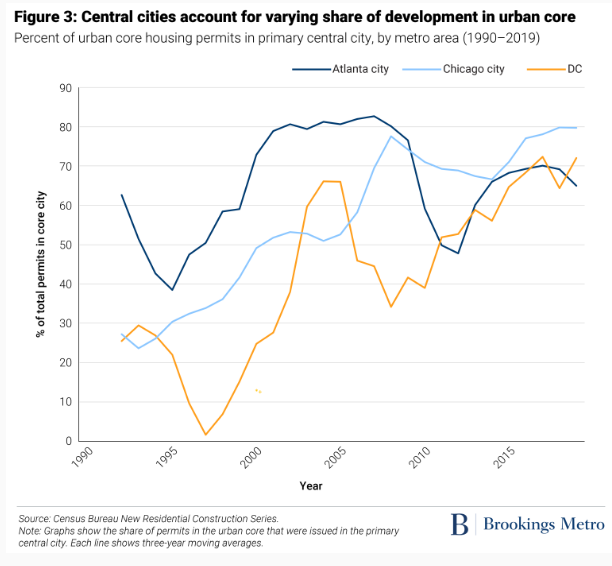
How we build cities matters for climate policy. Rushaine Goulbourn and Jennie Schuetz of Brookings Metro offer up a comparative analysis of housing development patterns in three US cities (Atlanta, Chicago, and Washington) that sheds important light on the connect between urban density and combating climate change. People living in denser, more centralized metro areas tend to drive less and walk and use transit more than their counterparts living in more sprawling metro areas. While historically most housing growth has occurred and the periphery, that’s beginning to change, and our ability to capitalize on the demand for urban living could pay important environmental dividends. The encouraging sign is that central cities have been doing somewhat better.
However, the urban core makes up a larger share of new housing post-Great Recession in all three metro areas. Since 2010, permits in the urban core were nearly half of total permits in Chicago and more than one-quarter of total permits in Atlanta and Washington, D.C. These trends are consistent with increasing demand for high amenity central cities across much of the U.S.
Misapplying value capture to parking policy. Writing at Substack, Darrell Owens criticizes the tortured logic that some non-profit advocates have used to try to hold parking reform hostage in a vain attempt to generate additional funds for affordable housing. It’s long been recognized that parking requirements drive up the cost of development, particularly for the most modestly priced apartments. Policy has focused on lessening or eliminating parking requirements, but the notion that this somehow might result in added profits for real estate developers or land owners, has led some affordable housing advocates to insist on extracting some payment in exchange for rolling back parking. In practice that hasn’t worked, and in contrast, recent experience in San Diego shows that simply lessening parking requirements produced far more construction, including affordable construction than under the more tortured negotiation approach. As Owens writes:
. . . after parking minimums near transit were abolished in 2018, density bonus units increased by five-fold. This means developers were more likely to provide on-site low-income units after reduction of parking requirements, not less (as predicted by planning value capture theory). And non-profit low-income housing developers massively increased their production during this period. . . . Real life evidence does not suggest that parking requirements are being traded for affordable units. . . . given what we have learned about the need to reduce auto emissions (EVs alone won’t do it, according to the California Air Resources Board), requiring parking as pretextual planning and praying that private developers will want to bargain it away is courting climate disaster.
New Knowledge
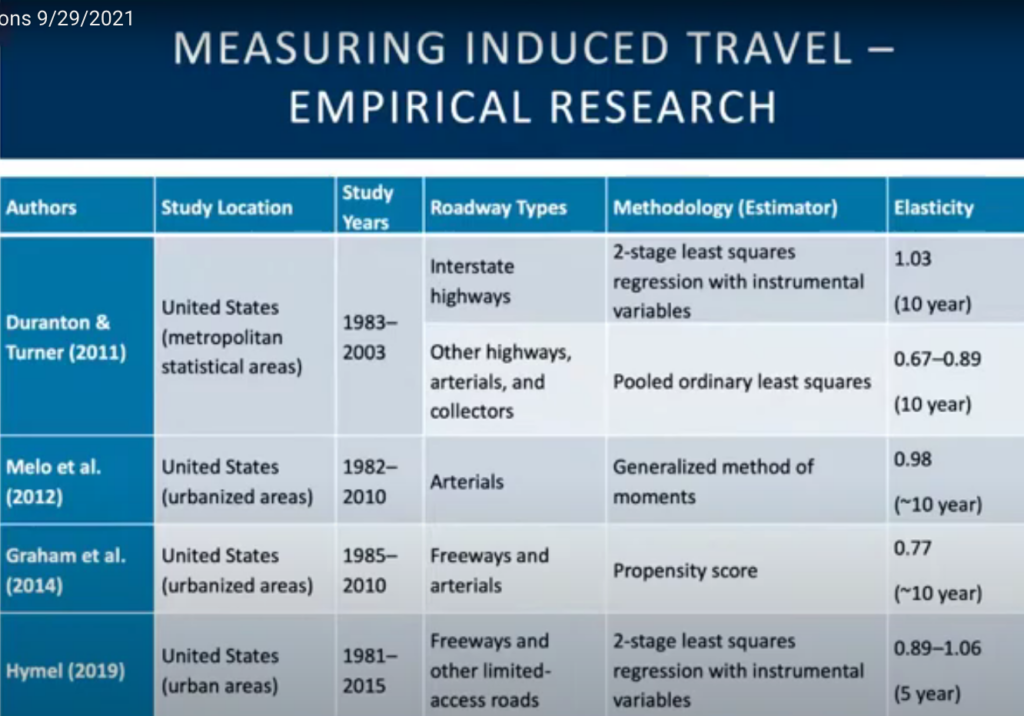
Explaining the induced demand calculator. UC Davis researcher Jamey Volker presented a webinar explaining the science basis of the Induced Travel Calculator. The calculator serves as the model for the Rocky Mountain Institute’s SHIFT calculator, and is also being used in California as part of environmental reviews for highway expansion projects. Volker’s presentation succinctly describes the key mechanisms behind induced travel, summarizes the growing body of literature that confirms the quantitative estimates of its impact, and discusses how the calculator can be applied in environmental reviews.

The key insight behind the theory of induced demand is that improvements to a roadway, such as additional lanes, or other measures that improve the flow of traffic, have the effect of lowering the “time cost” of travel. Faced with a lower time cost of travel, people’s behavior quickly changes: they take more trips, longer trips, trips to more distant destinations, and choose car travel more often. In addition, over time, household and business location decisions may shift to a more dispersed pattern. The net result of all of these behavioral shifts is to create additional travel, which quickly returns congestion levels to pre-improvement conditions.
A key problem is that the travel models used by state highway agencies don’t accurately reflect what’s known about induced demand. Volker explains:
Many models, and particularly the traditional four-step models do not include all the feedback loops necessary to capture the behavioral changes caused by capacity expansion. So, for example, not many models feed changes in estimated travel times into the trip distribution or trip generation stages of the model, and ignore improved travel times from a capacity expansion could increase the number of trips that households and freight operators choose to make, or cause them to choose more distant trip destinations.
Over the past decade, a series of econometric studies, chiefly in the United States, but also in Europe and Japan have confirmed the specific quantitative relationship between capacity expansions and increased traffic. As Volker summarizes the research, studies have generally converged on a “unit elasticity” of traffic with respect to capacity expansions: a one percent increase in capacity is associated with a one percent increase in vehicle miles traveled.
That’s important because in underscores the futility of adding capacity to try to reduce congestion: more capacity in urban areas simply generates more traffic, undercutting any time savings and increase traffic and greenhouse gas emissions.
Finally, Volker points out that the calculator provides a scientifically-grounded means of efficiently estimating the amount of additional vehicle miles traveled that would be generated by a highway expansion, and by extension, the amount of added pollution greenhouse gases.
. . . there’s a burgeoning movement here to look more induced travel, whether it’s under CEQA analysis or the NEPA analysis in another state, or a joint NEPA analysis in California.Induced travel is so important for these analyses and it’s also important for cost-benefit analyses; how much VMT your project causes has a direct relationship with how much air pollution or greenhouse gas emissions will be emitted, and also what the cost and benefits of the project will be. Is it going to actually reduce congestion and if so, for how long? That could significantly affect the benefit calculus of cost benefit analysis.
Caltrans has already started using the UC Davis calculator in its project assessments, and has provided funding for UC Davis to further refine the calculator. Other state DOT’s which profess to care about climate ought to be doing the same.
Dr. Jamey Volker, “Caltrans Planning Horizons: Induced Vehicle Travel in the Environmental Review Process.” Webinar. September 29, 2021

