Metro’s Climate Smart Strategy, adopted in 2014, has been an abject failure
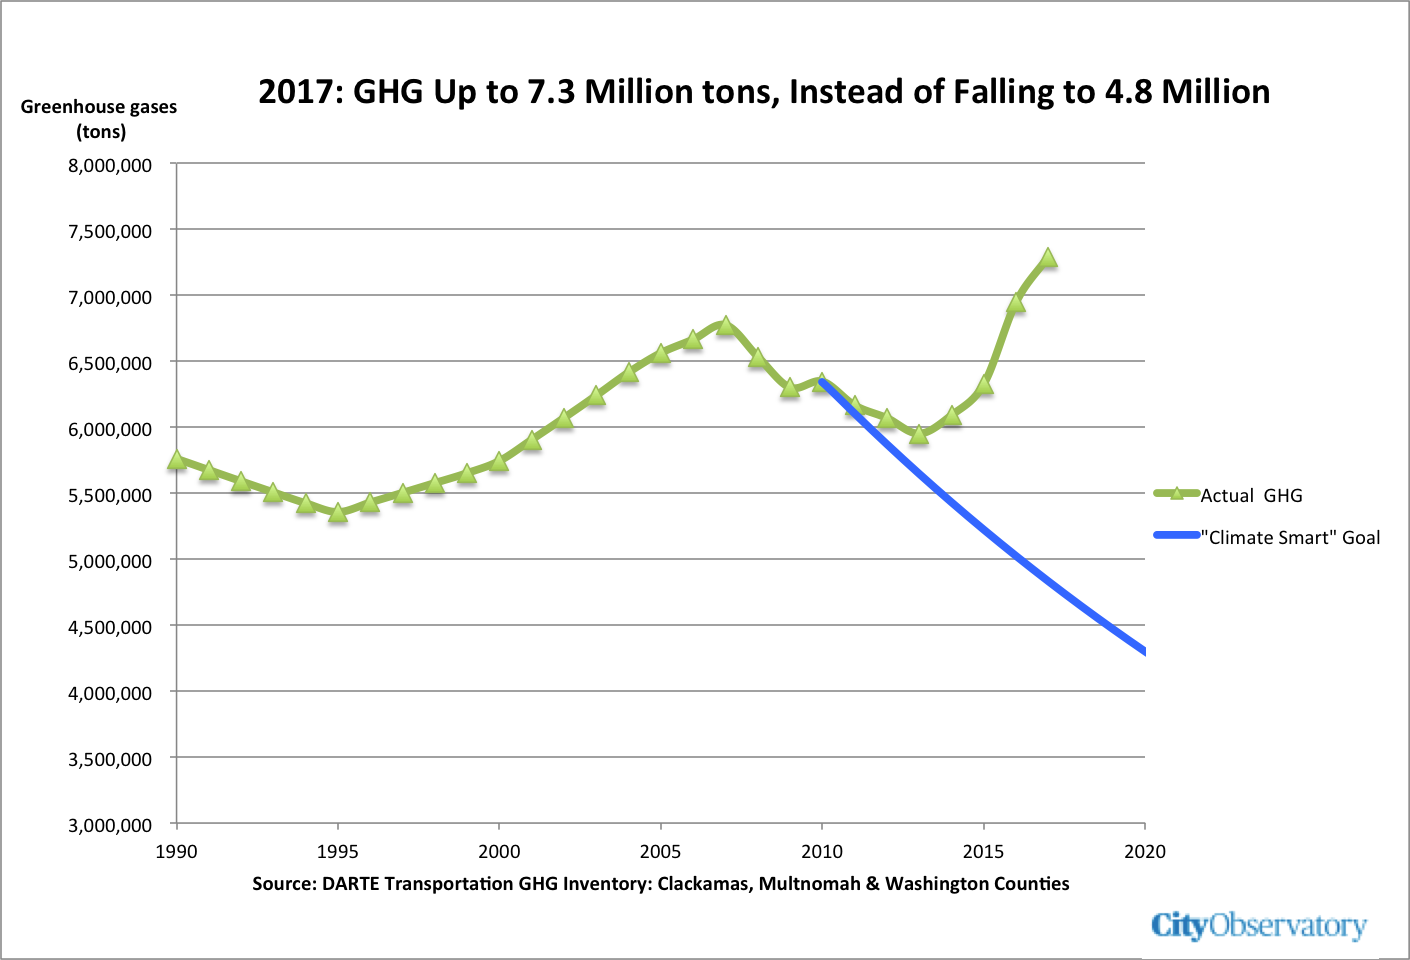
Portland area transportation greenhouse gasses are up 22 percent since the plan was adopted: instead of falling by 1 million tons per year, emissions have increased by 1 million tons annually, to more than 7 million tons, putting us even further from our climate goals.
Metro’s subsequent 2018 RTP has watered down the region’s climate effort far below what is needed to comply with Oregon’s statutory greenhouse gas reduction goal, based on the assumption that 90 percent of emission reductions would be accomplished with cleaner vehicles.
All of Metro’s key assumptions about transit, vehicle turnover, technology adoption, and driving, have been proven wrong.
The plan has set a goal for reducing vehicle miles traveled that is actually weaker than the reductions the region achieved in the decade prior to the adoption of the “Climate Smart Strategy.”
The agency has not acknowledged the failure of its climate efforts, and is at the same time moving forward to allow the Oregon Department of Transportation to build a series of freeway widening projects that will add more than 140,000 tons of greenhouse gasses per year.
Metro, Portland’s regional government, talks a good game when it comes to climate. It has adopted a so-called “Climate Smart” strategy, and a regional transportation plan that it claims will lead to a reduction in greenhouse gasses. But a close analysis of the Metro’s planning documents and other independent information shows the plan is failing, and is far too feeble to come anywhere close to achieving the state’s adopted legal goal of reducing greenhouse gasses by 75 percent by 2050.
1. We’re going in the wrong direction: Portland transportation GHG up 22 percent
The clearest measure of failure is the one million ton increase in annual greenhouse gas emissions in Portland over the past few years. Carbon emissions accounting is technical and complex, but for Portland, for the past five years, when it comes to transportation greenhouse gas emissions, and whether we’re making progress, there are just three numbers you need to know: 6, 5, and 7. In 2010, (the base year for Metro’s Climate Smart Plan), the tri-county area produced about 6 million tons of greenhouse gasses from transportation. The plan set a goal of reducing transportation greenhouse gasses by about 63 percent by 2035 (the plan’s terminal year), which means that to be on track, the region would need to lower its emissions to about 5 million tons of transportation GHGs by 2017. But the data from the DARTE national transportation greenhouse gas inventory shows that the region’s emissions increased to more than 7 million tons. So instead of reducing greenhouse gasses by at least a million tons, we’ve actually increased greenhouse gasses by more than a million tons. We’re not just “not making progress,” we’re going rapidly in the wrong direction. Since 2010, we’ve fallen about 2.5 million tons behind the path we need to be on in order to meet the goal laid out in Metro’s Climate Smart Strategy.
Metro’s monitoring report, prepared as part of the 2018 Regional Transportation Plan, fails to acknowledge that the region is manifestly failing to reduce GHGs.
2. Metro’s 2018 Regional Transportation Plan doesn’t even propose to get us to the adopted state GHG Goal
Metro’s climate plans are spelled out in two documents, a “Climate Smart Strategy” (CSS) adopted in 2014, which proposed a 20 percent reduction in vehicle miles traveled, and a subsequent 2018 Regional Transportation Plan (RTP). The adopted 2018 Regional Transportation Plan borrowed much of the rhetoric from the 2014 Climate Smart Strategy, but without any announcement or fanfare, radically watered down the region’s greenhouse gas reduction objective. The CSS set a goal of reducing GHG’s by 63 percent by 2035; the 2018 RTP modified this to a GHG reduction of only 19 percent by 2040 (RTP Table 7.31 “Projected Mobile Source Greenhouse Gas Emissions by Investment Strategy.).
The following chart shows the difference in the two plans. The starting dates for the two plans are set to the base years for their climate calculations (2010 for the CSS, 2015 for the RTP). The glide slope lines are computed as the average annual percentage reduction in greenhouse gases needed to reach the end year target.
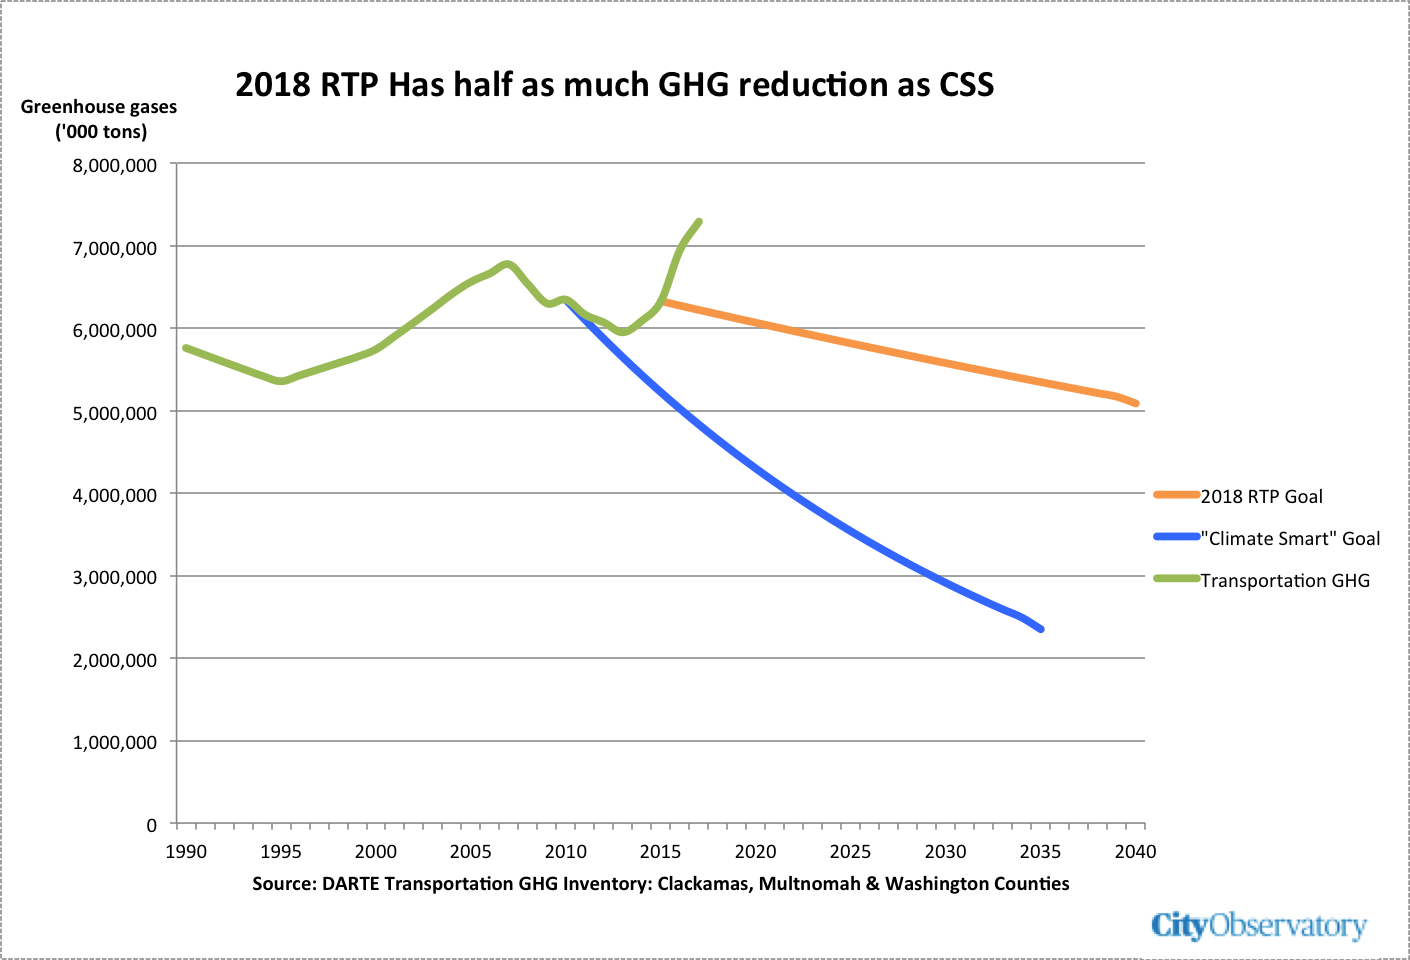
Metro’s Climate Smart goal falls far short of what’s needed to meet Oregon’s statutory greenhouse gas emissions reduction, and even further short of meeting Governor Brown’s Climate Emergency Executive Order—which calls for an 80 percent reduction in greenhouse gas emissions by 2050. Metro is relying as its justification for these goals a claim that is following guidance from LCDC. But in fact, Metro is planning for a reduction in vehicle miles traveled than is only one-fifth as much as called for in state regulations (see #4 below), and our analysis shows that overly optimistic assumptions used by LCDC mean that VMT reductions actually need to be much larger than specified in the LCDC targets (Appendix B). Not only is it failing to comply with the LCDC regulations (as explained here), those regulations have set planning goals that are now inadequate. Also: LCDC’s regulations don’t supersede or repeal the state statutory mandate to reach a 75 percent reduction in GHG by 2050, and Metro’s Climate Smart Strategy and 2018 Regional Transportation Plan are inadequate to put the region on track to do its share to achieve the 2050 goal of a 75 percent reduction in transport greenhouse gas emissions.
3. Metro’s plans assumes other people will reduce transport GHGs, not Metro, and its assumptions have been proven wrong
Both the Regional Transportation Plan and the earlier Climate Smart Strategy rely almost entirely on optimistic assumptions about vehicle fuel economy, electrification, fewer trucks and SUVs, and cleaner fossil fuels. Roughly 90 percent of the reduction in per capita greenhouse gasses claimed by Metro come from actions over which it has no control. Its strategy is far less about what it will do to address climate change, and almost entirely wishful thinking about what others will do.
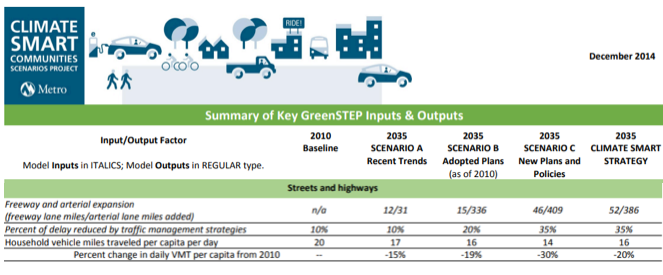
Metro’s 2014 Climate Smart Strategy was based on assumptions that other entities (some unspecified combination of the federal government, state government, auto makers, car buyers) would take actions that reduce greenhouse gas emissions per vehicle mile traveled by 38 percent between 2010 and 2035. Metro’s plan actually contains no actions that influence per vehicle mile vehicle emissions.

(Source: Metro Climate Smart Strategy (2014). Right hand column data supplied by City Observatory; sources noted in Appendix B).
Similarly the 2018 RTP is based on even more aggressive assumptions about cleaner vehicles, drawn from the Oregon Department of Transportation’s Statewide Transportation Strategy.
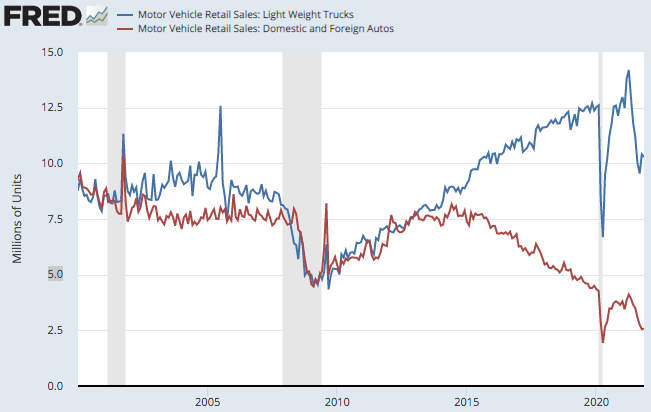
None of the key assumptions in Metro’s climate plans are being realized. Federal fuel economy standards are being watered down, SUV and light truck sales are more than double market share assumed in Metro’s modeling, older, dirtier vehicles are lasting longer and being driven further, and vehicle electrification is proceeding too slowly to achieve adopted goals. Further data for each of these points is provided in Appendix B.
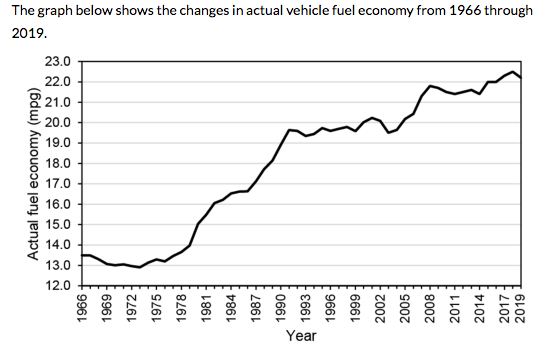
- Metro assumed that average vehicle fuel economy would more than double. Actual fuel economy has barely moved in the past decade.
- Metro assumed that people would buy new cars more often, and scrap old cars more quickly causing average vehicle age to decline (get newer) by 25 percent, with average age declining from 10 years to 8 years. Instead, average vehicle life has increased to almost 12 years.
- Metro assumed most people would buy more small and efficient passenger cars, and fewer trucks and SUVs. Metro assumed that lighter more efficient passenger cars would make up 70 percent of the market, outselling trucks and SUVs more than 2-to-1. The opposite has happened: the market for passenger cars has collapsed to less than 30 percent market share.
- Metro didn’t make explicit predictions about vehicle electrification, but data from ODOT show that by 2029, no more than 3 percent of the state’s light duty vehicle fleet is expected to be electric.
4. Metro has a feeble and ever-shrinking goal for reducing vehicle miles traveled.
There are basically two ways to reduce greenhouse gas emissions: Cleaner cars or less driving. Metro policies have almost no influence on cleaner cars; in contrast, Metro’s policies, including land use planning, permitting more road capacity, and assuring alternatives, like biking, walking and transit, can all influence the amount of driving.
It’s a bit of a simplification, but these two concepts can be reduced to two measures: Grams of carbon per vehicle mile (cleaner cars), and vehicle miles traveled (less driving). As discussed above, Metro’s RTP is overwhelmingly counting on “cleaner cars” as providing roughly 90 percent of the reduction in transportation GHGs through 2040, and counting on less driving to provide only about 10 percent of greenhouse gas reductions.
For any given level of pollution per mile, increases in vehicle miles traveled result in increases in greenhouse gas emissions. Transportation planners focus on “vehicle miles traveled per capita” to measure the level of driving in a metropolitan area.
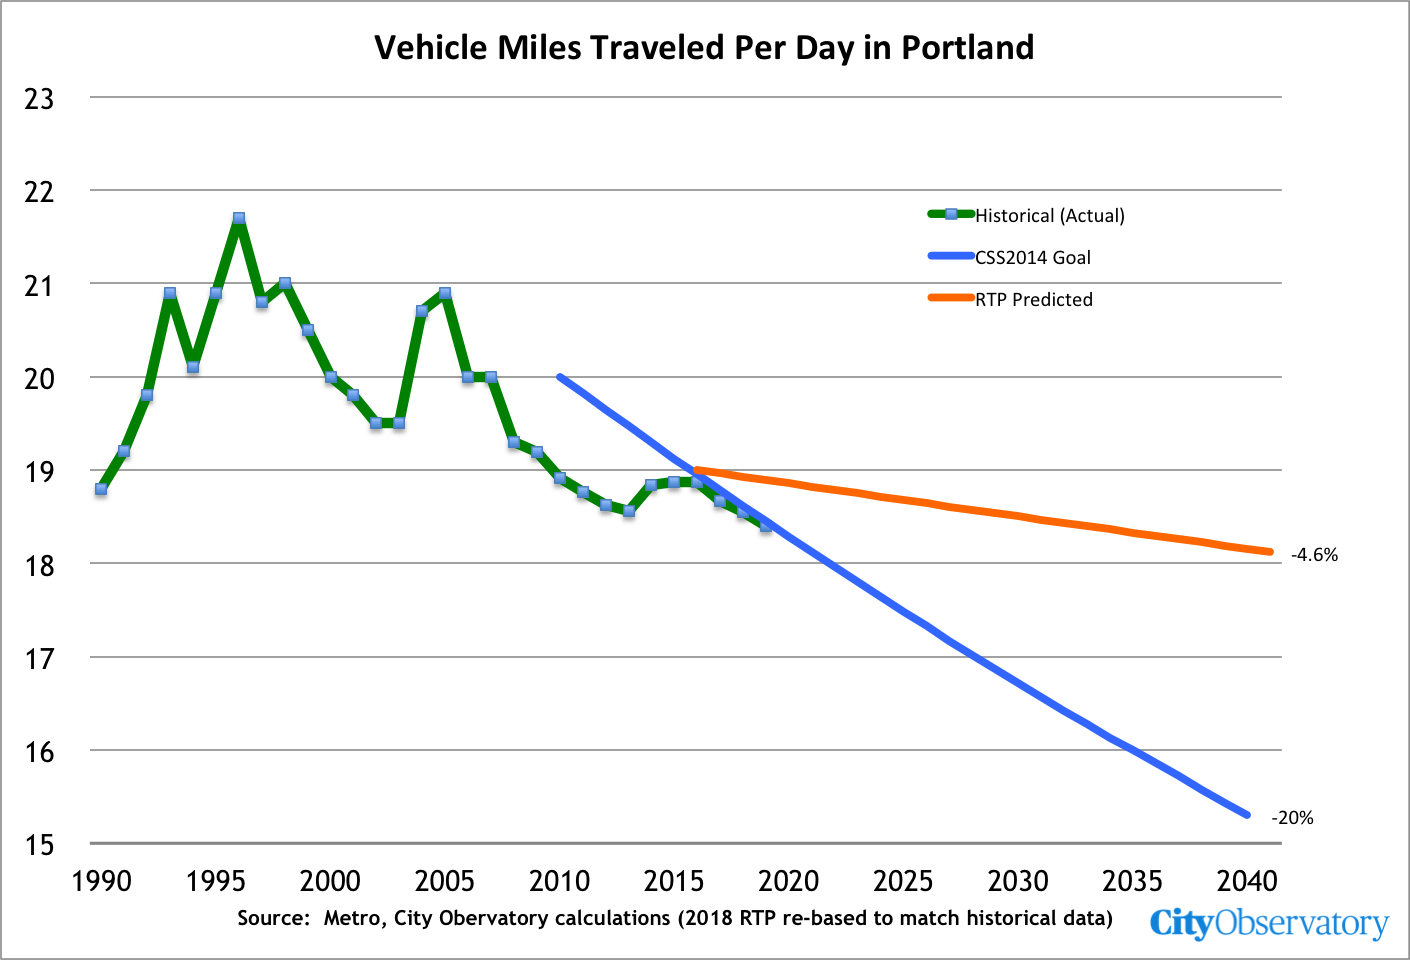
Metro’s initial plan, the 2014 Climate Smart Strategy, set a goal of reducing per capita VMT by 20 percent by 2035. As presented in the original Climate Smart Strategy, Metro identified a goal of reducing VMT per capita by 20 percent from 2010 levels, from 20 miles per person per day to 16 miles per person per day. (This is from page 65 of Metro’s 2014 Climate Smart Strategy).
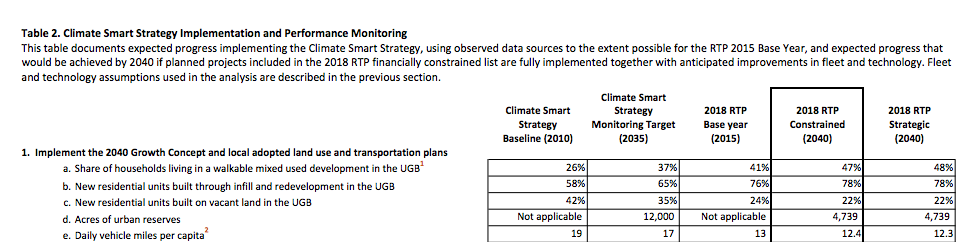
In the 2018 RTP, Metro changed the yardstick and twice moved the goalposts on VMT reductions. First, it changed the yardstick, measuring VMT per capita in a much narrower way (looking only at miles traveled by regional residents inside the metropolitan planning area). The new yardstick looked at a base of 13 miles per person per day, compared to 20 miles per person per day. This new system of measurement excludes looking at about one-third of all vehicle travel in the Portland region.
Second, it retroactively changed the reported goals for the Climate Smart Strategy, lowering the baseline level of travel to 19 miles per person per day, and raising the 2035 “monitoring target” to 17 miles per day. So while the as published 2014 Climate Smart Strategy visualized a 20 percent reduction in VMT from 20 to 16 miles per day; the 2018 RTP reported that the Climate Smart Strategy envisioned only about a 10 percent reduction in VMT, by two miles per person per day, from 19 to 17 miles.
Third, the 2018 RTP presented the 10 percent reduction as a goal, but then substituted the new yardstick (i.e. 13 miles per person per day in the base year, now 2015, and pushed out the terminal year for reaching the new goal of 12.4 miles per person per day to 2020. 2018 RTP (Chapter 7 “Outcome Measures”) and Appendix J “Climate performance monitor”).
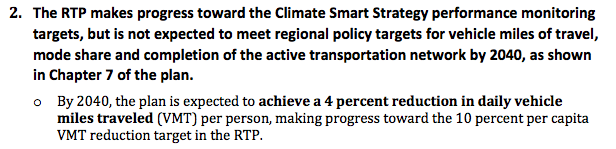
But while Metro proclaimed as its goal reducing vehicle miles traveled by 10 percent, the plan’s analysis concluded that the measures included in the RTP would only reduce driving by a fraction of that amount by 2040. The climate analysis contained in the 2018 RTP called for reducing VMT by 10 percent per capita, but the performance monitoring report in Appendix J of the 2018 RTP concludes that full implementation of the RTP would result in a decrease of more than 5 percent, “not reaching the target.” The actual figures shown in the report (a decline from 13 miles per person per day to 12.4 miles per person per day) amounts to a 4.6 percent decline in VMT per capita.
Elsewhere, the RTP concedes that the plan will reduce per capita VMT by about 4 percent.
The reductions in vehicle miles traveled anticipated in the 2018 RTP are far smaller than needed to comply with LCDC regulations guiding climate planning. Metro would need to achieve VMT reductions of about 20 percent per capita to comply with these guidelines. The projected 4 percent decline in VMT/capita envisioned in the 2018 RTP is less than one-fourth the progress needed to meet the state guideline. In addition, as explained in Appendix B, the state target for VMT reduction is far too low to achieve the state’s greenhouse gas emission reduction requirements because state and local agencies have dramatically over-estimated likely progress in reducing vehicle emissions.
Actual Performance Compared to Metro Goals
To evaluate the VMT goal, it is necessary to put the vehicle miles traveled per person per day statistic in context. Metro, using data from the Federal Highway Administration has produced a data series showing historical VMT per capita for the Portland area going back to 1990.
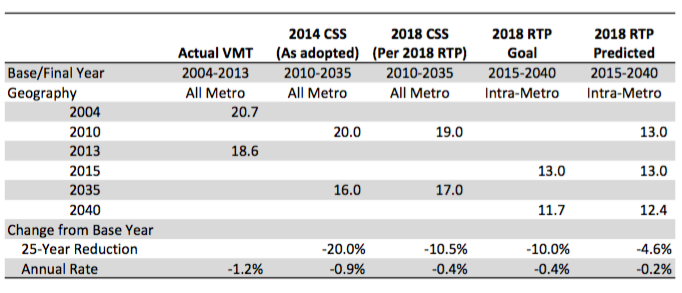
Vehicle Miles Traveled, a core measure of transportation activity, which has been trending down since the late 1990s, has essentially stopped declining. In the decade before the Climate Smart Strategy was adopted, Portland area VMT per capita was declining at a rate of about 1.2 percent per year. The Climate Smart Strategy failed to even plan for continuing that trend; according to Metro’s own estimates, since 2014, VMT per capita has almost flat-lined, declining just 0.15 percent per year. The 2018 RTP has even lower expectations, lowering VMT by just 4.6 percent over the 25-year period from 2015 to 2040, which works out to an annual decline of 0.2 percent per year.
Metro’s 2018 RTP predicts that the agency’s policies will produce a far slower rate of VMT reduction that the region accomplished over the period 2004-2013 (prior to the adoption of the first Climate Smart Strategy). The 2018 RTP lowers the VMT reduction goal set in the 2014 CSS by more than 75 percent, from a 20 percent reduction over 25 years to a 4.6 percent reduction. That’s not enough of a reduction in driving to meet the targets called for in LCDC regulations, nor is it enough to achieve the state’s goal of reducing greenhouse gas emissions to 25 percent of their 1990 levels by 2050.
Summary of Metro Area VMT Reduction Performance and Goals
5. Transit Ridership, a key factor in reducing GHG, is failing to meet projections.
One key strategy to reduce greenhouse gas emissions is to shift trips from private automobiles to mass transit. Metro’s regional transportation plan calls for reducing vehicle miles traveled and decreasing greenhouse gas emissions by increasing the share of the region’s trips taken by bus and light rail. Each successive regional transportation plan since 2004 has projected that transit ridership levels under the plan will double in the next ten to twenty years.
Metro’s transit ridership projections have been grossly overstated in every Regional Transportation Plan, and TriMet’s operating plans show it has no intention (or ability) to carry as many passengers as the RTP assumes in order to make progress. The RTP assumes transit ridership will more than double between 2015 and 2040, from 250,000 originating riders to more than 600,000 originating riders, which shows no signs of happening. Even prior to the Covid pandemic, transit ridership was falling, down 7 percent from its peak in 2012. Rather than growing at more than three and a half percent per year—pre-pandemic—ridership has been declining at about one percent per year.
![]()
Every RTP has consistently predicted high levels of transit growth that have not materialized. The 2004 RTP predicted 2020 ridership would be 383,000, the 2010 RTP predicted 2020 ridership would be 349,000, the 2014 RTP predicted ridership in 2020 would be 326,000; actual ridership (as noted) is about 250,000 (pre-Covid).
The consistent failure of the region to realize the gains in transit ridership called for in the last four RTPs suggests that we will need to do much more to reduce VMT and greenhouse gasses. It also suggests that Metro’s transit ridership model is biased and inaccurate.
6. Approving more highway capacity would increase greenhouse gas emissions
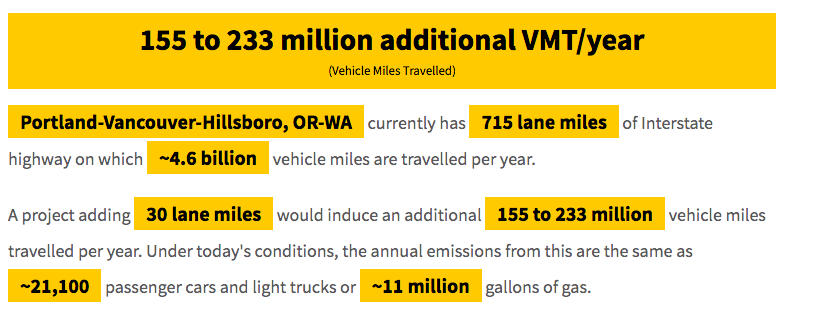
Even though its climate plan is failing, Metro is giving the Oregon Department of Transportation the greenlight to spend billions of dollars expanding area freeways that are likely to lead to huge increases in greenhouse gas emissions. The RMI induced travel calculator, calibrated based on award-winning, peer-reviewed research from the University of California, Davis, estimates that the Rose Quarter Freeway widening project will produce an addition 40,000 tons of greenhouse gasses per year and the revived Columbia River Crossing will likely produce a further 100,000 tons of greenhouse gasses per year.
The Induced Travel Calculator shows that revived Columbia River Crossing project (now rebranded as “I5 Bridge Replacement Program“) would produce an additional 155 to 233 million miles of travel annually, leading to burning an additional 11 million gallons of gas. That in turn would translate into additional annual greenhouse gasses of about 100,000 tons (at roughly 20 pounds of CO2e per gallon of gas).
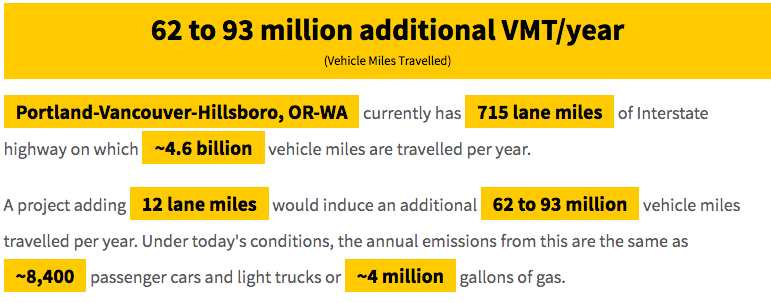
The same calculator shows that the proposed widening of I-5 at the Rose Quarter will likely produce 60 to 90 million additional vehicle miles of travel per year, lead to burning about 4 million additional gallons of gas per year, and generate about 40,000 tons of additional greenhouse gases.
7. Metro isn’t pursuing pricing, which has been proven to be effective
Metro has taken no action to implement any of the pricing options that its own research rates as “highly effective” in reducing greenhouse gas emissions, including road pricing, gas taxes, vehicle miles traveled fees, parking charges and pay as you drive insurance. It’s gone out of its way to gainsay effective pricing measures, and used its public relations budget to promote false claims about vehicle idling.
One key reason for the increase in driving since 2014 has been the significant decline in oil and gasoline prices. Metro’s model, calibrated based on behavioral responses to the earlier higher prices, and the assumption that declining prices wouldn’t affect demand for travel, have failed to predict the increase in driving.
8. Metro has done nothing to fix its failing climate strategy
In spite of the failure to advance its goals, Metro has proposed no new or stronger measures to reduce GHGs, even though its climate smart initiative says it will do so. Metro’s 2014 Climate Smart Strategy (on page 1) promised to periodically check to see whether progress was being made toward the goals it laid out. If further promised:
If the assessment finds the region is deviating significantly from the Climate Smart Strategy performance monitoring target, then Metro will work with local, regional and state partners to consider the revision or replacement of policies, strategies and actions to ensure the region remains on track with meeting adopted targets for reducing greenhouse gas emissions.
Similarly, the 2018 RTP (Appendix J) makes the same commitment on page 10.
The data from DARTE show that Metro is plainly not meeting the initial greenhouse gas reduction goals set in the initial Climate Smart Strategy, nor is it on track to meet the much watered-down goal laid out in the 2018 RTP. Similarly the “fleet and technology assumptions” built into both the CSS and the RTP have been proven wrong. Yet the Metro has not acknowledged either of these basic facts, nor has it proposed any additional steps to reduce current high levels of greenhouse gasses to get them back on track. Instead, it is going along with proposals from the Oregon Department of Transportation to spend billions widening area highways—which will add to Metro area greenhouse gasses. (As explained in Appendix B, both the Land Conservation and Development Commission and the Oregon Department of Transportation have likewise failed to acknowledge increasing transportation greenhouse gas emissions, and have failed to update their incorrect modeling assumptions, and to revise policy targets, as both have committed to in their plans and regulations).
Appendix A. Sources, Data and Methodology
Metro’s description of its climate strategy is taken from the 2014 Climate Smart Strategy and the 2018 Regional Transportation Plan.
Data on Portland area transportation greenhouse gasses are from the DARTE national transportation greenhouse gas emissions inventory, which contains estimates covering the years 1990 through 2017 at a very fine geographic scale. DARTE is the most comprehensive and uniform national estimate of local transportation greenhouse gas emissions. We report DARTE data for Clackamas, Multnomah and Washington counties, the geography most closely corresponding to the Portland “metropolitan planning area” used in Metro’s 2018 RTP. For purposes of comparison, we factor up Metro’s figures by 18-20% (depending on year) to be directly comparable to the larger geography of the DARTE database.
We compute emission reduction trajectories needed to meet state greenhouse gas requirements, and trajectories implied by Metro’s plans by computing a constant annual (negative) growth rate—or “glide slope”—needed to move from base year to final year emissions levels. For example, in 1990, Portland area transportation GHGs were 5.7 million tons; a 75 percent reduction from that level (to meet the state goal) implies a 2050 level of emissions of 1.4 million tons. To reach that level from 2013 actual emissions of 6.0 million tons requires a reduction of 3.8 percent per year for each year from 2013 through 2050. We compute glide slopes for other plans (ODOT’s STS; Metro’s RTP) in the same fashion.
The 2018 RTP contains two conflicting estimates of how much reduction the plan will actually provide. Chapter 7 of the RTP says that the 2015 level was 13 VMT per capita per day, and that the plan would reduce this to 12.3 VMT per capita per day by 2040. The Climate Smart Appendix to the report, Appendix J, says that the 2015 baseline level was 12.7 VMT per capita per day, and would be reduced to 12.3 VMT per capita per day by 2040. Chapter 7 figures imply a 4.6 decline in VMT by 2040; Appendix J implies the decline will be only 2.3 percent. We assume that the correct level of VMT in the base years is 13 VMT per person per day, corresponding to a 4.6 percent decline in VMT by 2040.
Appendix B: Metro and State incorrect assumptions about cleaner vehicles
Guided by state rules, Metro’s emissions modeling assumes “cleaner cars” through a combination of improved fuel economy (higher MPG standards), faster vehicle turnover (replacing dirty old cars with cleaner new ones), and smaller, more efficient vehicles (more cars, fewer trucks and SUVs). None of these assumptions have been realized in the time since Metro and state climate plans were published.
1. Fleet fuel economy has not measurably improved. Modeling for the climate smart initiative assumed rapid and prolonged improvements in vehicle fuel economy, due to rising federal fuel economy standards. But the impact of increased new car standards on actual levels of real-world fuel efficiency have been modest. Here is the data on actual average fuel economy through 2019. Average fleet economy was about 22.2 miles per gallon in 2019, far short of the targets set in the Metro modeling.
 2. Average vehicle age is 50 percent older than assumed modeling. According to the Bureau of Transportation Statistics, the average age of an automobile in the United States is now 11.9 years, up from 10 years in 2004. The Metro Climate Smart Plan assumed that the average age of a vehicle would decline by about 25 percent, from 10 years to 8 years; instead, the average age of a vehicle has increased by almost 20 percent, from 10 years to almost 12. The average vehicle today is now 50 percent older than assumed in the Metro climate plan.
3. Trucks and SUVs are displacing passenger cars, not the other way around. A critical assumption in the Climate Smart Plan and the RTP is that consumers would buy more and more passenger cars, and fewer trucks and sport utility vehicles. In fact, the opposite has happened: since 2015—when sales of cars and SUVs/Trucks were roughly equal—it’s now the case that truck/SUV sales account for roughly 75 percent of all new vehicle sales.
4. Vehicle electrification is occurring very slowly. Many like to assume that electric vehicles will quickly and easily reduce carbon emissions. Yet electrification is happening too slowly and on far too small a scale to materially affect transportation greenhouse gas emissions. ODOT’s October 2019 revenue forecast predicts the size and composition of Oregon’s light duty vehicle fleet through 2029. They forecast that in 2029 Oregon will have about 3.9 million light duty vehicles, but only about 120,000 of them (total) will be electric vehicles. That’s just 3 percent of the fleet; 97 percent will still be internal combustion engines. The slow adoption of electric vehicles, as depicted in ODOT’s official revenue forecasts, means the agency believes that its efforts to promote EVs won’t have a significant effect on the state’s greenhouse gas emissions any time in the next decade, at least.
5. State forecasts of future vehicle emissions have been proven wrong. A critical part of any transportation greenhouse gas emission strategy is assumptions about the improvements in the cleanliness of future vehicles.
Metro’s climate planning is based, in part, on rules adopted by the State Land Conservation and Development Commission (LCDC) directing metropolitan planning organizations around the state to work toward complying with the state’s adopted greenhouse gas emission goals.
In 2017, LCDC produced a report detailing its analysis of how these planning organizations were to plan for reducing transportation-related greenhouse gas emissions. As directed by the Legislature, the planning process was to give local planners guidelines on the proportion of reduction in greenhouse gasses that could be expected from changes in vehicle efficiency and electrification.
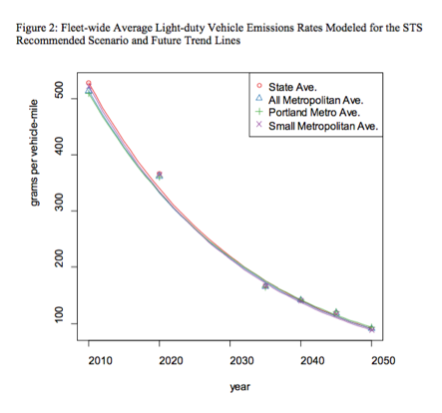
LCDC based its rules on emission reduction assumptions taken from the Oregon Department of Transportation’s 2012 State Transportation Strategy (STS). LCDC constituted a technical committee and retained Brian Gregor (formerly of ODOT) to prepare a technical analysis, drawing on the STS to estimate how much reduction in greenhouse gasses could be expected from improving technology and changing vehicle mix. Gregor’s analysis predicted that vehicles would become dramatically cleaner over the next several decades, with a reduction in greenhouse gasses per mile traveled of more than 80 percent by 2050. Gregor’s analysis concluded that LCDC should assume that emissions per vehicle mile would decline by 67 percent by 2035, the terminal year for local land use plans. Importantly, LCDC wrote Gregor’s assumptions about future vehicle emissions into its administrative rules (OAR 660-044-0020).
Gregor’s analysis assumed that average vehicle emissions would decline to about 90 grams per mile by 2050. Gregor reached these conclusions by assuming that fuel efficiency and zero emission vehicle regulations would steadily improve new vehicle emissions, and that over time, these would change overall fleet emissions. The report assumed that average vehicle age would be 11 years, and that average fleet vehicle economy in any year would be equal to the average new car fuel economy for vehicles sold 11 years earlier. Gregor’s calculations imply a base level of emissions of about 520 grams per mile in 2005. New cars would be assumed to achieve 100 grams per mile in 2035, and the fleet as a whole would achieve 100 grams per mile in 2046, and about 90 grams per mile by 2050. Gregor summarized his assumptions in this chart:
As Gregor writes:
Average vehicle emissions rates would need to decline by a little over 4% per year from the 2010 estimated average in order to achieve the recommended level in 2050.
It is now 2021, and we have roughly a decade of data on the actual rate of improvement in new vehicle emission rates. According to the Environmental Protection Agency, average emissions for new light vehicles have fallen from about 450 grams per mile in 2005 to about 348 grams per mile in 2021. By Gregor’s approach, at that rate of improvement, average fleet efficiency in 2032 (eleven years from now) will be about 348 grams per mile. In the past decade (2010 through 2021), the number of grams per mile has declined at about a 1.1 percent annual rate. This is roughly only one-fourth the rate of improvement assumed in Gregor’s calculation and LCDCs target rules.
The following chart shows the difference between Gregor’s estimate of the path of vehicle emissions (blue), and the actual improvement in emissions between 2010 and 2021 (green). The red dashed line shows the trend in vehicle emissions based on the 2010 to 2021 growth rate of -1.1 percent per year extended through 2050.
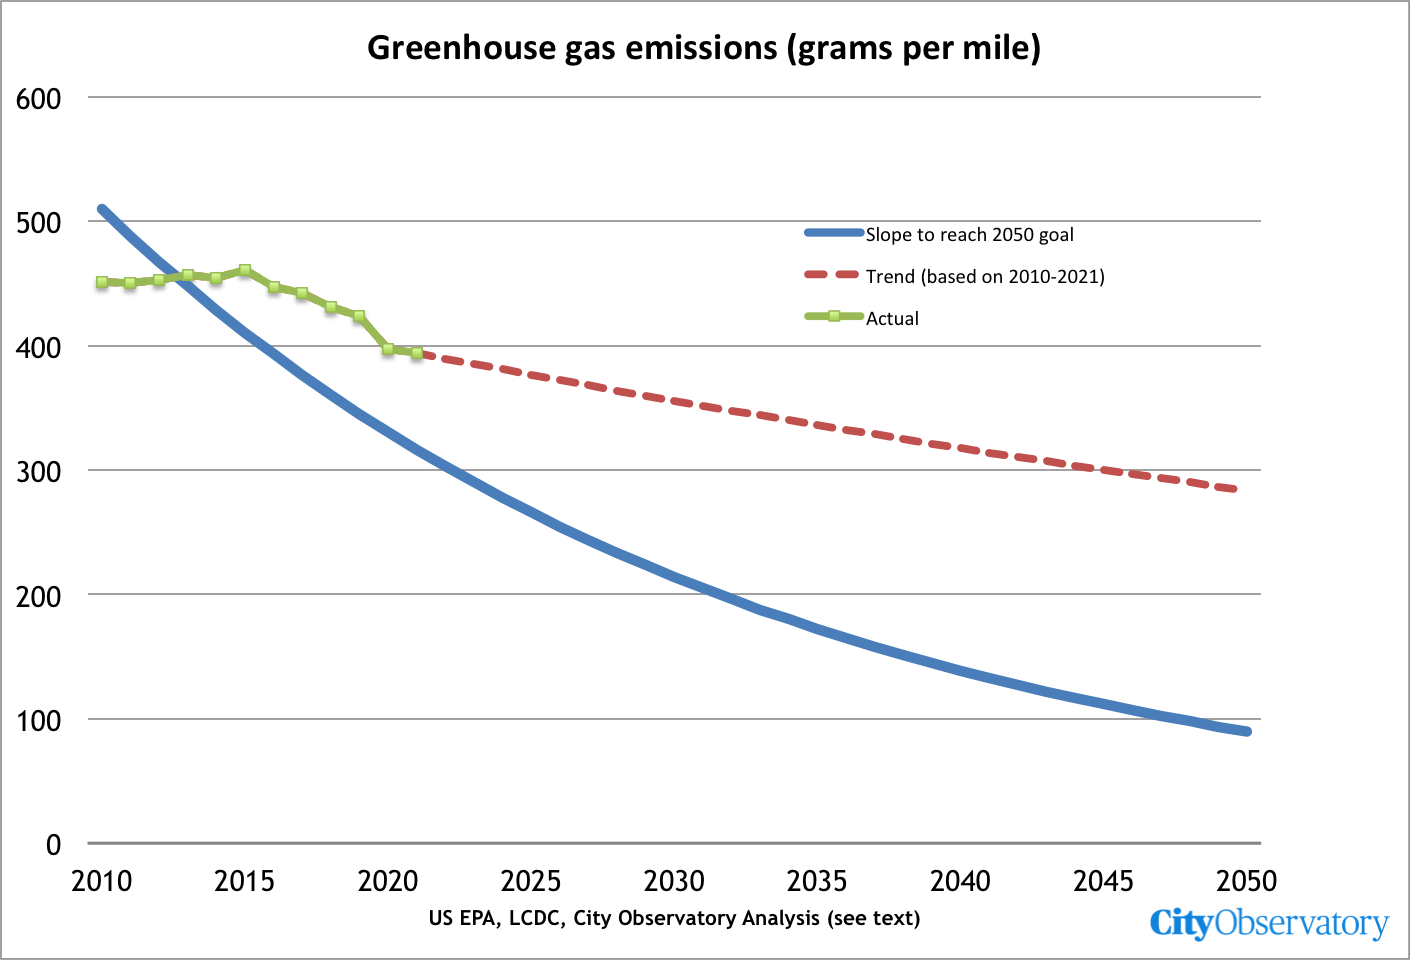
At current rates of improvement, per mile emissions are likely to be almost three times higher in 2050 than forecast in Gregor’s model, i.e. almost 300 grams per mile, rather than less than 100 grams per mile.
Achieving a reduction in greenhouse gas emissions is driven by the combination of cleaner vehicles and less driving. If vehicles become cleaner at a slower rate, then bigger decreases in driving (VMT/capita) are needed to achieve state goals. Gregor creates an equation showing how these factors determine the expected reduction in emissions.
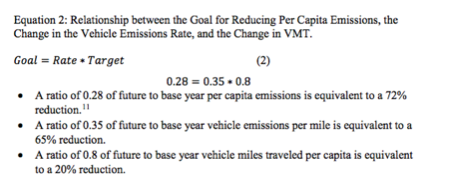
Gregor estimates that we need to reduce per capita emissions to 28 percent of base levels (i.e a 72 percent reduction). He assumes that cleaner vehicles will do the lion’s share of this work. His assumed 66 percent reduction in the rate of emissions per mile, means miles per capita need to be reduced about 20 percent.
The much lower rate of improvement in cleaning up vehicle emissions that we’ve actually experienced means that proportionately more of the task of reducing greenhouse gasses will need to be met, per Gregor’s own methodology, by reducing vehicle miles of travel. At the current rate of improvement of vehicle emission reduction, in 2035, the average vehicle will still emit about 336 grams per mile, just a 25 percent reduction from base levels. In order to meet the state’s target of reducing per capita emissions to 28 percent of base levels by 2035, that means per capita vehicle miles of travel need to fall by 66 percent. (The following table uses Gregor’s Equation 2 to compute the needed “target” level of VMT reductions consistent with various rates of improvement in vehicle emissions).
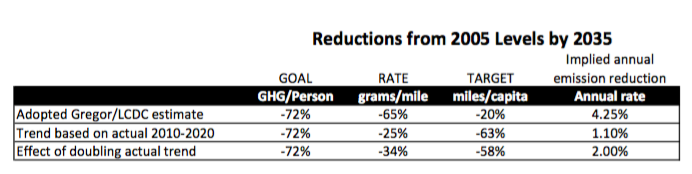
As show in the final line of the table, even if the annual rate of improvement doubles from its current rate to 2 percent per year from now through 2035, we would have to reduce vehicle miles traveled per capita by more than 50 percent.
In effect, the dramatic shortfall between Gregor’s 2016 report, and the actual 1.1 percent improvement in GHG/mile is the combined effect of the factors described in this section (a heavier, truck and SUV oriented fleet, slow improvements in fuel efficiency, slower vehicle turnover and slow electric vehicle adoption.
LCDC and ODOT have failed to re-examine their policies in light of forecast errors
It is difficult and uncertain to make reliable and accurate projections about the future. That is why analysts typically couch their predictions in terms of the assumptions made to produce them, and why policies and reports relying on such forecasts frequently promise to revise their estimates as more and better information becomes available.
It’s important to note that Gregor’s predictions are based only partially on current law or policy, and rely heavily on assumptions that federal and state governments will devise, adopt, implement and enforce a whole series of new and more stringent policies to reduce vehicle emissions. Gregor’s report made it clear that assumptions about improving vehicle economy were based on optimistic speculation about future federal and state policy.
The members on the Core Tech Team from the Departments of Environmental Quality and Energy agreed that the STS “trend line” is a reasonable reflection of goals that California, Oregon, and other states participating in the multi-state ZEV standards wish to achieve. They caution, however, that this planning trend does not reflect recent trends in vehicle fuel economy. Substantial efforts on the part of states and the federal government will be necessary to make this planning trend a reality. [Emphasis added].
A footnote on page 30 of the report makes this point even more clearly:
It is important to note that these ‘trend lines’ represent the trend in the model results given the vehicle assumptions in the STS recommended scenario. They do not represent an extrapolation of past trend. [Emphasis added].
The LCDC report relying on Gregor’s estimates implicitly acknowledges the need to update these forecasts as better information becomes available. The LCDC goals were developed over several years from 2011 through 2016; The final rules were revised from earlier drafts explicitly because of the availability of additional information on vehicles and vehicle emission rates. LCDC elected to tie its estimates of vehicle emission rates to those in ODOT’s STS for consistency with state efforts, and so that as the STS was updated, so too would be expectations about local targets.
If the STS is adjusted to account for changing assumptions to vehicles, fuels, and technology, the targets can be similarly adjusted to compensate for the updated assumptions. (page 9). [Emphasis added].
However, while the responsible state agencies (ODOT and LCDC) acknowledged the need to change targets as new information became available when targets and the STS were first prepared a decade ago (in 2011 and 2012), they’ve done little since to respond to new information. ODOT prepared its first STS Monitoring Report in 2018 and found that progress on fleet, fuels and vehicle technology was much less than what it had forecast in the STS in 2012, and as a result that the state was way behind in meeting emissions goals. Since that finding ODOT has done nothing to either revise its estimates of future vehicle emissions rates to reflect this new information or, more importantly, identify actions needed to get the state back on track. Instead, ODOTs Monitoring Report obliquely concludes that unspecified state policy-makers will need to decide what to do next.
LCDC’s decision to tie its targets to the STS—a decision which at least promotes consistency—means that ODOT’s failure to update the STS means LCDC policy remains based on outdated, inaccurate estimates until ODOT chooses to update the forecasts in the STS—something not on ODOTs schedule, despite Governor Brown’s Executive Order which directs the agency to do everything in its power to implement the STS. LCDC has also failed to follow its own administrative rules which require it to re-appraise the validity of the emissions assumptions on which the rules were predicated:
Review and Evaluation of Greenhouse Gas Reduction Targets
(1) The commission shall by June 1, 2021, and at four year intervals thereafter, conduct a review of the greenhouse gas emissions reduction targets in OAR 660-044-0020 and 660-044-0025.
(2) The review by the commission shall evaluate whether revisions to the targets established in this division are warranted considering the following factors: . . .
(e) Additional studies or analysis conducted by the Oregon Department of Transportation, the Department of Environmental Quality, the Oregon Department of Energy or other agencies regarding greenhouse gas emissions from light vehicle travel, including but not limited to changes to vehicle technologies, fuels and the vehicle fleet; [Emphasis added].
ODOT’s own STS monitoring report concedes that vehicle technologies, fuels and the composition of the vehicle fleet are not changing as anticipated in the STS, making the assumptions underlying LCDC’s rules invalid. LCDC (and ODOT) have both ignored data from “other agencies”—in this case, the US Department of Energy, sponsor and publisher of the DARTE transportation greenhouse gas database—showing that Oregon greenhouse gas emissions have increased, rather than decreasing, as called for in both agency’s plans, and state statute.
