Forget about lofty greenhouse gas reduction goals and vision zero, our real climate and transportation policy is cheap gas
The fall in gas prices in 2014 led to more driving, more SUV purchases, less transit ridership, more deaths and more greenhouse gas emissions
In retrospect, 2014 was a turning point for driving, climate and safety. What happened that year reversed or undid many positive changes in US transportation and climate trends. Up until 2014, traffic deaths had been declining, driving was basically flat, people were buying more cars and fewer SUVs, transit ridership was up. After 2014, all of those indicators got worse. Understanding why this happened should provide us with a keen insight about the importance of prices to all our important policies.
In life, there are pivotal moments when things change. As the Bard wrote,
There is a tide in the affairs of men, Which taken at the flood, leads on to fortune. Omitted, all the voyage of their life is bound in shallows and in miseries. On such a full sea are we now afloat.
The summer and fall of 2014 was one of those turning points; the event was noticed at the time, but its effects have become prominent only with the passage of time. The event was the collapse of global oil prices, which in a short period of weeks caused a dramatic decline in gasoline prices. As any economist would expect, that decline in prices generated a change in consumer behavior. With the benefit of five years of data since the oil price collapse, we can now trace out the effects of cheaper gas on driving, pollution, traffic deaths and transit ridership. We can also see its reflections in the market for vehicles. This analysis looks back at the changes in gasoline prices and driving, crash deaths, pollution, transit use and car-buying from 2014 through the onset of the pandemic in early 2020.
The Inflection Point
In the third quarter of 2014, gas prices in the US collapsed. From March 2011 through August 2014, gas prices in the US averaged $3.57 per gallon. From November 2014 through the end of 2019, gas prices averaged $2.47, more than 30 percent less in nominal terms.
This phase-change in gas prices from consistently more than three and a half dollars a gallon to consistently less than two and a half dollars a gallon had a clear impact on behavior. The third quarter of 2014 was an inflection point in US transportation, triggered by a sharp decline in gas prices.
It led to more driving, more greenhouse gases, more road fatalities.
It led to a shift in consumer purchases from cars to SUVS.
It caused a decline in transit ridership.
Prior to 2014, the nation was making progress or holding its own on key indicators of a better transportation system. Americans were driving less, and riding transit more. Greenhouse gases from transportation had peaked, and were not increasing. Road fatalities had flatlined. After the inflection point, in the third quarter of 2016, every one of these indicators deteriorated.
Collapsing oil and gas prices
Except for a short, sharp dip during the depths of the Great Recession, oil prices remained near $100 per barrel from 2006 through 2014. The following chart shows the prices of a barrel of oil (the green line, representing the reference price for a barrel of West Texas Intermediate), and the retail price of a gallon of gasoline (the red line). The two prices are almost perfect correlated.
In June 2014, oil prices were above $100 per barrel, but over the next few months, the price of oil collapsed. By September, oil prices were below $50 per barrel–a 50 percent decline. Gasoline prices decreased by a similar amount. This third quarter collapse in energy prices was a major inflection point for the energy markets, with important implications for transportation.
Oil and Gas Prices, 2000 to 2019
More driving
Between 2011 and 2013, Americans drove an average of about 3 trillion miles per year. That figure had been declining in the mid-2000s due to higher prices and continued flat in the first four to five years of the economic recovery. Only after 2014 did driving tick up, to an annual rate of 3.2 trillion miles per year. Cheaper gas produced 200 billion additional miles of driving in the US. Up until 2014, per capita driving in the US was declining; after the inflection point Americans started driving more for the first time in a decade. The following chart shows in blue the total number of miles driven by Americans (monthly data reported on an annualized basis), and in red the nominal price of a gallon of regular gas. The decline in gas prices coincides almost exactly with the sharp increase in vehicle travel in late 2014 and early 2015.
Gas prices and total miles driven
If there is a hopeful sign in this data, it is the flattening out of the growth in driving starting in 2018; arguably the lower price of gasoline shifted driving up, but the rate of growth in driving has slowed as gas prices have stabilized at their new lower levels.
More greenhouse gases
Transportation is now the largest source of greenhouse gases in the US, and private automobiles are the largest source of transportation greenhouse gas emissions. The DARTE transportation emissions inventory calculates the amount of greenhouse gases associated with transportation throughout the US. Greenhouse gas emissions from transportation peaked and were trending down prior to the Great Recession. In the early years of the recovery from the recession, transportation related greenhouse gas emissions averaged about 1,500 million tons. With lower gas prices, and increased driving, greenhouse gases increased after 2013, rising to about 1,580 million tons in 2017, and increase of about 5 percent.
![]()
More Light Trucks and SUVs
Cheaper gas also triggered a big change in vehicle buying habits. Automobiles are divided into two categories in the US: passenger vehicles and light trucks; the light truck category includes sport utility vehicles. As a class, cars have much higher fuel economy that light trucks and sport utility vehicles. From the late 1990s through 2013, the two categories almost evenly divided the market, and followed the same trends (with sales of both types rising and falling together). From the middle of 2014 onward, there’s been a sharp divergence in sales, with sales of passenger cars falling sharply and sales of light trucks and sport utility vehicles rising rapidly. The emergence of the gap between auto sales and light truck sales coincides exactly with the drop in fuel prices.
US Sales of Cars and Light Trucks/SUVs
This divergence is driven substantially by the lower price of fuel. Economic analyst Bill McBride writing at Calculated Risk summarizes.
“Over time the mix has changed toward more and more light trucks and SUVs. Only when oil prices are high, does the trend slow or reverse.”
Because vehicles have a relatively long life (the average vehicle in the US is 12 years old), purchasing decisions made now will influence gas consumption and emissions for many years to come. One effect of cheap gas prices today is to “lock in” a relatively less efficient fleet that we might have had, if consumers had gotten different signals about the cost of fuel.
More Traffic Deaths
The long term trend in US traffic deaths has been mostly downward. Traffic deaths were essentially flat from 2010 through 2014, at about 33,000 per year. After the decline in gas prices, traffic deaths jumped by about 9 percent, averaging about 37,000 deaths per year. Prior to the decline in gas prices, we were holding our own, if not making progress in improving road safety; after the inflection point, traffic fatalities got noticeably worse.

Declining Transit Use
Cheaper fuel is an inducement for people to drive, rather than take transit. As gas prices rose in the mid-2000s, transit systems around the country experienced notable increases in ridership. There was a slight dip due to the Great Recession, but ridership rebounded quickly and was still growing through early 2014. Transit ridership peaked at about 900 million monthly riders in mid-2014, but then declined by about 9 percent to 820,000 daily riders by 2018. Prior to the inflection point in 2014, transit ridership was growing; after the collapse of gas prices, transit ridership experienced a sustained decline. (We’ve truncated this graph at January, 2020, so it does not reflect the effect of Covid-19 on transit ridership).
US Transit Ridership 2000 to 2020
Lessons of the inflection: Prices matter
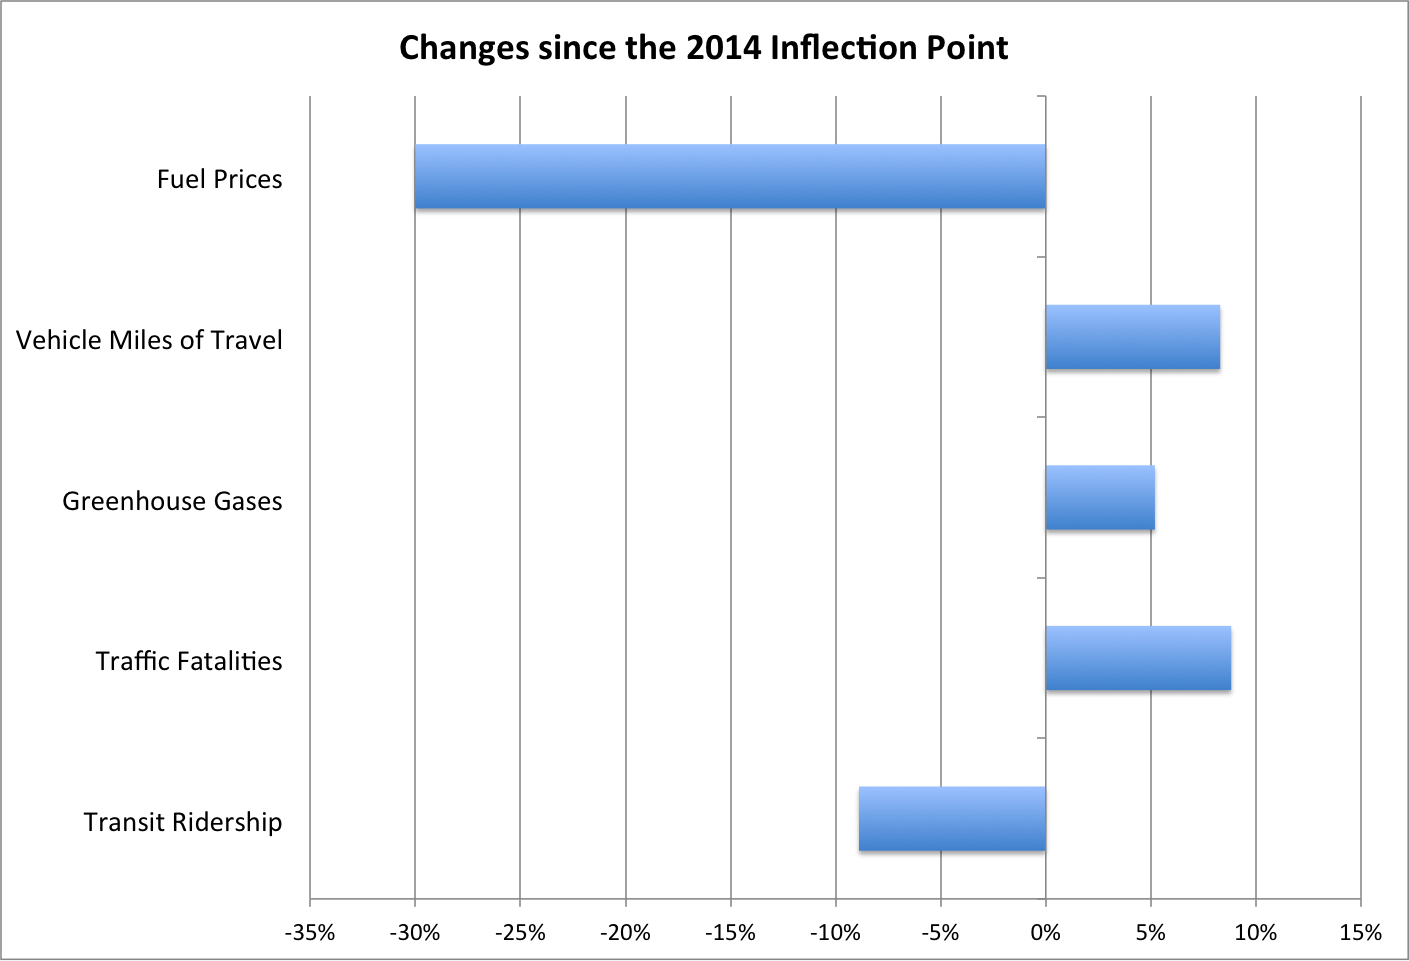
At a critical inflection point, the price of gas plummeted by almost a third. That produced an additional 200 billion miles of driving each year, generated an increase in greenhouse gas emissions of 800 million tons, was associated with and is associated 4,000 additional highway deaths. It also produced a sharp and persistent decline in transit use, and has dramatically altered the composition of vehicle sales away from the most economical types to heavier, less fuel efficient light trucks and SUVs. This chart summarizes the key changes from 2014 until the period just before the Coronavirus pandemic.
The abrupt decline in fuel prices in the third quarter of 2014 is a powerful natural experiment illustrating the price elasticity of demand, and its straightforward effects on driving, pollution, safety, and transit. The magnitude of the increase in driving coincides closely to academic estimates of the price elasticity of demand; a 30 percent decrease in fuel prices was associated with an 8 percent increase in miles driven.
This inflection point is strong evidence of the importance of harnessing prices to shape travel behavior and achieve policy objectives. And here’s the critical point: all of our efforts to reduce greenhouse gases with vehicle electrification and more efficient cars, all of our investments in public transit, and all of our “Vision Zero” plans are dwarfed by the impact of changing fuel prices. Cheap gasoline dramatically undermines public policies to promote public health and safety, to support accessible urban places, and to save the planet.
Policy frameworks that ignore the importance of pricing promise to squander vast amounts of resources by trying to subsidize people and firms to act against the powerful economic incentives created by cheap energy. In the face of cheap energy, policies to reduce traffic deaths, promote transit and urbanism, and lower greenhouse gas emissions, are greatly handicapped if not doomed to fail. Conversely, higher prices for energy–which would fully reflect the social and environmental damages wrought by car driving–would change this headwind into a tailwind. All of these measures (promoting transit, traffic safety and reducing pollution) are vastly easier to achieve in a world where driving fossil fuel cars isn’t so artificially cheap.