What City Observatory did this week
1. The high price of cheap gas. The most fundamental point in economics is that people respond to incentives. Make something cheaper to buy, and people will buy more of it. Make something more expensive, and they’ll buy less. That’s plainly the case when it comes to driving, and one of the biggest and most visible costs of driving is the price of a gallon of gas. When global oil prices collapsed in 2014, gas prices nose-dived as well. The predictable result: driving increased sharply. But in the past year, as gas prices have edged steadily upward, the number of miles the average American drives each day has started declining again. The key takeaways for policy are two-fold: First, short term fluctuations in gas prices aren’t very important (even though some studies over-analyze these micro-trends. Second, larger, long term shifts in gas prices trigger changes in behavior. Our challenge is to figure out how to get the prices right in the long-run.
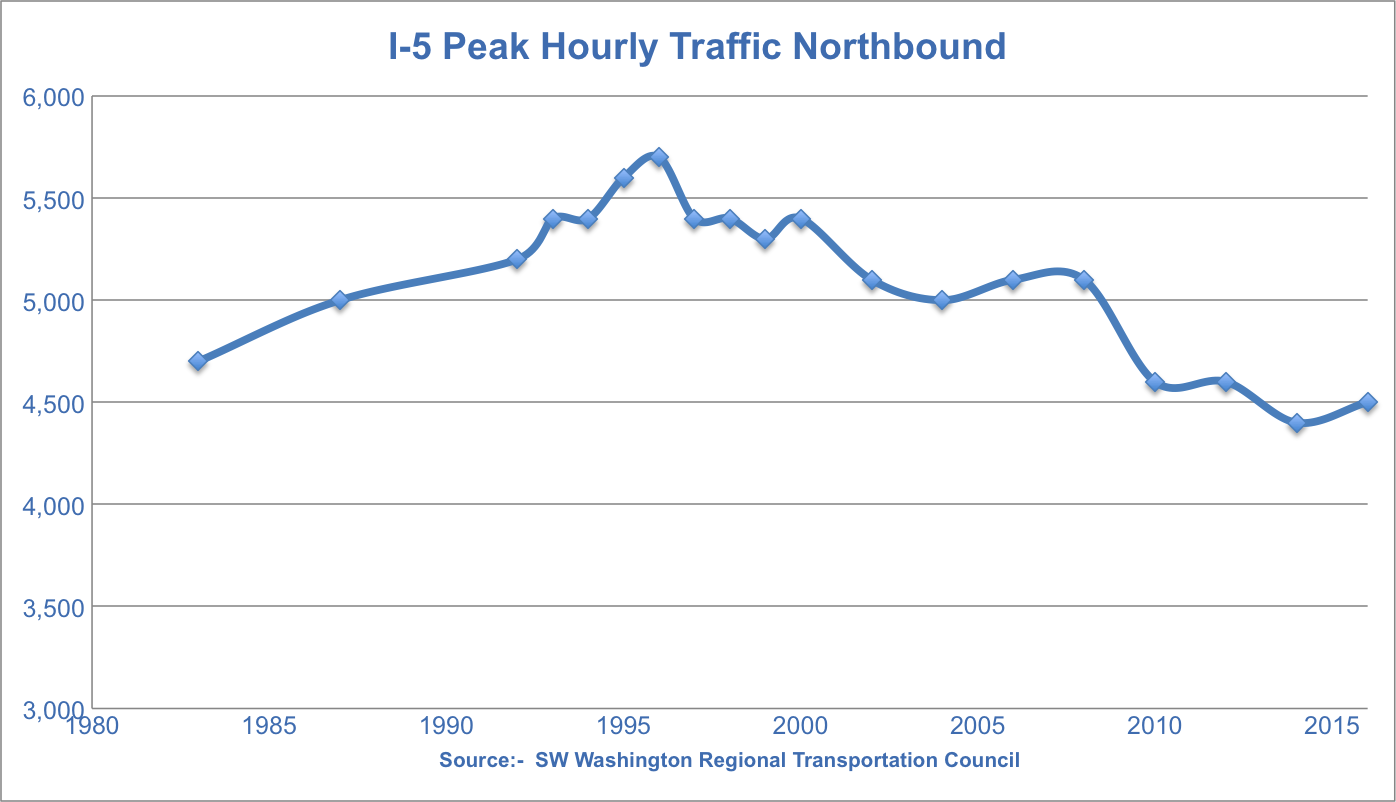
2. Backfire: How widening a freeway made traffic worse. It seems like it should be so simple. If there’s a lot of traffic and congestion on a freeway, just adding lanes should make it better, right? Well it’s not so simple: more lanes allow more traffic onto the freeway at one point, but that may simply lead to bigger jam ups just downstream. That appears to be exactly what’s happened on a stretch of Interstate 5 through Portland, where the Oregon Department of Transportation addressed one bottleneck with additional lanes and widers shoulders, and expanded ramp capacity. The effect was to funnel more cars into the next bottleneck, at the Interstate 5 Columbia River Bridge. As a result of their “improvements” traffic jams there are worse today, and the bridge now carries about 10 percent fewer vehicles in the afternoon peak hour than it did before the improvement project. Keep in mind that the patron saint of traffic engineers is Sisyphus: pushing the rock up hill, only to have it come sliding down again.
Must read
1. Your risk of crime has more to do with who you are than were you are. Thanks to the proliferation of geographic information systems and open crime databases, we’ve seen a proliferation of maps that compute the incidence of crime across different neighborhoods. These maps invariably convey the impression that some places are vastly more dangerous than others. But careful studies of crime statistics show that location is a secondary, and often incidental factor: your likelihood of being a victim of crime, especially violent crime, has much more to do with who you are than where you are. Violent crimes are perpetrated by, and directly affect only a tiny, and non-random selection of the population. Stephen Lurie has a terrific essay at CityLab exploring this misunderstood phenomenon. Briefly:
While violence is concentrated in very particular places, it’s not the places themselves that are committing homicides. . . . In our forthcoming study of serious violence in over 20 cities, we found that less than 1 percent of a city’s population—the share involved in what we call “street groups” (gangs, sets, and crews)—is generally connected to over 50 percent of the city’s shootings and homicides.
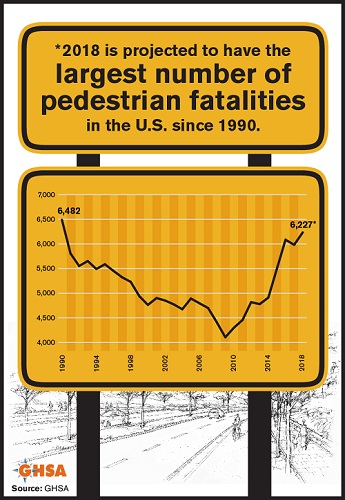
2. Our roads are killing more pedestrians, again. A new report from the Governors Highway Safety Association chalks up the gruesome toll that cars have taken on the nation’s pedestrian in the past year. Pedestrian deaths in 2018 were 6,227, the highest number since 1990. Despite the advent of “Vision Zero” pedestrian fatalities are rising steadily. The report calls the increase dire:
In recent years, pedestrian fatalities in the U.S. have risen at an alarming and unprecedented rate: During the 10-year period 2008-2017 the number of pedestrian fatalities increased by 35 percent, while the number of all other traffic deaths combined decreased by six percent.
What’s behind the increase? There are many contributing factors. More driving is one. And the number of pedestrian deaths attributable to Sport Utility Vehicles is increasing faster than for passenger vehicles. Consistent with other safety reports, like Dangerous by Design, this report shows the highest rate of pedestrian fatalities in sprawling Sunbelt states. More driving, by more dangerous vehicles, in more dangerous places is the likely culprit.
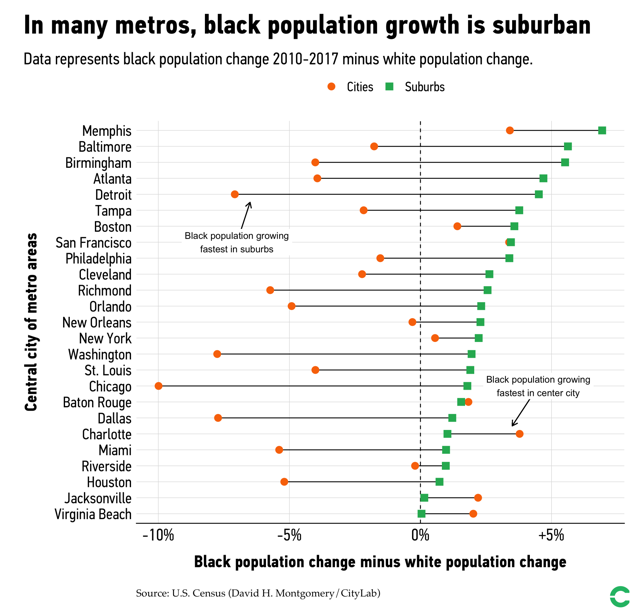
3. Black population growth is increasingly suburban. CityLab takes a close look at some data from a recent Brookings report on majority black cities. They zoom in on one factor: the city/suburban growth rates of black population in different cities. The following chart assembled by CityLab’s David Montgomery shows black population change minus white population change for the cities and suburbs in two dozen large metro areas. In all but three, black population is growing noticeably faster in the suburbs than white population, while white population is growing faster than black population in the cities. (The three exceptions are Charlotte, Jacksonville and Virginia Beach). This suggests a significant reversal of the historic “suburban white flight” narrative: black populations growing faster in suburbs; white populations growing faster in cities. Might this lead to greater integration?
In the News
In its article, “Portland Oregon says a new highway expansion will be better for the environment,” Slate quoted City Observatory’s Joe Cortright and questioned claims that Portland’s proposed $500 million freeway widening project will somehow actually reduce carbon emissions–something no freeway widening ever has done.
Strongtown’s re-published City Observatory’s commentaries on the faulty analysis underlying the proposed Rose Quarter freeway widening project, in a feature they entitled “A novel–but still wrong–argument for widening a freeway.
