Widening I-5 in Portland apparently made traffic congestion worse
Oregon’s Department of Transportation (ODOT) is proposing to spend half a billion dollars to add two lanes to Interstate 5 at the Rose Quarter in Portland, with the hope that it will help relieve traffic congestion. But practical experience with freeway widenings in this area shows that more capacity actually makes the traffic worse. Today we show evidence that when ODOT widened I-5 between Lombard and Victory Boulevard a few years ago, it only managed to funnel more traffic more quickly into the I-5 Columbia River bridge chokepoint. The result: the bridge actually carried less peak hour traffic than before.
If a sink isn’t emptying rapidly enough, pouring more water into it only causes it to overflow more.
A bit of orientation, Interstate 5 is one of two major freeway connections between Vancouver, Washington and Portland, Oregon. There’s a large daily flow of commuters from residences north of the river in Washington to jobs in Oregon. Travel across the I-5 bridge (and I-205, a parallel route some five miles to the east) is heavily southbound in the morning and northbound in the evening. As in most US cities, PM peaks are more pronounced and travel slower than in morning peaks.
As we related in an earlier commentary, in 2010, the Oregon Department of Transportation completed an $70 million dollar project to widen a mile long portion of I-5 between Lombard and Victory Boulevard in North Portland, to, in their words eliminate a bottleneck.
Our earlier analysis examined the traffic crash record for that stretch of freeway, noting that rather than decreasing crashes, the crash rate actually increased after the freeway was widened. So that part of the project didn’t work. But did “fixing” the bottleneck make the freeway work better?
Today, we take a look at traffic flows across the Columbia River I-5 Bridge, just north of the freeway widening project. In theory, removing the bottleneck should cause traffic to flow more freely.
But what appears to have happened is that the wider I-5 just funneled more peak hour traffic, more quickly into the bridge area. The result is that the roadway jams up more quickly, and that backups occur earlier and last longer, with the result that the freeway actually carries fewer cars than it could if traffic volumes we effectively metered more evenly by a somewhat lower capacity upstream of the bridge.
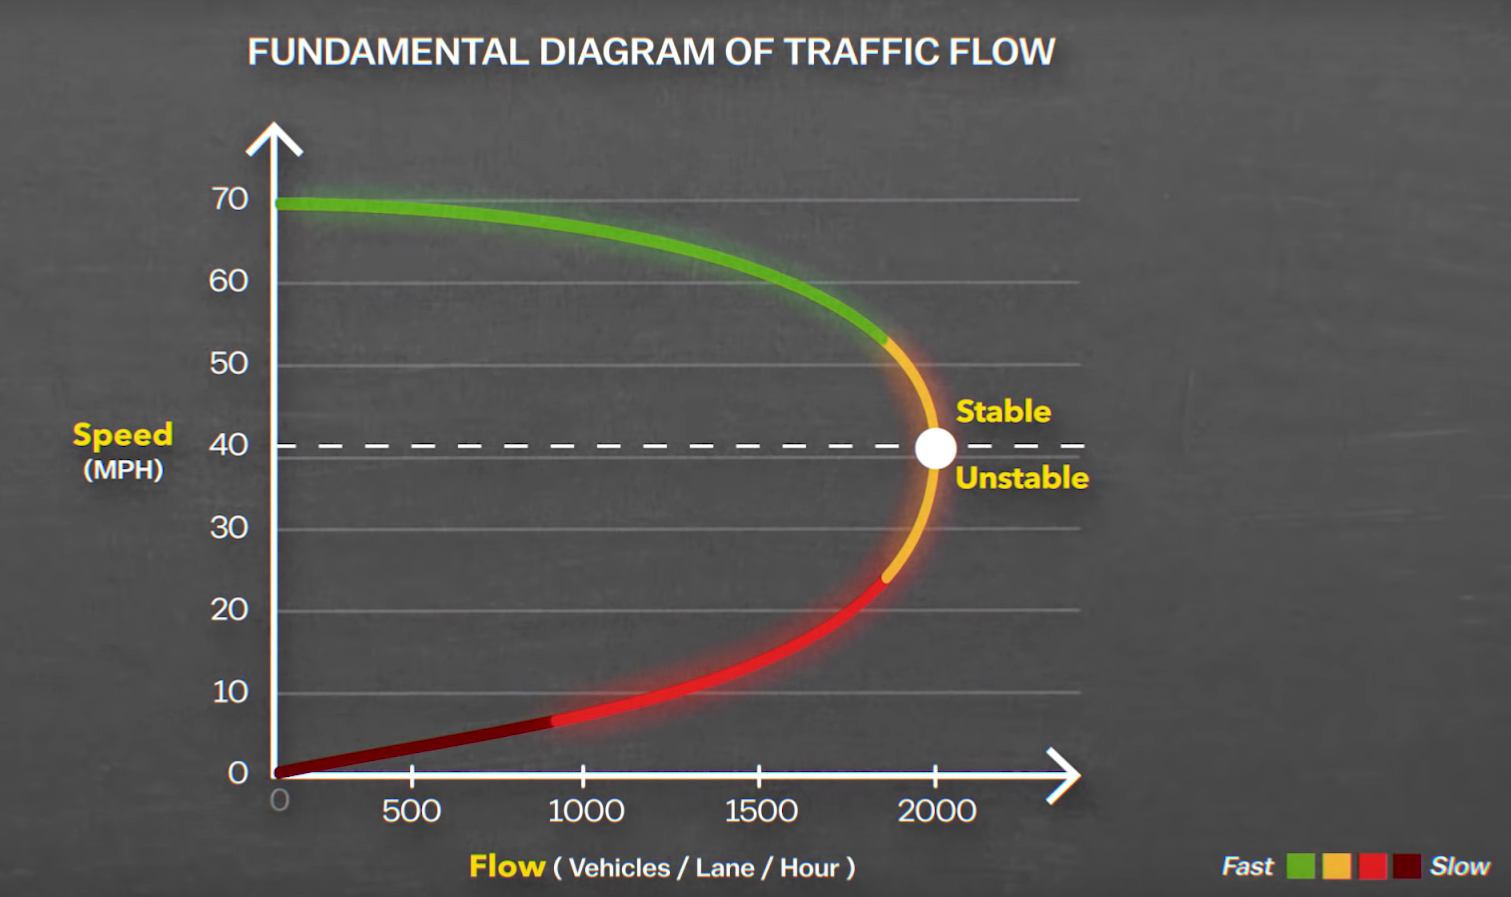
As traffic engineers well know, there’s a kind of backward bending speed-volume relationship. A highway can carry a certain amount of traffic at a relatively high speed, but as more cars are added, the freeway both slows down–and loses capacity. What additional capacity can do is more quickly push a highway past this “tipping point” resulting in slower traffic and lower throughput.
Data provided by the Clark County Washington Regional Transportation Council (RTC) seems to show that’s just what happened on I-5 after the 2010 widening project was completed. Prior to the completion of the project, the Northbound peak hour flows over the I-5 bridges were always somewhat greater than 5,000 vehicles per hour, fluctuating between 5,000 and 5,500 vehicles per hour on a typical peak hour on a Thursday afternoon (a data point selected as typical by RTC). The following chart shows peak hour traffic on I-5 in October 2006, with the blue line corresponding to Northbound traffic.
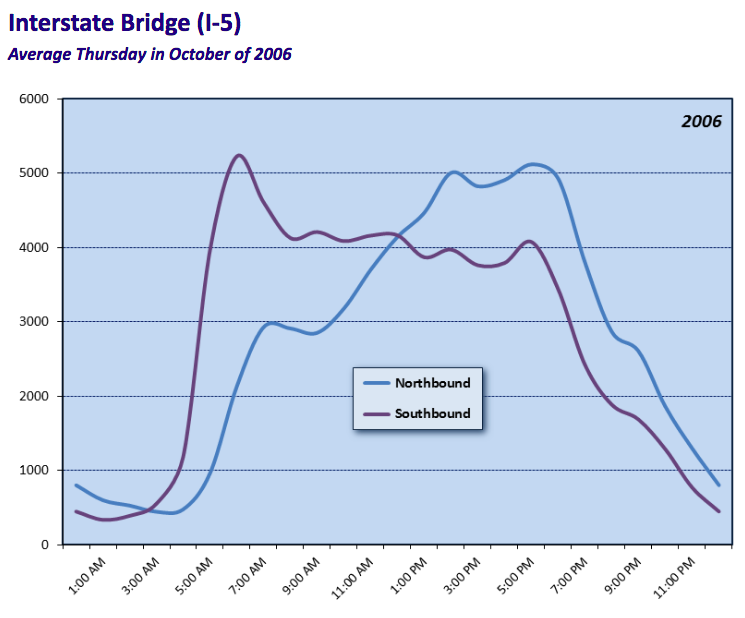
Notice that for the three lanes of I-5, 5,000 vehicles per hour works out to about 1,700 vehicles per lane per hour, squarely in the “yellow zone” where traffic speeds and capacity become unstable. These data also show that the morning and afternoon peak volumes are approximately equal (topping out at just over 5,000 vehicles.
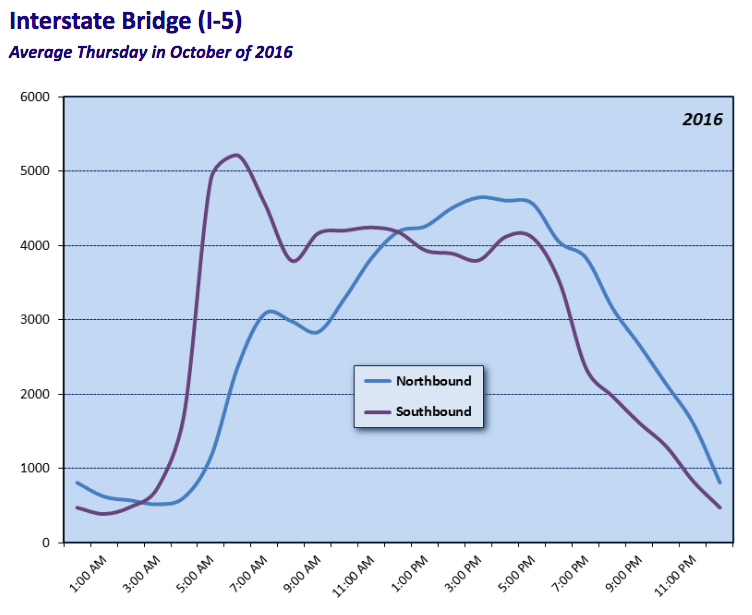
Here’s a similar chart for 2016 (the most recent year available. On this typical Thursday, Northbound traffic never reached 5,000 vehicles per hour. Notice that the morning peak remains at its earlier level–it’s only the afternoon volumes that have fallen. This 10 percent reduction in throughput over the I-5 bridges in the Northbound Direction in the afternoon peak is likely a result of funneling additional traffic on to I-5, thanks to the freeway widening and ramp “improvements” ODOT put in place since 2006.
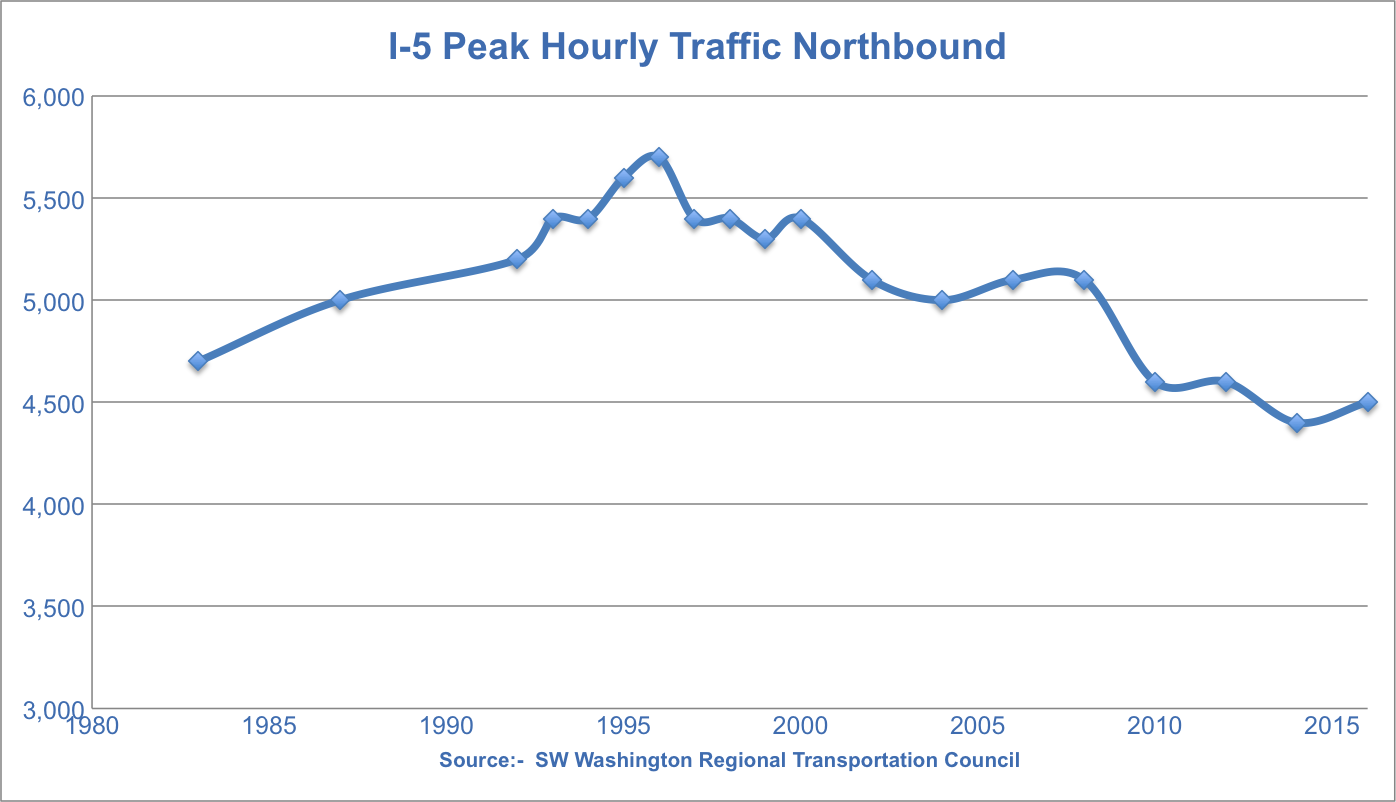
The Regional Transportation Council has generated similar charts for selected years between 1983 and 2016. (They’ve even got a clever animation of these charts showing how the pattern of traffic has changed over time). We’ve aggregated the data for all the years reported by RTC into a single chart showing the maximum PM peak hour volume traveling Northbound across the I-5 bridges.
After 2010, peak hour volumes on the I-5 Northbound have been consistently below 5,000 vehicles per hour, ranging between 4,400 and 4,600 between 2012 and 2016. (Again, RTC selected data for even numbered years). What these data show is that the hourly volume of cars crossing the I-5 bridges at the peak hour has fallen close to 10 percent since the bottleneck was removed.
Again, as we noted earlier, southbound traffic in the morning peak hour continues to flow at a rate of about 5,000 vehicles per hour. Our statistical analysis is admittedly a first brush, but we’ve seen nothing in ODOT’s analysis of I-5 operations that suggests its incorrect.
This analysis points up the futility of “bottleneck busting” incremental freeway expansion. Widening a freeway at one point simply delivers more traffic, faster, to the next bottleneck in the system, causing it to be the new source of the problem.
Ironically, bottlenecks at one point in the system act as “meters” to control the flow of traffic on to subsequent sections of the roadway. Delaying traffic at one point–as we do intentionally with ramp meters–allows the downstream sections of the roadway to flow without exceeding capacity and moving into the backward bending part of the speed/volume relationship.
The beneficial effects of this metering process are apparent in Seattle’s recent experience with the closure of the Alaskan Way Viaduct. This limited access highway, which carried 90,000 vehicles per data through downtown Seattle (I-5 at the Rose Quarter carries about 121,000) was closed in mid January 2019. Despite predictions of “Viadoom,: based on the theory that traffic would spill over onto adjacent city streets and overwhelm the parallel segment of I-5 in Seattle, traffic in Seattle was, if anything, somewhat better than before the viaduct closed. The Seattle Times reported, “the cars just disappeared.” By shutting down the flow of traffic from the viaduct to Seattle streets, the closure reduced the demand on those streets and enabled traffic to flow more smoothly.
The practical experience with widening I-5 shows that eliminating bottlenecks in one place simply leads to the more rapid congestion of the next downstream bottleneck, and ironically, lower throughput on the freeway system. It might seem paradoxical that highway engineers would allow this to happen, but if you’re more interested in generating excuses to build things, rather than actually managing traffic flows, it makes some sense. As we’ve argued before, it seems as if highway engineers treat the sisyphean aspects of perpetually chasing bottlenecks, not as a bug, but as a feature. To them, the fact that widening one stretch of freeway to eliminate one bottleneck simply creates another one is a guarantee of permanent employment, not a fundamental flaw in engineering practice.