What City Observatory did this week
1. Measuring Anti-Social Capital. Thanks to the scholarship of Harvard’s Robert Putnam, the idea of social capital has become firmly entrenched in the policy lexicon. Putnam and others developed some innovative measures of social capital, looking at voting, volunteering, and attitudes about civic affairs and behaviors of personal engagement. This week we update one of our favorite measures of “anti-social” capital: the number of security guards per capita in each large US metropolitan area. The employment of security guards is a fundamental measure of the degree of distrust and suspicion in a community: we need to hire guards to protect people and property and to deter people from engaging in anti-social behavior. There are some big variations among US metro areas in the number of security guards. See where your city ranks.

2. The Market Cap of Cities. Business analysts like to summarize the relative size and importance of publicly-traded companies by computing their “market cap” or market capitalization: the aggregate dollar value of their shares based on current prices. These figures show that tech giants like Amazon, Google, and Apple are the biggest public companies around. We’ve used the same approach to compute the market cap of cities, as judged by their housing markets. Home prices are like apartment prices: they reflect the value the market attaches to living in different cities. Using Zillow’s estimates of single family home values and our own estimates of apartment values, we’ve estimated the market cap of the nation’s largest metro areas. Collectively, they’re worth $30 trillion–more than the fifty largest companies combined.
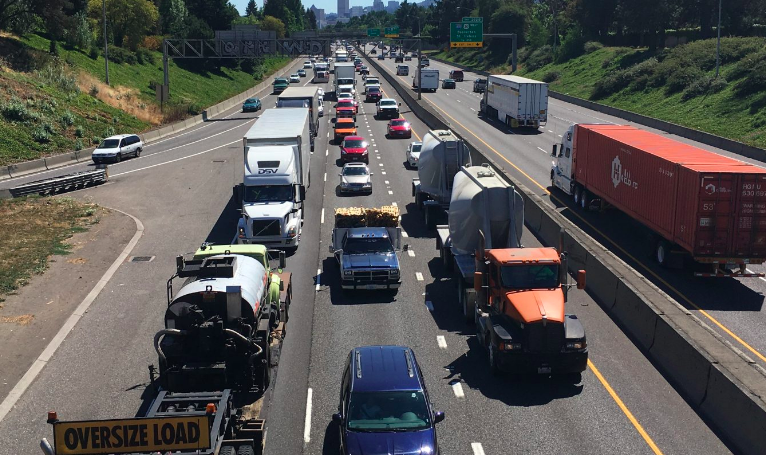
3. The proposed half-billion dollar freeway widening in Portland will do nothing to lessen daily traffic congestion. City Observatory readers are intimately familiar with induced demand, and know the “fundamental law of roadway congestion” that afflicts urban transportation. You can’t build your way out of congestion no matter how many free lanes you add because they’ll just attract more traffic. It turns out that even the two agencies proposing the $500 million mile-long widening of Interstate 5 in Portland concede that this is the case. We provide quotes from officials at the Portland Bureau of Transportation and the Oregon Department of Transportation acknowledging that the project won’t lessen recurring traffic jams.
4. The problems with Angie’s List. Streetblog’s Angie Schmidt has a long list of grievances against ride-hailing companies: they’re adding to traffic, cutting into transit ridership, and more. There’s some validity to these concerns, but we think Uber and Lyft are not the problem. Instead, most of what’s laid at the feet of ride-hailing is really a result of our under-pricing of valuable and limited road space, particularly in cities and at peak hours. All of the perceived problems of ride hailing would be substantially reduced if we charged everyone for their use of this scarce and valuable resource. Don’t blame the player, blame the game.
Must read
1. Why upzoning actually does matter to getting more affordable housing. The cause celebre in planning circles this week was the publication of Yonah Freemark’s study of upzonings in Chicago. Freemark found that even though Chicago changed its zoning code to allow more density near transit stations, new development didn’t occur, and home prices went up. Though Freemark was much more guarded about his interpretation of the findings, others unsurprisingly, used it as “proof” that upzoning doesn’t help with affordability. CityLab published a very thoughtful rebuttal to this claim from City Observatory contributor Alex Baca and Cleveland State scholar Hannah Lebovitz. A key point: allowable zoning is just one step in a very complex and political process, one that in Chicago is regularly trumped by Aldermanic privilege, and subject to considerable negotiation and often political veto. To those who would use the study as ammo to argue against up-zoning, Baca and Lebovitz say:
. . . the paper shouldn’t be reduced to a “checkmate, YIMBYs” declarative. No one who is intimately engaged with the complexities of affordable housing in America would suggest that zoning is the sole knob to twiddle to increase affordability—and Freemark doesn’t, either. Zoning is targeted because its origins are inherently racist, bigoted, and exclusionary. But, again, it is not the sole input to making housing more affordable. It’s just the one that, by changing it, allows for many other things that make housing more affordable. . . . But, for now, these findings are inconclusive and in many ways detached from the day-to-day reality of how local-level zoning and planning work. We hope they are not used to validate a continuation of exclusionary practices, or misguided power moves by elected officials in American cities and their suburbs.
Our takeaway: upzoning is necessary, but not sufficient, to getting more affordability.
After a big drop in the first half of the last decade, the number of white residents in Chicago has grown 9 percent since 2005. Latino growth has slowed significantly, but it’s still up about 5 percent since 2000. Chicago’s Asian population has boomed, growing by 44 percent since 2000.
Segregation has created a lack of economic mobility. I’d argue that Chicago is economically stratified to the extent that upward mobility for blacks here is particularly difficult. . . . Networks are hard to penetrate. The power structure is rigid. There’s also a lack of residential mobility.
3. Reforming rent control in New York. New York City’s rent control and rent stabilization laws are up for renewal this year, and the Citizen Budget Commission, a local good government group has some thoughts on what the Legislature might consider doing to improve the program. Chief among their suggestions: re-thinking rent stabilization for higher income households. The CBC estimates that more than 28,000 households with annual incomes of $200,000 or more live in rent-stabilized apartments. Collectively rent stabilization saves them about $271 million annually, compared to what they would be expected to pay in the un-regulated market. Phasing out rent stabilization for these households would increase city tax revenues and provide additional resources to support programs for lower income households.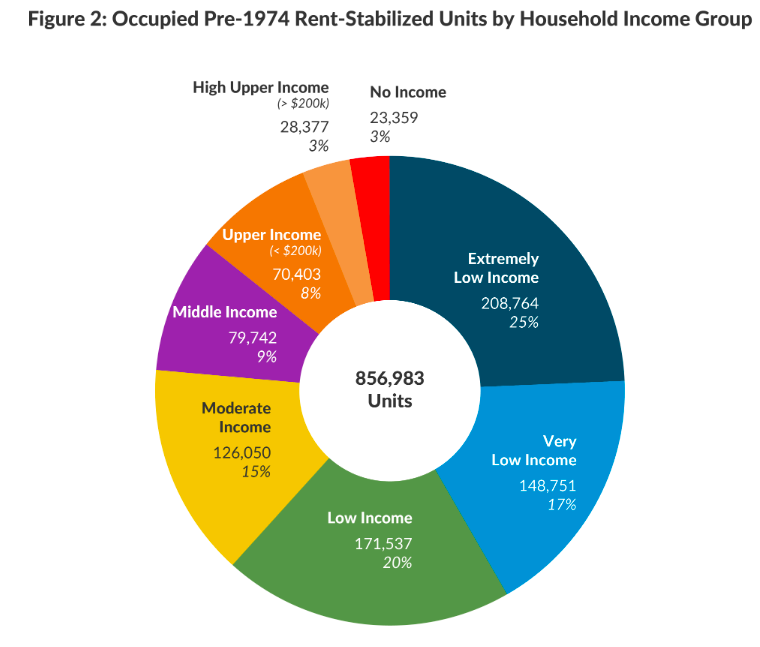
New Knowledge
Technology is making mortgage lending more efficient. A recent study from the Stern Business School and New York University looks at the performance gains from increasingly computerized process of mortgage loans, one of the effects of “fintech” or financial technology. Fintech lenders include Quicken Loans, Loan Depot and other companies (Editor’s note: Quicken Loans is a supporting sponsor of City Observatory). These technology based lenders have increased their market share since the great recession, and now account for about 8 percent of US mortgage lending. The study shows that these tech lenders process mortgage applications about 10 days faster than conventional lenders, even after controlling for variations in loan, borrower and territorial factors. Importantly, the study shows that default rates aren’t higher for these loans, suggesting that the technologically enhanced underwriting is equally prudential in addressing risk.
FinTech mortgage borrowers are attracted to the faster processing times and greater convenience involved with online applications and partial automation of mortgage underwriting. This is consistent with the faster growth of FinTech in census tracts with previously long mortgage processing cycle times and the higher incomes and education of FinTech borrowers. It is also consistent with the high share of refinances for FinTech lenders. We find no empirical support for the hypothesis that FinTech lenders have grown by disproportionately targeting risky, marginal borrowers. Despite the emphasis of the FinTech lending model on online applications and interactions, we also find no evidence that younger borrowers or borrowers located in census tracts with better Internet access are more likely to borrow from FinTech lenders
In the News
Our commentary on ten things more inequitable than road pricing made it to the pages of the Greenwich (CT) Free Press.
