What are cities worth? More than big private companies, as it turns out: The value of housing in the nation’s 50 largest metropolitan areas ($25.7 trillion) is more than double the value of the stock of the nation’s 50 largest publicly listed corporations ($11 trillion).
Market capitalization is a financial analysis term used to describe the current estimated total value of a private company based on its share price. It’s a good rough measure of what a company is worth, at least in the eyes of the market and investors. The market capitalization—or “market cap,” as it is commonly called—is computed as the current share price of a corporation multiplied by the total number of shares of stock outstanding. In theory, if you were to purchase every share of the company’s stock at today’s market price, you would own the entire company.
The following chart compares the market cap of the nation’s 50 largest publicly traded corporations (on the right) with the market cap housing in each if the nation’s 50 largest metropolitan areas (on the left). The magnitude of these numbers is a bit staggering, all values are expressed in billions. The data for housing are broken into two components, the value of single family homes (blue) and multi-family homes (orange). Sources and methodology for these estimates are described below.
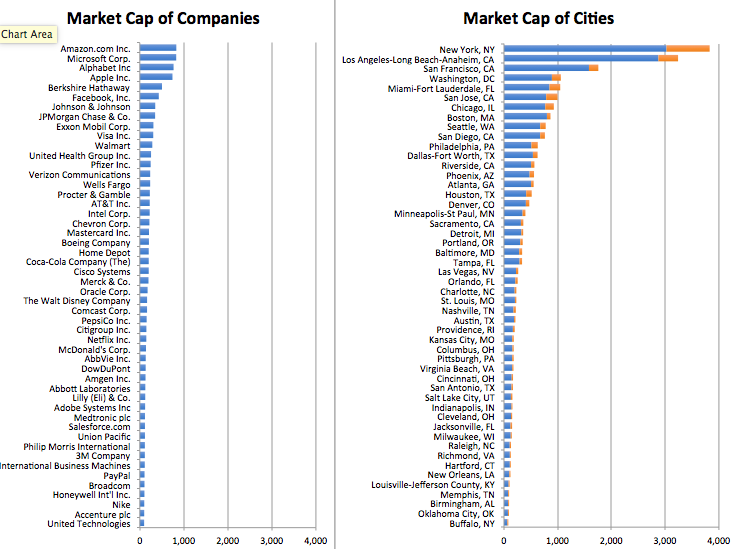
The most valuable company is Amazon, with a market cap of $829 billion; the most valuable metro area is New York, where the market value of owner-occupied and rental housing is over $3.8 trillion—about four times higher. The current market value of Amazon is about the same as the current market value of housing in Seattle or San Jose, the eighth and ninth most valuable housing markets on our list.
Some modest-sized metros have housing that’s worth as much as the entire value of some very well-known corporations: IBM’s market cap ($113 billion) is about equal to New Orleans housing ($120 billion). Orlando’s housing ($255 billion) is valued at more than 50 percent over all of Disney ($166 billion). Two Seattle-based companies (Microsoft, at $827 billion; Amazon, at $829 billion) are each worth more than all the housing in Seattle (about $776 billion).
The differences are smaller at the bottom end of our two league tables. The fiftieth largest firm, the United Technologies, is worth about 25 percent more more than the fiftieth most valuable metro housing market, Buffalo: $98 billion versus $80 billion.

It may seem strange to compare the market value of houses with companies, but this exercise tells us more than you might think. Just as the share price of a corporation reflects an investor’s expectations about the current health and future prospects of a company, the price of housing in a metropolitan area also reflects consumer and homeowner attitudes about the quality of life and economic prospects of that metropolitan area. So, for example, as the price of oil has fallen, weakening growth prospects in the oil patch, it’s quickly translated into less demand and weaker pricing for homes in Houston. Just as stock market investors purchase and value stocks based on the expectation of income (dividends) and capital gains from their ultimate sale, so too do homeowners (and landlords)—they count on the value of housing services provided by their home as well as possible future capital gains should it appreciate.
In fact, these two commodities—housing and stocks—are among the most commonly held sources of wealth in the United States. And while the financial characteristics of the two investments are dramatically different the underlying principle is the same, making market cap is a useful common denominator for assessing the approximate economic importance of each entity.
Each day, the financial press reports the market’s assessment of the value of individual firms, through their stock prices. But viewed through a similar lens, the housing markets of the nation’s cities are by this financial yardstick an even bigger component of the nation’s economy.
Technical Notes
Our estimates are based on the market capitalization of publicly traded U.S. based corporations as reported on January 19, 2019. Our estimates of the value of single family housing in each metropolitan market were generously provided by real estate experts at Zillow. For more keen insights on housing markets, follow their work at Zillow’s Real Estate and Rental Trends blog.
We supplemented Zillow’s estimates of the value of the single family housing stock by computing the market value of the nation’s multi-family housing using data from the Census Bureau’s American Community Survey. In real estate, the value of rental housing is usually estimated using a “cap rate” or capitalization rate, that approximates the rate of return on capital that real estate investors expect from leasing out apartments. To estimate the current market value of apartments, we multiplied the median rent in each metropolitan area by the number of multi-family housing units in that area. Then we deducted 35 percent to estimate “net operating income”—the amount the investor receives after paying maintenance, other operating expenses, and taxes—and then we divide this number by a capitalization (cap) rate of 6 percent. Both of these figures (net operating income and capitalization rates) are rough estimates—values vary across different times of properties, different markets, and over time with financial conditions (such as with the change in market interest rates). Our estimates of the value of the housing stock in each metropolitan area differ from those we published in 2016.
