Metro’s Regional Transportation Plan rationalizes spending billions on freeway expansion by publishing false estimates and projections of greenhouse gas emissions
Transportation is the number one source of greenhouse gases in Portland. For nearly a decade, our regional government, Metro, has said it is planning to meet a state law calling for reducing greenhouse gas emissions 75 percent by 2050.
But the latest Metro Regional Transportation Plan (RTP) has simply stopped counting actual greenhouse gas emissions from transportation.
Inventories compiled by the state, the city of Portland and the federal government all show the region’s transportation emissions are going up, not down as called for in our plan.
In place of actual data, Metro and other agencies are substituting fictitious estimates from models; these estimates incorrectly assume that we are driving smaller cars and fewer trucks and SUVs, and rapidly replacing older cars. None of those assumptions are true.
As a result greenhouse gases are going up; our plans are failing, and Metro’s Regional Transportation Plan, the blueprint for spending billions over the next several decades will only make our climate problems worse
This may be our last, best chance to do something to reduce greenhouse gas emissions from the largest and fastest growing source of such pollution in the state and region. Metro’s federally required Regional Transportation Plan is supposed to reconcile our transportation investments with our social and environmental goals. Instead the draft RTP simply lies to the public about worsening greenhouse gas emissions, the failure of current efforts, and the inadequate and counterproductive aspects of the proposed RTP.
Portland and Oregon leaders proudly celebrate our acknowledgement of the gravity of the climate crisis and our oft-professed commitment to reduce greenhouse gas emissions. For the mass and social media, there’s soaring rhetoric.
In the bureaucratic backrooms though, it’s pollution as usual. No where is this more clear than when it comes to roadbuilding. Oregon is embarking on the largest and most expensive highway expansion effort in 50 years, proposing to spend more than $10 billion in the Portland area on highways. All of those billion dollar plus highway expansion projects are contained in Metro’s proposed 2023 Regional Transportation Plan.
This, in spite of the fact that transportation is the largest and fastest growing source of greenhouse gases are higher now that they were in 1990, and every one of the state, regional and local plans to reduce transportation greenhouse gases is clearly failing.
State and regional transportation plans fail to acknowledge the grim reality of increase transportation greenhouse gases (GHGs). Instead, they conceal the fact that our transportation emissions are increasing by ignoring actual inventory data, and instead, reporting fictional results obtained from their own models, and instead make rosy and unsupportable assumptions about future technology, market trends and policy. In essence, these plans pretend that transportation GHGs are already decreasing, and will decrease even more dramatically in the future.
By steadfastly ignoring increasing emissions, Metro and the State of Oregon have simply ignored pledges made in their original climate planning to regularly measure progress, not in terms of checklists, but in terms of actual, measured reductions in greenhouse gas emissions.
Transportation and Climate: Plans ignore reality
It’s been a decade since Metro’s first Climate Smart Plan in 2014, which promised to put the region on track to meet state greenhouse gas reduction goal—reducing emissions 75 percent from 1990 levels by 2050.
Since then, the urgency the of the climate crisis has grown manifestly worse, locally epitomized by weeks of suffocating smoke from climate-caused fires; record 116 degree heat that killed dozens (and likely more), and steadily warming oceans and melting glaciers and icecaps.
The clock is ticking; we’ve used up a quarter of the time we have to achieve our 2050 goal. Now would be a good time to consider whether what we’re doing is working. This question is especially salient given Metro’s consideration of the 2023 Regional Transportation Plan, which will spell out the course of transportation investment for the next five years (and following decades). Since transportation is the largest source of greenhouse gases in the city, region and state, this transportation will be crucial to achieving our goals.
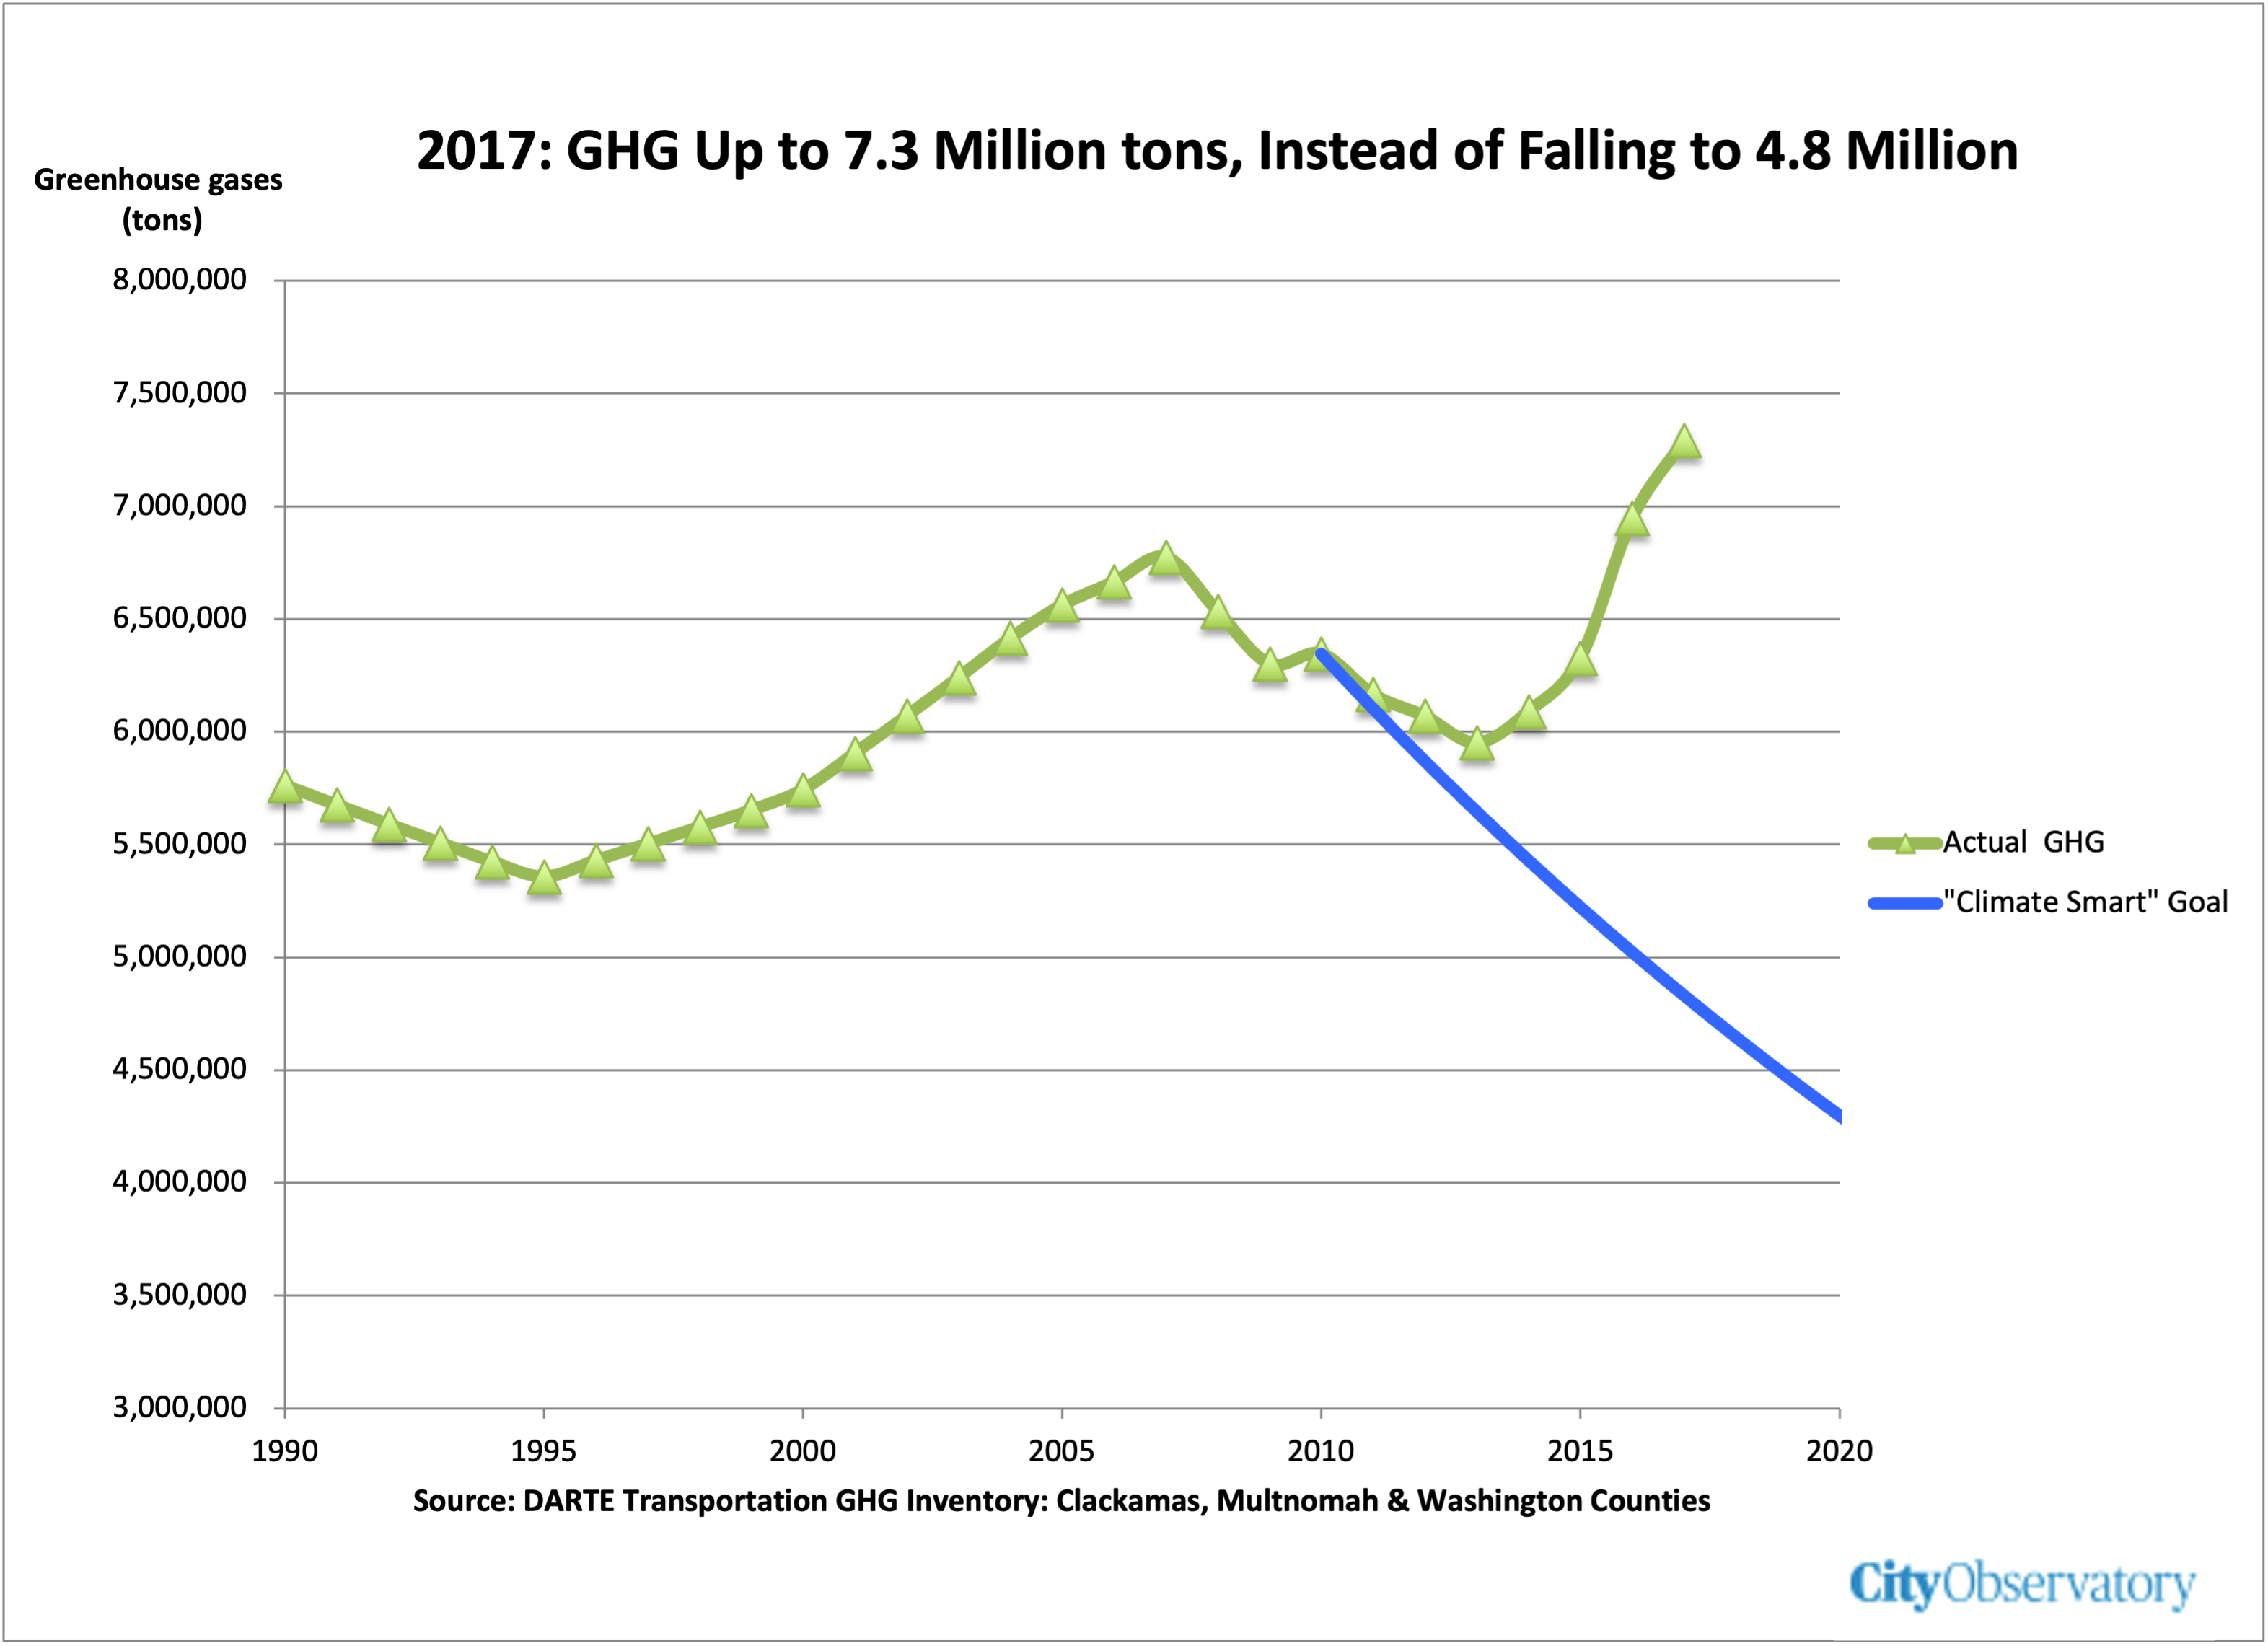
All evidence shows that Metro’s “Climate Smart Plan” has failed completely to reduce greenhouse gases. Every independent inventory of transportation GHGs shows that emissions have increased since the plan was adopted. The region already emits more transportation GHGs than it did in 1990; and the authoritative DARTE database found that regional transportation emissions are up 20 percent in the past five years. And bafflingly, Metro’s RTP climate monitoring doesn’t even bother to report on emission trends.
Instead, the plan relies on its own optimistic modeling of future trends. The problem here is that the plan itself is founded on wildly unrealistic and already disproven assumptions about the rapid adoption of cleaner vehicles. State and local transportation officials confidently predicted a decade ago that we’d rapidly replace older, larger, dirtier vehicles with cleaner newer ones. In fact, the opposite has happened: The average age of vehicles in Oregon is now up to 14 years, and heavier, dirtier trucks and SUVs make up nearly 80 percent of new vehicles old. We’re no where near on track to achieve our greenhouse gas reduction goals.
But the plan assumes, falsely, that the average age of cars is about six years, and that two-thirds of vehicles are smaller, cleaner passenger cars. It uses these assumptions to predict that greenhouse gas emissions will fall rapidly. And even though reality has shown these assumptions to be wrong, modelers have doubled down on them, and now assume, for example, that cars will be replaced even faster than they thought a decade ago, even as the fleet gets older and older.
We’re failing to achieve our goal: Transportation GHGs are increasing
Transportation emissions are the largest source of greenhouse gas emissions in Portland and in Oregon. Transportation emissions account for 41 percent of greenhouse gas emissions in Multnomah County, and 32 percent of emissions statewide.
It’s good to have ambitious plans. But ultimately, those plans have to work in the real world. Locally, we have three different real world estimates of transportation greenhouse gases: The federally sponsored DARTE database, a geographically detailed nationwide estimate of greenhouse gases broken down to 1 kilometer squares cover the entire nation, the Department of Environmental Quality’s annual statewide estimates of Oregon greenhouse gas emissions by source (residential, commercial, industrial, electricity generation and transportation), and Multnomah County’s annual accounting of local greenhouse gas emissions. Every one of these estimates shows we are failing to reduce transportation greenhouse gases.
When it comes to transportation, we’re not making any progress in reducing our greenhouse gas emissions; in fact, greenhouse gas emissions are higher than in 1990 in Multnomah County (up 3 percent), the Portland Metro area (up 27 percent) and statewide (19 percent). We’re going in the wrong direction.
State, regional and local climate plans are failing
And since we adopted city, regional and state plans to reduce transportation emissions (the Portland Climate Action Plan in 2015, the Metro Climate Smart Strategy in 2014, and the State Transportation Strategy in 2013), transportation emissions have increased, not decreased. From 2013 (the year before these climate plans took effect through 2019 (the last full year prior to the pandemic), greenhouse gas emissions form transportation have risen.
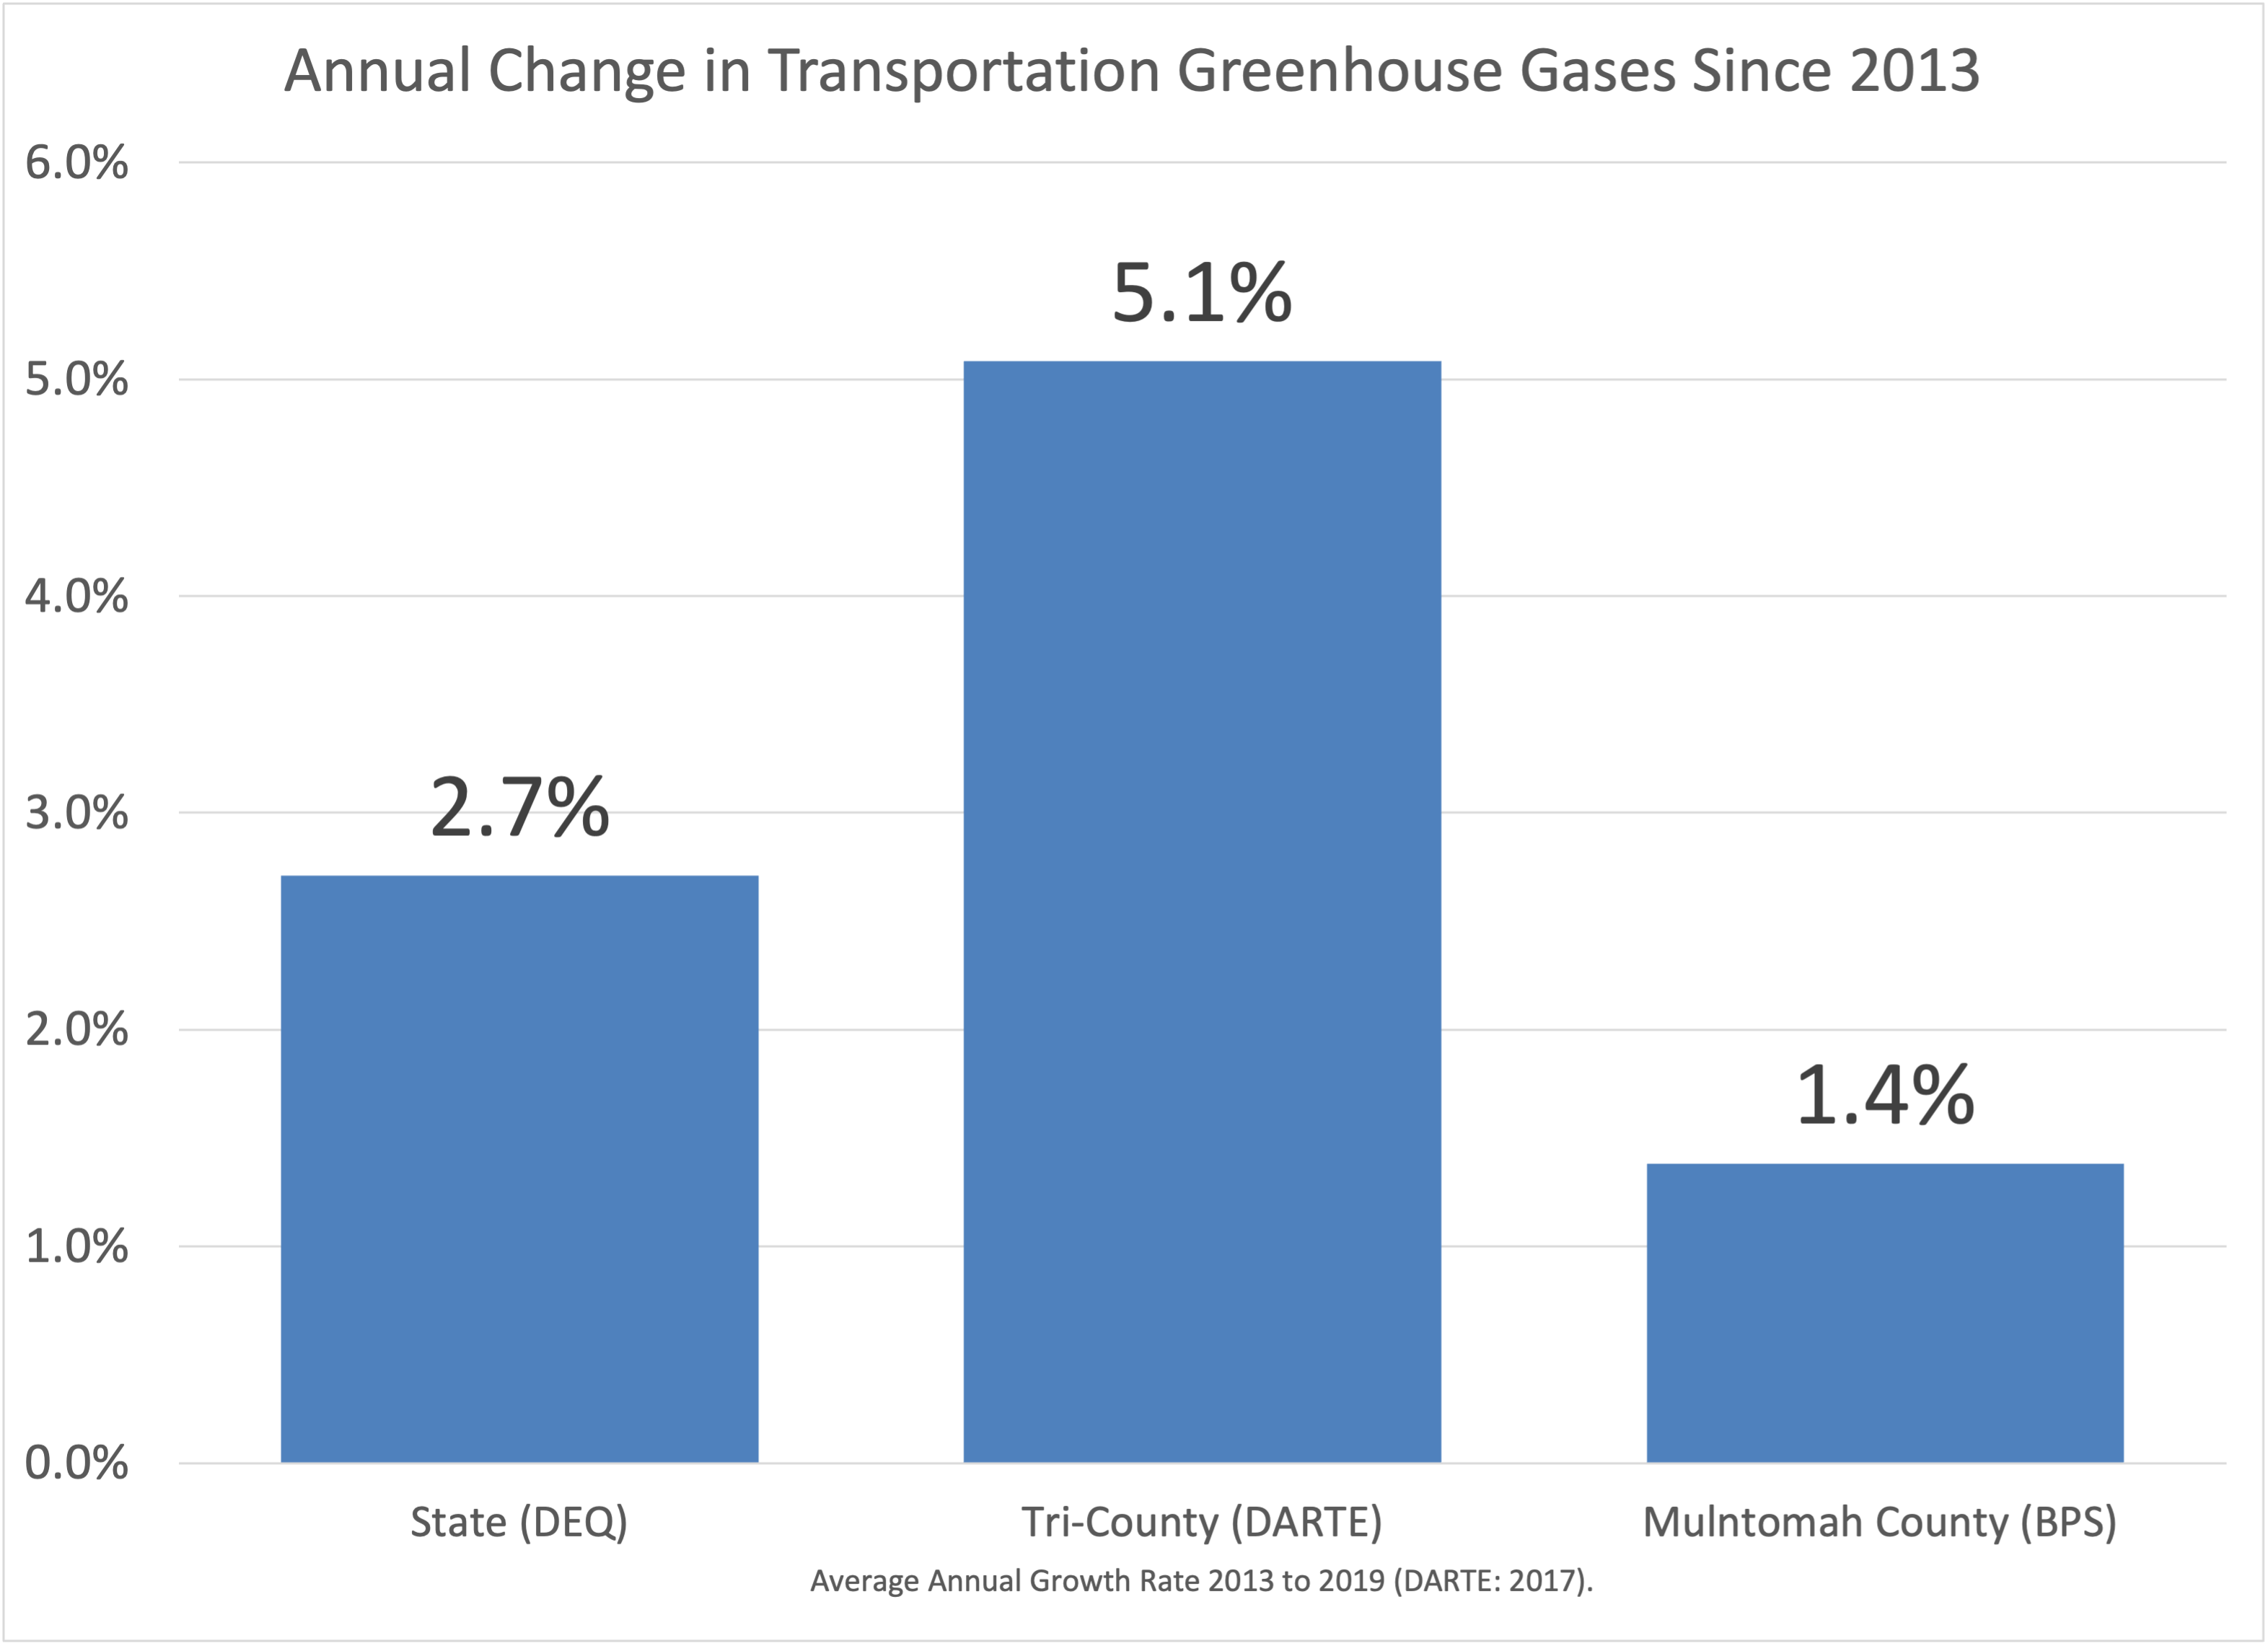
Oregon transportation GHG emissions are up 2.7 percent per year since 2013, Portland regional emissions are up 4.9 percent per year and Multnomah County emissions are up 1.4 percent year. Transportation emissions are going up when our plans call for them to be going down. The result is a yawning and unacknowledged gap between our plans and reality. The DARTE data show the region going rapidly in the wrong direction.
All of the available independent inventory data for the state, city and region make it clear that our transportation emission reduction plans are failing in monumental fashion to achieve their goals.
Climate plans haven’t been adjusted to reflect reality
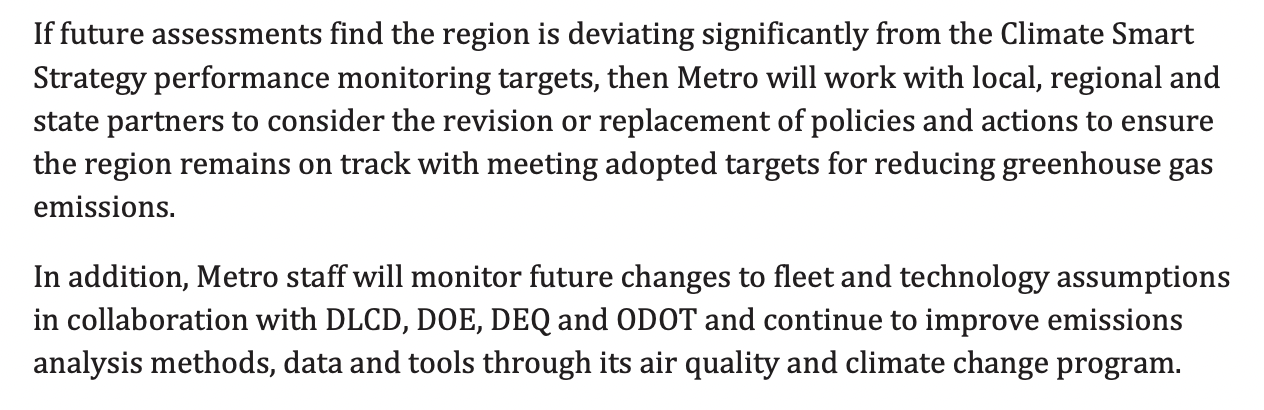
Increased transportation greenhouse gases should be triggering stronger efforts to fight climate change. Metro committed to monitor the progress and implementation of its Climate Smart Strategy, and to take additional measures as needed. This commitment appears in the Climate Smart Plan and is reiterated in the latest draft of the 2023 Regional Transportation Plan. (RTP 2023 Draft, Appendix J, page 21)
Metro’s RTP fails to report increasing transportation greenhouse gas emissions
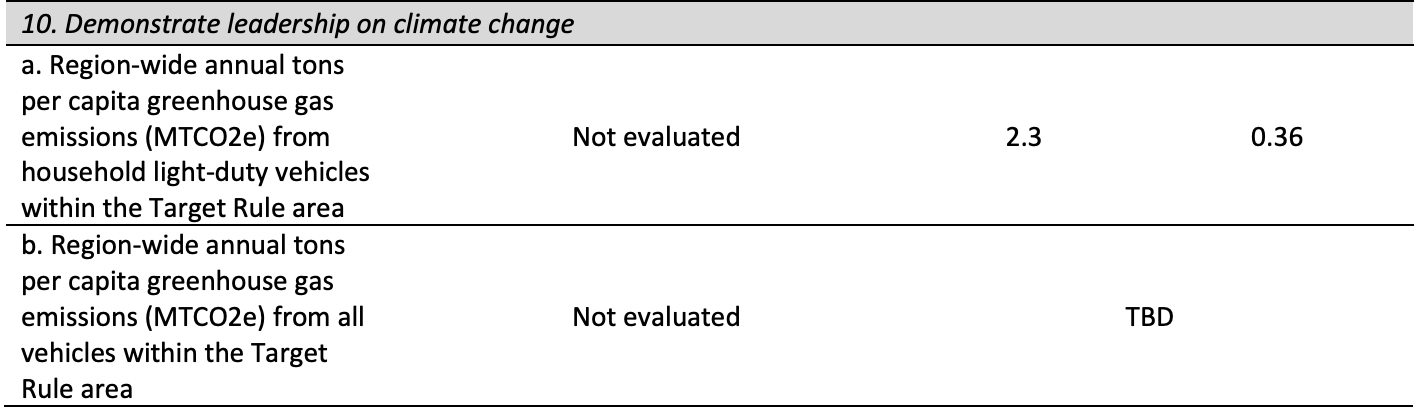
Despite these commitments, Metro’s RTP does not accurately report on regional greenhouse gas emission trends. It does not acknowledge that, contrary to the 2014 CSS and the 2018 RTP, transportation greenhouse gas emissions are increasing, not decreasing. The 2023 RTP contains no graph or time series information on transportation greenhouse gases in Portland; in contains only a single reference to the per capita level of greenhouse gas emissions in 2023 and 2045; both of these figures are obtained from Metro’s model, not from actual inventories of greenhouse gas emissions prepared by independent agencies.
We are “deviating significantly” from our earlier projections and plans, but we haven’t acknowledged it, and therefore, aren’t proposing to change our plan.
The RTP substitutes inaccurate models for actual data
ODOT, Metro, and LCDC are substituting flawed and biased models for actual data about carbon emissions. Transportation greenhouse gas emissions are increasing, yet all these agencies pretend, based on inaccurate models, that they’re making progress toward reducing greenhouse gases. The actual data show that vehicles on the road today (and tomorrow) are vastly older and dirtier than assumed in the models these agencies use to falsely portray their climate progress.
Both the LCDC rules and the Metro RTP are based on flawed modeling of greenhouse gas levels. The modeling makes a series of incorrect and unsupported assumptions about vehicle fuel efficiency and emissions reduction technology. As a result, the modeling significantly understates the actual level of greenhouse gases produced by transportation, and overstates the current and future reductions in greenhouse gases due to greater efficiency.
The 2022 LCDC “Climate Friendly and Equitable Communities” Rule relies on 2016 modeling prepared by former ODOT employee Brian Gregor. These figures have not been updated, despite a legal requirement that they do so.
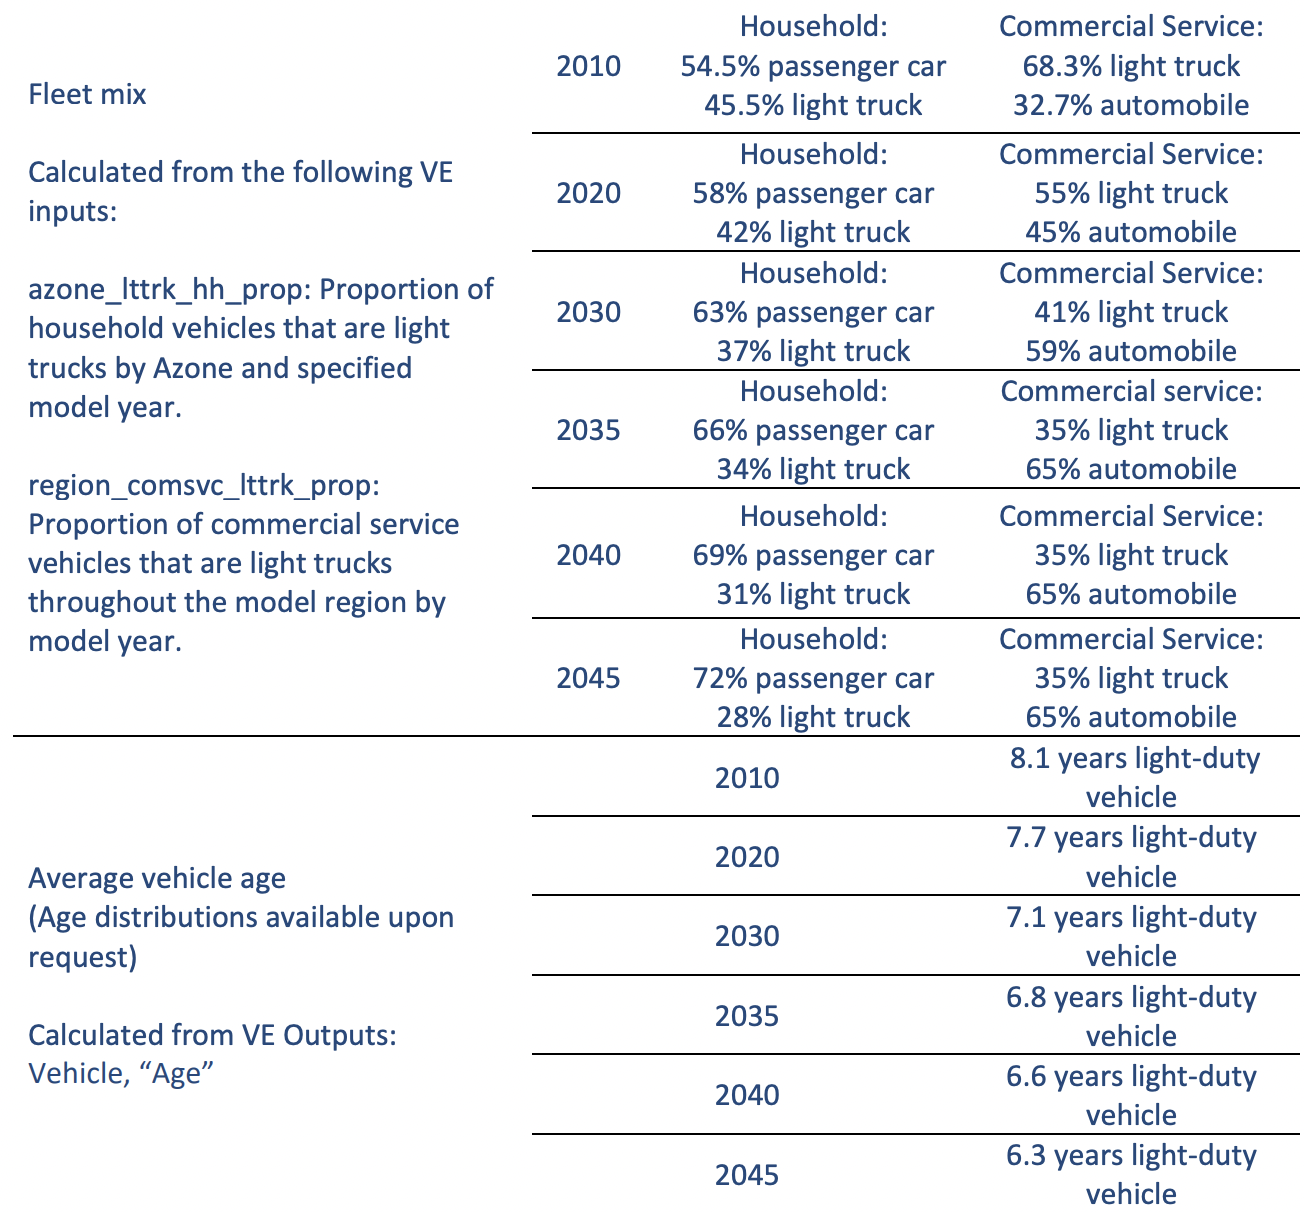
For the current RTP, Metro claims to have done new modeling with its “Vision Eval” model. That modeling assumes that average vehicle ages fall to less than seven years, and that passenger cars make up more than 70 percent of household vehicles.
Both Gregor’s and Metro’s climate modeling assumes we will quickly replace the existing fleet of large, dirty fossil fueled vehicles, with newer, smaller, more efficient vehicles powered by electricity and/or clean fuels. The modeling asserted that the amount of carbon pollution generated by each mile of vehicle traveled would be 80 percent less than it is today. Unfortunately, we’re nowhere close to being on this trend.
The key assumptions are average vehicle age and mix of trucks/SUVs Metro and LCDC rely on projections of these emissions that have already been proven wrong. Metro and LCDC assumed, critically and incorrectly, that the vehicle fleet would turnover more rapidly (dirty, older cars would be replaced more frequently by newer, cleaner ones) and that consumer preferences would shift from larger, dirtier trucks and SUVs to smaller and cleaner passenger vehicles. Not only are both of these assumptions wrong, exactly the opposite has happened over the past decade: the average age of automobiles has increased significantly, and the share of light trucks and SUVs has grown to almost 80 percent of new car sales. The following RTP table summarizes Metro’s assumptions:
Metro’s assumptions are simply wrong: the average car on the road today is vastly dirtier than assumed in Metro and LCDC modeling. In essence, the climate modeling assumes that the typical car in today’s fleet is a relatively clean six-year-old Honda Civic, that emits about 257 grams per mile. In reality, the typical vehicle in today’s fleet is a twelve-year-old quarter-ton pickup truck, that emits about twice as much greenhouse gases—555 grams per mile.
2023 Model assumption: Typical car is a 2017 Honda Civic; 2023 Reality: Typical vehicle is a 2010 Ford F-150.
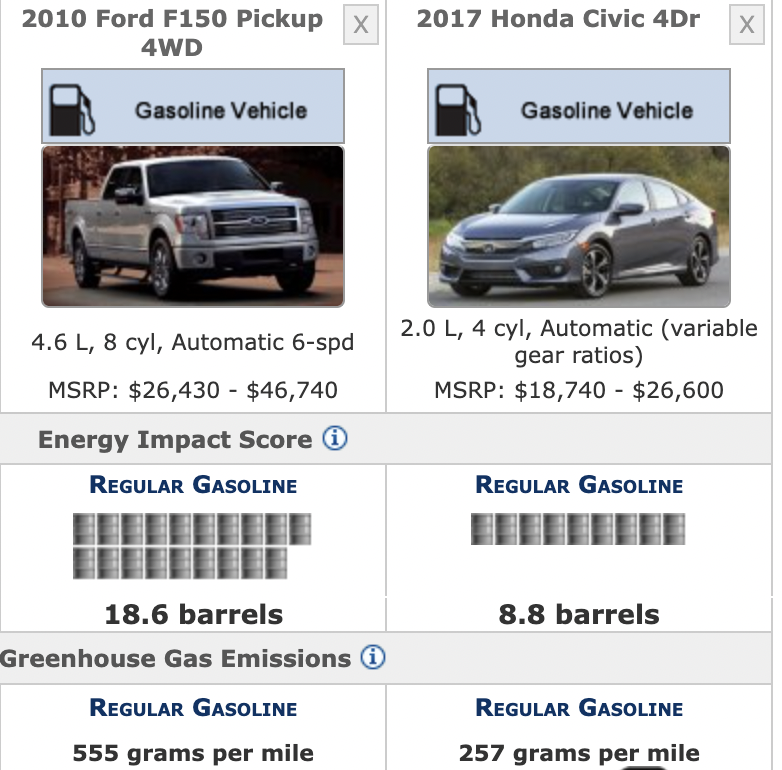
These two mistakes in the Metro/LCDC modeling lead them to understate greenhouse gas emissions from the current fleet by 50 percent.
And these errors also affect future years. The growing longevity of the vehicle fleet means that the future fleet will be less efficient (and much dirtier) than assumed in Metro’s modeling. If the average age of vehicles stabilizes at the current 12 years, the median vehicle in 2035 will be a 2023 model year vehicle (eighty percent of which were larger, more polluting SUVs). Fleet turnover will happen much more slowly, and emission rates will decline more slowly still.
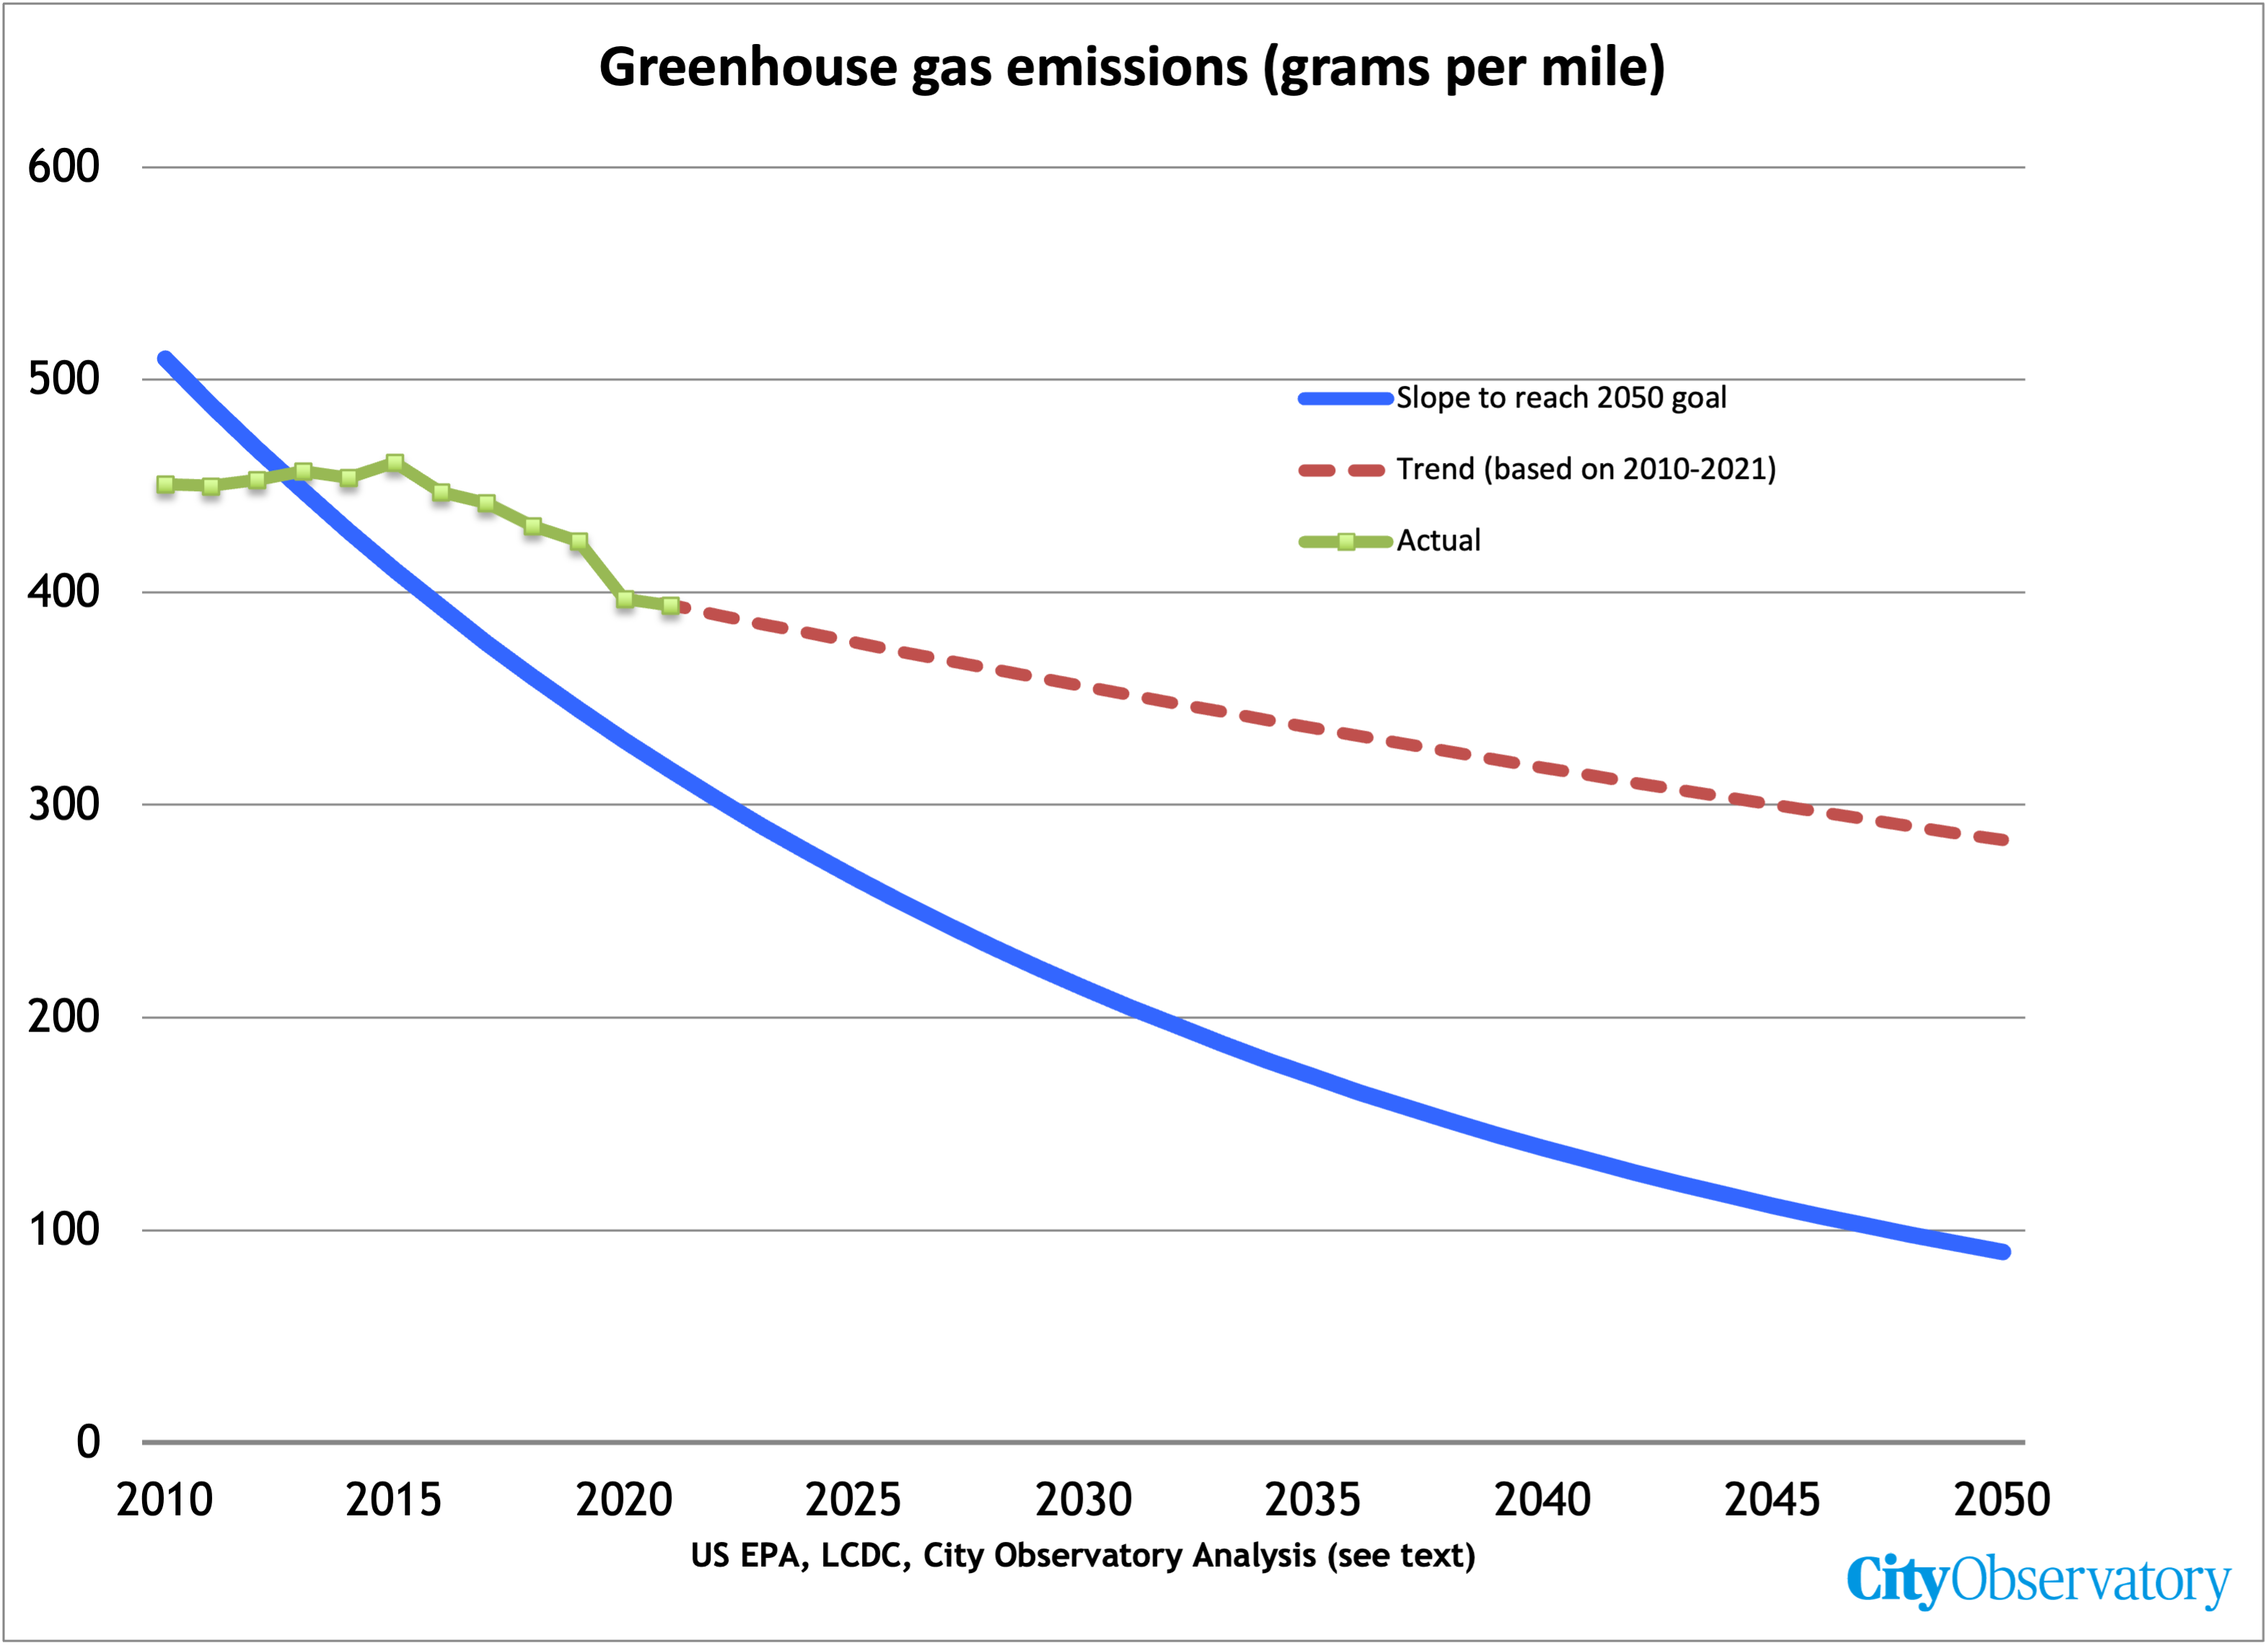
Metro and LCDC projections assume that average emissions of GHGs will fall from about 450 grams per mile to about 100 grams per mile in 2045. In reality, GHG emissions per mile are falling far more slowly. In 2021, the average vehicle emitted about 390 grams per mile rather than the roughly 300 grams per mile assumed in Metro and state climate modeling.
The RTP should be based on actual, honest data about greenhouse as emissions
The first step is to accurately report our progress—actually backsliding—in terms of reducing transportation GHGs. Instead of reporting claims based on models with false and now discredited assumptions, it needs to show that actual GHG emissions are rising, and present a clear case showing why this has happened. It’s been because we’re keeping cars longer, buying bigger, dirtier vehicles, driving more, and not improving fuel efficiency as fast as excessively optimistic assumptions made a decade ago. We have to “mark to market” our forecasts: replace decade old guesses about what our transportation emissions would be with actual data on what we’ve really accomplished.
Once we’ve done that, we’ll see that we need to do much more, and do it far more quickly than we thought. It’s been nine years since Metro adopted its Climate Smart Strategy in 2014. Those nine years represent fully one-fourth of the time available to get the region on track to meet its goal of reducing greenhouse gases by 75 percent by 2050. During those nine years, regional transportation greenhouse gas emissions have actually risen (by more than 20 percent, according to the DARTE inventory). That means we have a bigger task, and a shorter period of time to accomplish it. This simply isn’t reflected in the Regional Transportation Plan, in state land use regulations, or the Oregon Department of Transportation’s “State Transportation Strategy (STS).
Appendix: Vehicles are older, larger and dirtier than assumed in Metro climate models
The strategy assumes trends in vehicle type, fuel efficiency and fleet replacement that are the opposite of what we’ve experienced. All of these errors lead to understating GHG emissions.
REALITY: Average Vehicle Age is Increasing
Slower fleet turnover means that the vehicles on the road are on average, older and dirtier. State modeling assumes that older vehicles are being replaced quickly; with the average age of a vehicle being 6 or 7 years. In reality, the average vehicle is more than 12 years old. The Oregon Department of Transportation reports that the average age of vehicles in Oregon is higher than the national average (14 years) and is increasing. The climate modeling is wildly off: the fleet is getting older, and the models assumed it would be getting younger.
The slow rate of fleet replacement is a particularly large problem for the modeling. With an average age of 12 years, the median vehicle in 2035 will be a 2023 model. Those vehicles average about 330 grams per mile. That’s about 80 percent higher than the 180 grams per mile that state modeling assumes for the fleet in 2035. The increasingly long life of vehicles locks in a high carbon emission rate.
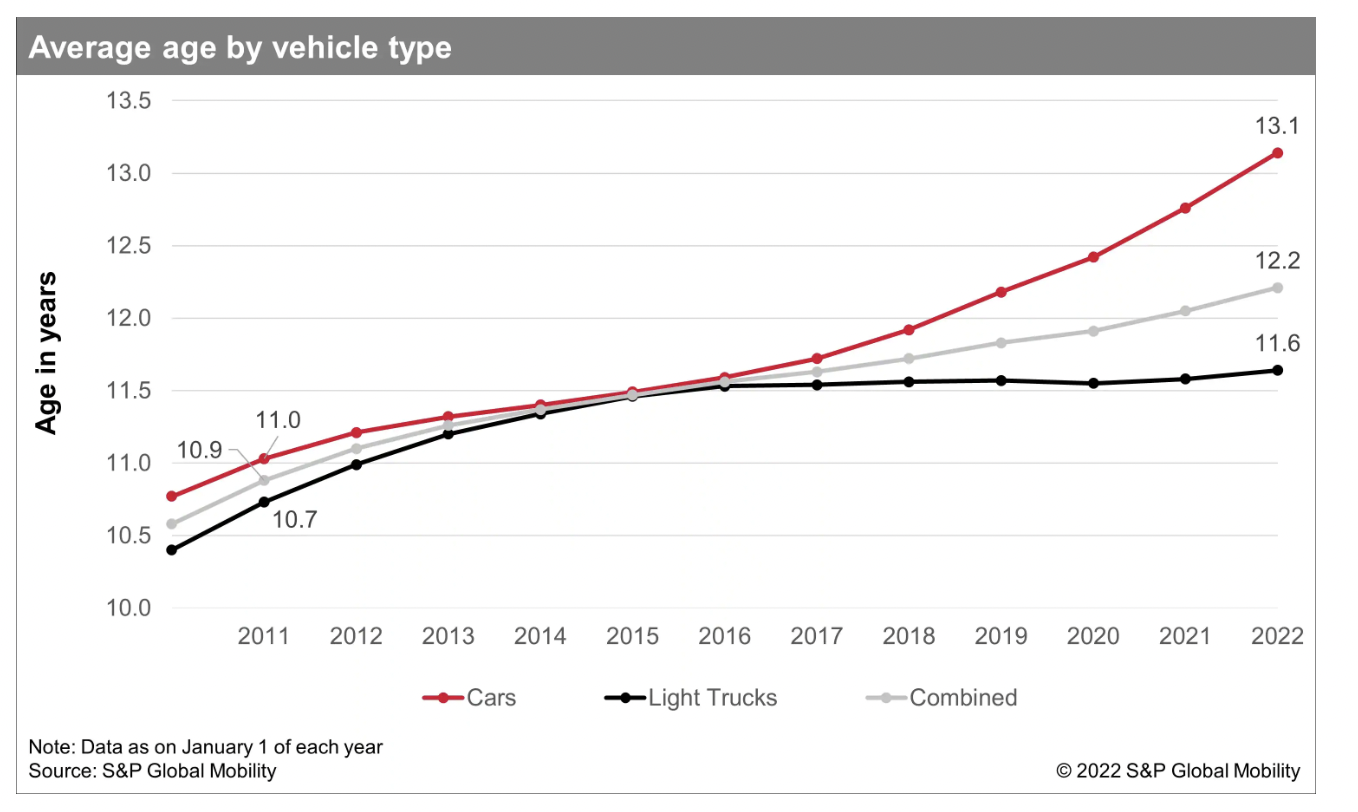
The average age of vehicles on the road has increased to more than 12 years according to IHS Automotive.
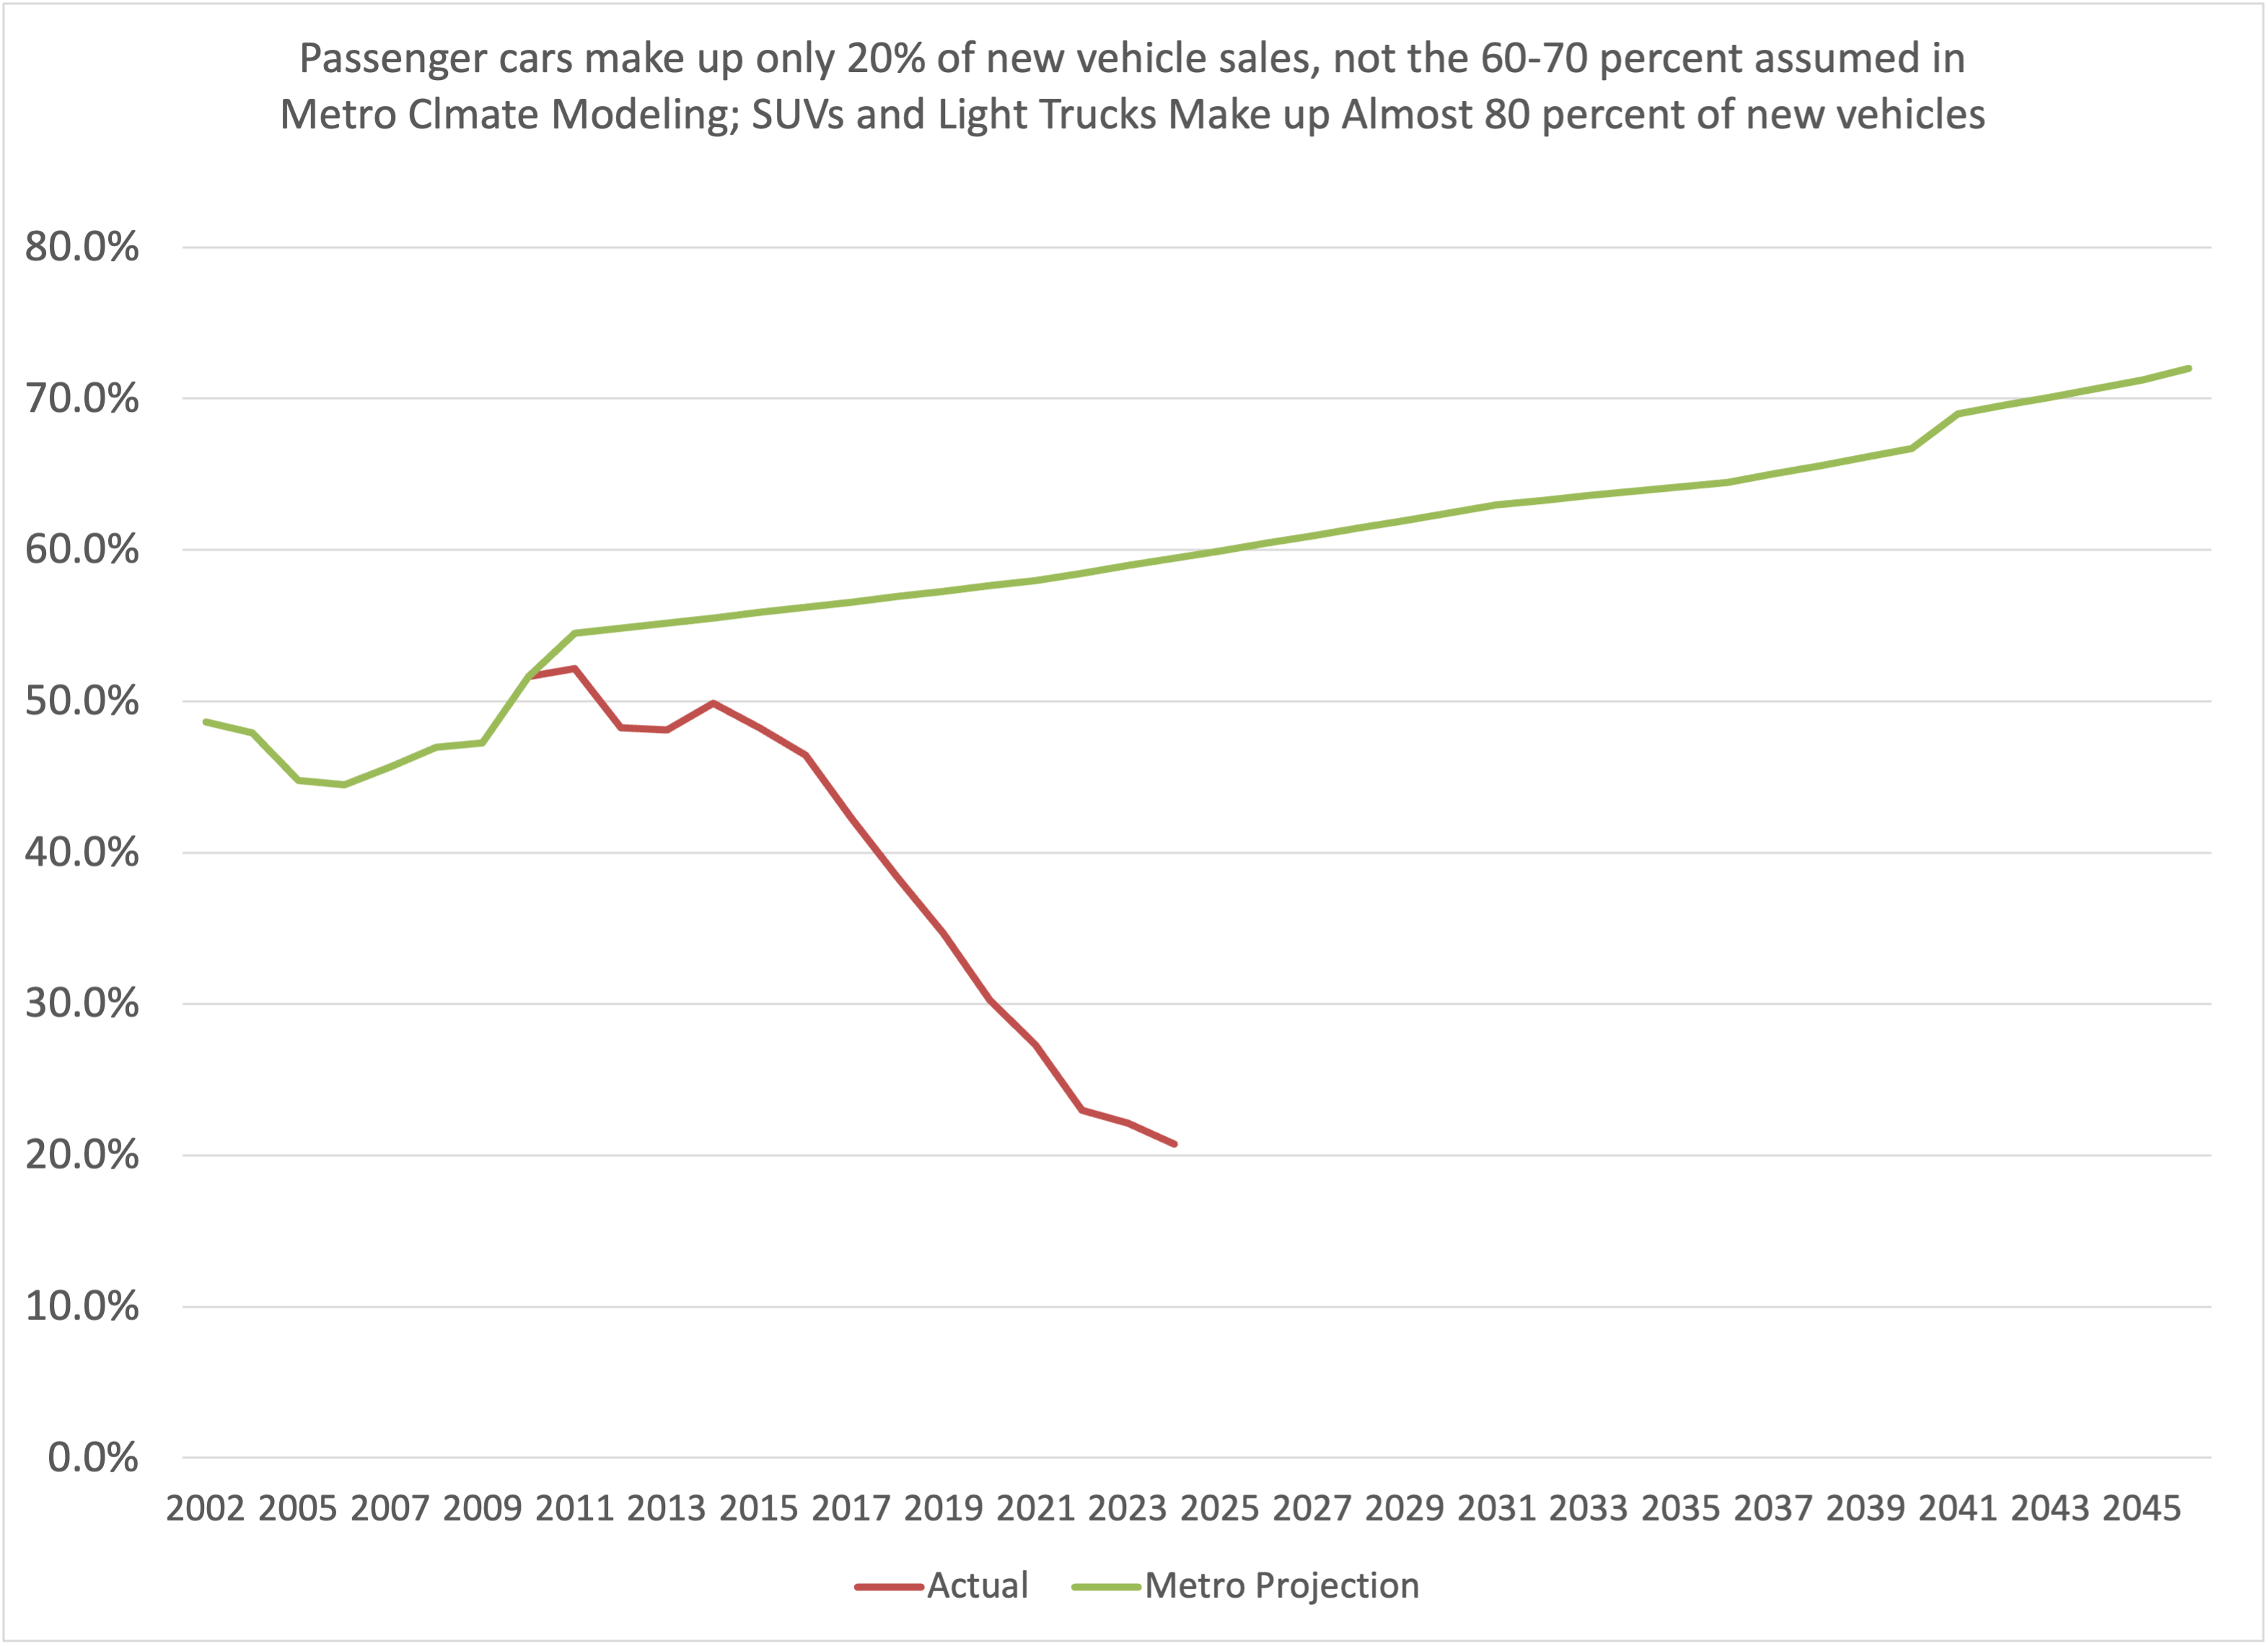
REALITY: Trucks and SUVs make up nearly 80 percent of new car sales.
Fewer passenger cars, more light trucks and sport utility vehicles. State modeling assumed that the share of trucks and SUVs would decline steadily, and that 60 percent or more of all private vehicles would be passenger cars, which use less fuel and emit less greenhouse gases. In reality, nearly 80 percent of new vehicles sold today are light trucks and sport utility vehicles. The climate modeling is off by a factor of three, with passenger cars accounting for 20% of the fleet, not 60 percent.