America’s least (and most) segregated metro areas: 2020
By Joe Cortright
The latest Census data show that Black/White segregation is decreasing in large metro areas.
Racial segregation still prevails in most American cities, but varies widely across the nation.
Portland is one of America’s least segregated metros
One pervasive and lingering hallmark American geography is racial residential segregation: our metropolitan areas have literally been divided by race, and as numerous studies have shown, this has undercut opportunity, perpetuated poverty, limited economic mobility and eroded Black wealth. The data from Census 2020 give us the latest readout on the patterns and trends of segregation in large US metro areas.
Measuring Black-White Segregation
One of the most common measures of racial segregation is the dissimilarity index, which measures the extent to which different groups of people live in different neighborhoods in a city or metro area. The index ranges from zero (perfectly integrated, where the composition of each neighborhood matches the composition of the larger region) to one (completely segregated) where each neighborhood consists entirely of persons of a single racial or ethnic group). The dissimilarity index expresses the percentage of the population that would need to move to a different neighborhood in order for each neighborhood’s racial/ethnic composition to match that of the larger area.
Brown University’s Diversity and Disparities project has used data from Census 2020 to compute the Black-White Dissimilarity Index for all of the nation’s larger metropolitan areas. (It’s website also has data making the same computation for earlier decades, going back to 1980). The Black-White dissimilarity index measures the spatial separation of Black and white residents within metropolitan areas, and as described above, represents the fraction of the Black or white population that would have to move to a different neighborhood (in this case, a different Census tract) in order for each tract to have the same racial composition as the overall metro area.
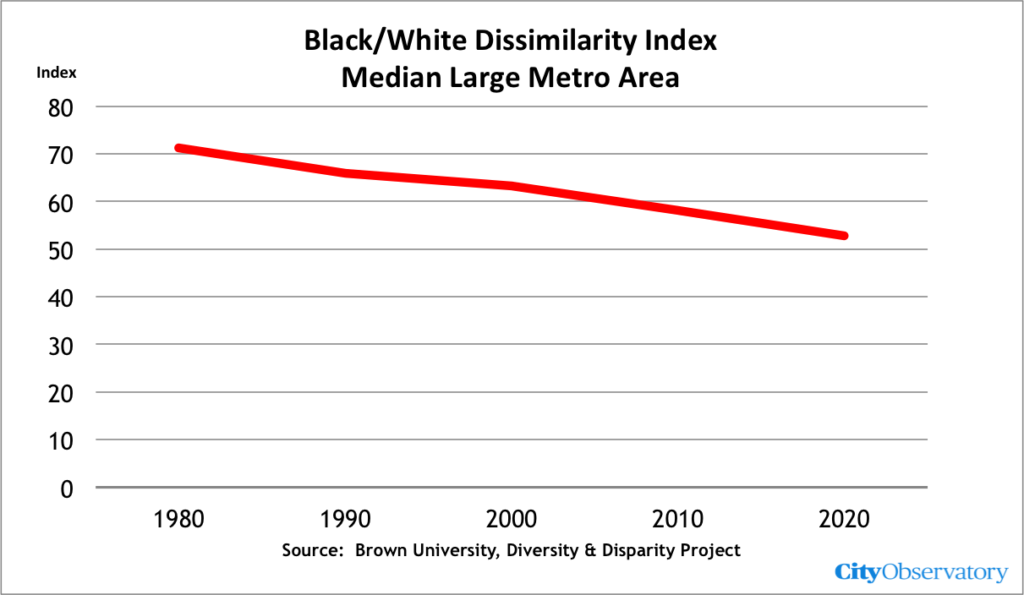
As usual at City Observatory, we’re focused on the 53 US metro areas with populations of 1 million or more population. Overall, the Brown University tabulations show that Black-white segregation in the US is continuing to decline. The median Black-White dissimilarity index for these large metro areas was 52.8 in 2020, down from 58.2 in 2010, and from 71.2 in 1980.
The median level of segregation, according to this measure has been declining now for the past half century or more. Still, a dissimilarity index of 50 or more is quite high, and many metro areas continue to have even higher levels of segregation.
America’s Least (and Most) Segregated Metro Areas
This chart ranks cities from least segregated to most segregated using the Black/white dissimilarity index for each metropolitan area. As noted, in 2020, the median large metro area had a dissimilarity index of 52.8, meaning that about 53 percent of a city’s population would have to move to balance the composition of individual neighborhoods to the region’s overall demographic composition. About half of all large metros have dissimilarity indices between about 46 and 60.
The metros with the highest levels of segregation according to this measure are MIlwaukee, Detroit, New York and Chicago. Each of these metros has a Black-white dissimilarity index exceeding 70.
The cities with the lowest levels of segregation are Tucson, Salt Lake, Portland, San Jose. Each of these metros has a dissimilarity index of 45 or less.
Portland’s big decline in segregation
Portland has not always been a highly integrated place. If we look at the historical data on the black-white segregation index for Portland for the period 1970 through 2020, we see that Portland went from being one of the most racially segregated metro areas to one of the least. Data compiled by Sophie Litschwartz at the Urban Institute shows that in 1970, Portland was actually more segregated than the typical large metro area, with a Black-White dissimilarity score of 79.7, compared to a national metro median of about 76.5. Portland’s segregation has declined sharply since then. Portland’s black-white segregation measure fell by more than half, (by almost 45 points) in 50 years; while the median rate for large metro areas fell by about 23 points. Our earlier analysis showed that Multnomah County (at the center of the region, and encompassing the City of Portland) has the lowest white/non-white dissimilarity index of any large, central urban county in the nation’s largest metro areas.
America’s least (and most) segregated metro areas: 2020
The latest Census data show that Black/White segregation is decreasing in large metro areas.
Racial segregation still prevails in most American cities, but varies widely across the nation.
Portland is one of America’s least segregated metros
One pervasive and lingering hallmark American geography is racial residential segregation: our metropolitan areas have literally been divided by race, and as numerous studies have shown, this has undercut opportunity, perpetuated poverty, limited economic mobility and eroded Black wealth. The data from Census 2020 give us the latest readout on the patterns and trends of segregation in large US metro areas.
Measuring Black-White Segregation
One of the most common measures of racial segregation is the dissimilarity index, which measures the extent to which different groups of people live in different neighborhoods in a city or metro area. The index ranges from zero (perfectly integrated, where the composition of each neighborhood matches the composition of the larger region) to one (completely segregated) where each neighborhood consists entirely of persons of a single racial or ethnic group). The dissimilarity index expresses the percentage of the population that would need to move to a different neighborhood in order for each neighborhood’s racial/ethnic composition to match that of the larger area.
Brown University’s Diversity and Disparities project has used data from Census 2020 to compute the Black-White Dissimilarity Index for all of the nation’s larger metropolitan areas. (It’s website also has data making the same computation for earlier decades, going back to 1980). The Black-White dissimilarity index measures the spatial separation of Black and white residents within metropolitan areas, and as described above, represents the fraction of the Black or white population that would have to move to a different neighborhood (in this case, a different Census tract) in order for each tract to have the same racial composition as the overall metro area.
As usual at City Observatory, we’re focused on the 53 US metro areas with populations of 1 million or more population. Overall, the Brown University tabulations show that Black-white segregation in the US is continuing to decline. The median Black-White dissimilarity index for these large metro areas was 52.8 in 2020, down from 58.2 in 2010, and from 71.2 in 1980.
The median level of segregation, according to this measure has been declining now for the past half century or more. Still, a dissimilarity index of 50 or more is quite high, and many metro areas continue to have even higher levels of segregation.
America’s Least (and Most) Segregated Metro Areas
This chart ranks cities from least segregated to most segregated using the Black/white dissimilarity index for each metropolitan area. As noted, in 2020, the median large metro area had a dissimilarity index of 52.8, meaning that about 53 percent of a city’s population would have to move to balance the composition of individual neighborhoods to the region’s overall demographic composition. About half of all large metros have dissimilarity indices between about 46 and 60.
The metros with the highest levels of segregation according to this measure are MIlwaukee, Detroit, New York and Chicago. Each of these metros has a Black-white dissimilarity index exceeding 70.
The cities with the lowest levels of segregation are Tucson, Salt Lake, Portland, San Jose. Each of these metros has a dissimilarity index of 45 or less.
Portland’s big decline in segregation
Portland has not always been a highly integrated place. If we look at the historical data on the black-white segregation index for Portland for the period 1970 through 2020, we see that Portland went from being one of the most racially segregated metro areas to one of the least. Data compiled by Sophie Litschwartz at the Urban Institute shows that in 1970, Portland was actually more segregated than the typical large metro area, with a Black-White dissimilarity score of 79.7, compared to a national metro median of about 76.5. Portland’s segregation has declined sharply since then. Portland’s black-white segregation measure fell by more than half, (by almost 45 points) in 50 years; while the median rate for large metro areas fell by about 23 points. Our earlier analysis showed that Multnomah County (at the center of the region, and encompassing the City of Portland) has the lowest white/non-white dissimilarity index of any large, central urban county in the nation’s largest metro areas.
Related Commentary