A new scorecard tries to measure how cities are promoting energy efficiency and reducing greenhouse gases—a laudable goal. But the scorecard has some serious limitations.
This scorecard emphasizes policies and process over measurable progress—only 6 of a possible 250 points are tied directly to lowering greenhouse gas emissions
Scores and rankings can help motivate action, but are only useful if they matter for reducing greenhouse gases and energy use
Relying on self-reported emissions data fails to hold cities accountable and undermines the validity of the scorecard
This scorecard didn’t obtain independent data on city level energy use or emissions
Available independent data shows most cities are doing far worse in reducing transportation emissions than claimed in their scorecard reporting.
The scorecard under-emphasizes transportation, the largest and fastest growing source of GHGs, and the one most amenable to local action
The American Council for an Energy Efficient Economy (ACEEE)has just released its seventh scorecard ranking the nation’s largest cities on their clean energy efforts. In many was this is a prodigious and comprehensive report, cataloging dozens of different local policies in evaluating what cities have done to promote energy efficiency and reduce greenhouse gases.
The authors of the 2024 City Clean Energy Scorecard describe it as:
. . the go-to resource for tracking clean energy plans, policies, and progress in large cities across the United States. It compiles information on local policies and actions to advance energy efficiency, and decarbonization more broadly, comparing 75 large cities across all energy sectors. It also assesses cities’ focus on equity, policy performance, and smart growth across these sectors. The scores we report identify high-achieving cities and those with significant room to strengthen their policy efforts. Our focus on policies and programs also makes the Scorecard a road map for local governments aiming to scale up their clean energy initiatives in pursuit of their climate change mitigation goals.
Comparing different cities and their policies, promoting learning and friendly competition, and providing accountability can all be furthered by this kind of a scorecard. Despite the breadth of data, the Clean Energy Scorecard has crucial flaws that limits its usefulness.
While it serves as a useful directory of policies, the report falls short as a true “scorecard” of which cities are making measurable progress on using less energy and generating fewer greenhouse gases. The report’s scoring methodology weights box-ticking policies and processes above actually measurably reducing greenhouse gas emissions. Of the 250 points the scorecard’s rubric allocates towards a city’s rating, just nine points are driven by measured progress in reducing greenhouse gases and energy use.

Too little emphasis on ultimate outcomes
Ultimately, the objective of clean energy policies is to reduce pollution, particularly greenhouse gases. But this scorecard presents precious little information on how much progress cities are actually achieving in reducing pollution. Only two indicators representing 9 of the 250 points reflect actual direct progress in reducing either greenhouse gases or vehicle miles traveled.
- Community-wide climate goal progress. – 6 pts
- Progress achieved toward VMT/GHG goal – 3 pts
Here’s ACEEE’s diagram showing the scope of its metrics. We’ve added two black squares to show the relative weight for climate goal progress and VMT/GHG progress.
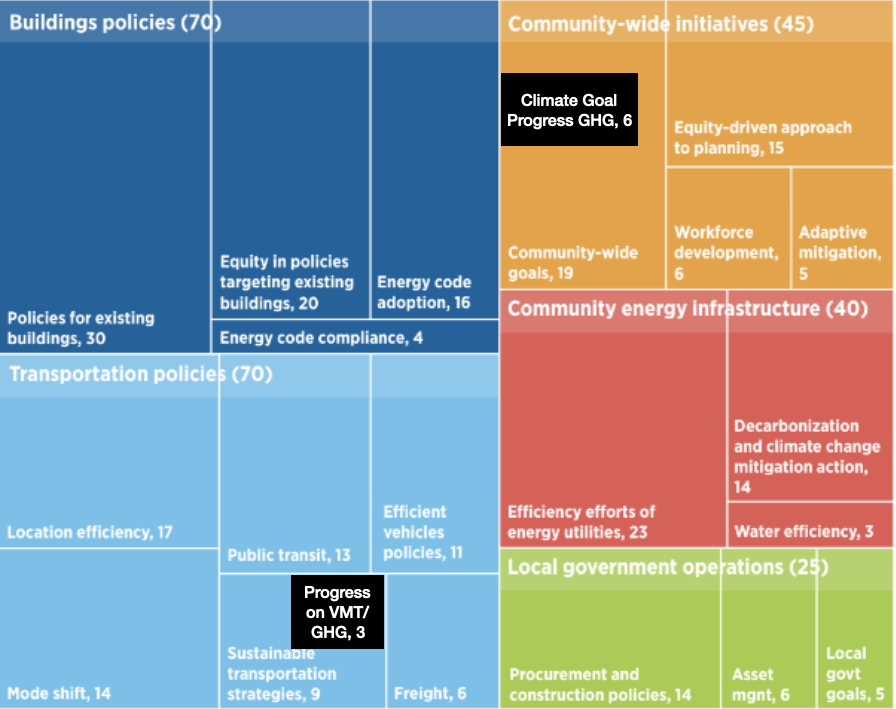
In contrast, the index is replete with points for equity. According to its own tabulation, there are 35 different equity measures, collectively worth up to 84.5 points. There’s nothing wrong with an index that measures equity, but it’s not really a climate or energy efficiency index. And the fact that this index is so weighted toward vague and procedural measures with at best a loose and indirect connection to reducing energy use or greenhouse gases, and gives almost no weight at all to actual progress on ultimate outcomes, speaks volumes. This is like trying to score a soccer game by giving a combined 241 points for saves, passes, shots, corner-kicks, throw-ins, off-sides, tackles, fouls, team age and demographics, average height, distance run, years of experience, sustainabililty of team jerseys and coach’s multilingualism, and 9 points for the number of goals a team scored.
This is comprehensive and data rich, and but ultimately tells us nothing about whether anyone is actually making any progress. It’s a kind of box-ticking and merit-badge approach to policy that fails to ask the fundamental question as to whether any of this is working. The inclusion of all of these multiplicity of policy measures amounts to, as the lawyers would say, “assuming facts not in evidence”—specifically the assumption that the listed policies are individually or collectively necessary and sufficient to achieve these desired ends.
In addition, the failure to emphasize outcomes (lower greenhouse gases) and to not systematically link this wealth of policy and process information to variations in performance is a huge missed opportunity. What are the policies and processes that the most successful cities employed in reducing their emissions? In theory, the information marshaled in this scoreboard should provide a compelling narrative about how one goes about making serious progress on outcomes. Instead, it is merely a catalog of policies.
In addition to putting very little weight on actual performance, cities can get credit even if they adopt relatively feeble goals and even if they make only partial progress toward achieving them. The scoring rubric for greenhouse gas emissions gives cities more points for setting a goal, than for actual progress. A city get full points for progress even if your projections show you will fall as much as 25 percent below achieving your stated goal, and you get maximum progress points regardless of how stringent or aggressive your goal actually is.
![]()
A close look at the transportation metrics
In our view, any such scorecard ought to place more emphasis on transportation emissions. Only 70 of 250 points in the scoreboard are awarded based on transportation policies. Nationally, and in most cities, transportation is now the largest source of greenhouse gases. Transportation emissions are growing faster than other sectors (like electricity generation and building efficiency) where we are actually making substantial progress in reducing greenhouse gas emissions. Transportation is also the policy arena most in the control of cities, which through land use policies and transportation investments can either reduce driving and associated pollution, or perpetuate and expand energy-inefficient car-dependent development patterns.
Given that transportation is the major contributor to energy inefficiency and greenhouse gas emissions, it is shocking how few plans set goals or track energy use and emissions from driving. The report makes this clear: Fewer than half of the 75 cities covered in the report have a separate goal of reducing VMT or transportation GHGs; of those only eight provided measurable data on progress in their plans.
GHG emissions from transportation sources occupy a large and growing share of overall city emissions. To address this, cities are adopting transportation-specific emissions or VMT reduction goals. These goals are good indicators that cities are prioritizing emissions reductions and energy savings in their transportation activities. Seventy-one cities have adopted sustainable transportation plans, but only 31 have a VMT or GHG goal associated with those plans. City transportation GHG emissions data are still lacking, and there is an even greater dearth of VMT data. Nine [sic] cities in the Scorecard have the necessary data to calculate progress toward their transportation goals. However, only San Diego is on track to meet its goal. Figure 15 illustrates how these cities are performing, on a per capita basis, in their efforts to meet their transportation-specific GHG emissions or VMT reduction goals. (Page 49)

At best, this is mixed progress: City reports suggest only one city (San Diego) claims it is exceeding its (modest) reduction target, three cities claim to be reducing GHG or VMT (though more slowly than targeted), and the remaining four are going in the wrong direction. But it’s important to keep in mind that these data on progress appear to be self-reported information provided by the participating cities. The report doesn’t make clear that the “actual annual reduction” shown for the handful of cities with such data is reliable, consistent or independently verified.
The self-reported IEEE performance scores exaggerate city progress
The limited sources of data we do have on GHG that are estimated consistently on a national basis suggest that all but one of these regions has likely made much less progress than shown here. Using data from the nationwide DARTE database of transportation greenhouse gas emissions, we’ve calculated the average annual rate of change of transportation GHGs for the latest 5 years for which data are available for the county corresponding most closely to each listed city; the red rectangles on this chart (added by City Observatory) show the DARTE estimates for each city.
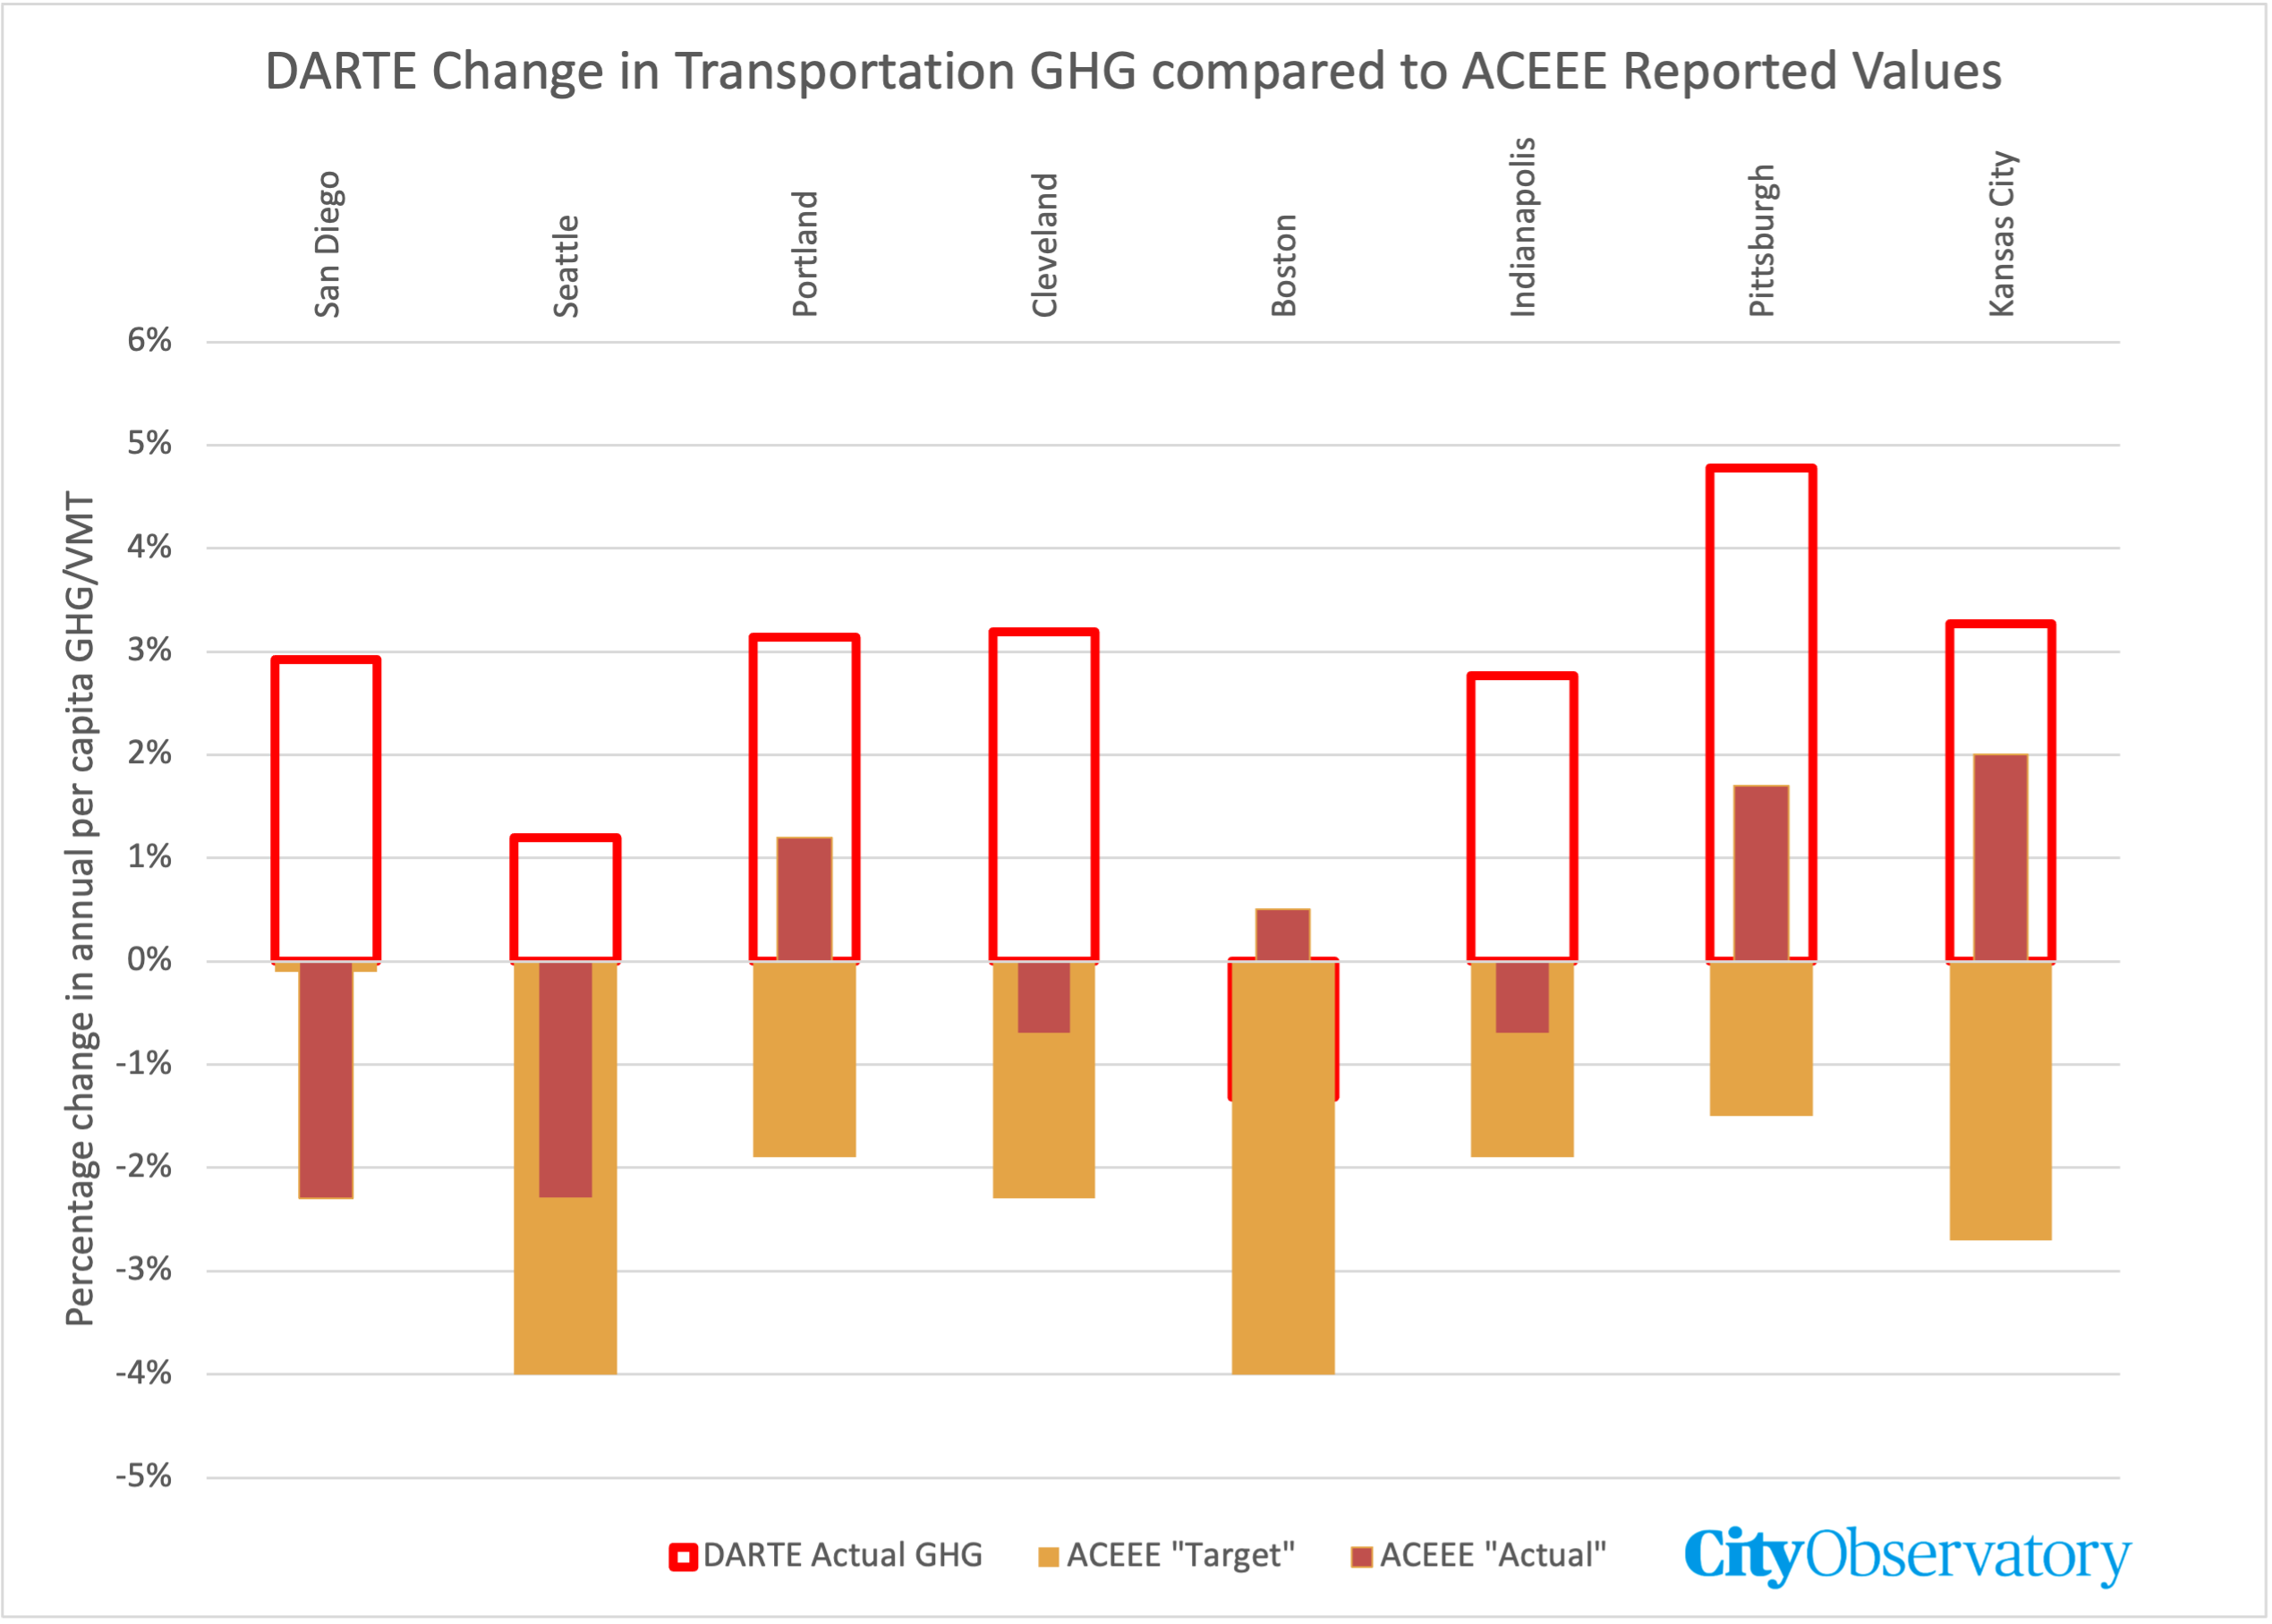
With the exception of Boston (where DARTE reports a decline in annual per capita emissions averaging 1.3 percent per year between 2012 and 2017), every one of these cities recorded an increase in transportation greenhouse gases. That’s seven of the eight cities, not merely failing to make adequate progress to achieve their goals (which call for a 1-2 percent per year decline in transportation GHGs), but shows that they are actually going in the wrong direction at a rapid clip (with transportation GHGs increasing by 2-3 percent per year for most cities). To be sure, there are important caveats in trying to validate the IEEE figures against those from DARTE: the IEEE report doesn’t specify the time period of different city reports, or their scope of their data, or even whether the city measures VMT or GHG.
City reports don’t square with state data
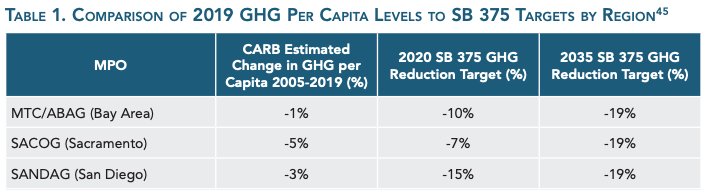
The information reported for the one self-reported standout (San Diego), doesn’t square with data compiled by the California’s Air Resources Board. CEEE claims that San Diego had a goal of reducing transportation GHG/VMT by about 0.2 percent per year and actually achieved reductions of more than 2 percent per year. The Air Resources Board, which tracks both VMT and GHG for all California counties reports that San Diego achieved a total reduction in greenhouse gas emissions per capita of about 3 percent between 2005 and 2019, compared to a legislatively adopted goal for San Diego of a 15 percent reduction by 2020. On an annual basis, San Diego reduced emissions about .21 percent per year, compared with a goal of reducing emissions about 1 percent per year.
Our own experience with city governments self-reported progress on emissions gives us pause. Portland’s city and regional governments both have climate plans, and ostensibly monitor progress. But a careful review of their annual reports shows that that they overstate actual progress in emission reductions, and ignore or omit data sources that show the city and region are manifestly failing to reduce emissions. There are strong institutional and political pressures for cities to emphasize the positive, and not admit that what they’re doing isn’t working. That’s exactly the kind of problem that a scorecard should be designed to solve, but unfortunately, the IEEE Scoreboard repeats and amplifies the biases of self-reporting, rather than holding cities accountable.
The inconsistency between the progress reported by IEEE (from city self-reporting) and the arguably independent data from DARTE and ARB, underscores the importance of having any objective, consistent source of data for measuring outcomes. It’s far from clear that the 75 cities in the IEEE sample measure energy use or greenhouse gases in the same way, and simply echoing their self-reported metrics fails to establish meaningful accountability.
The challenge of determining whether policies are actually working or even really exist
The biggest concern with the heavy weighting toward policy and process indicators is that they divert attention from the more important questions of whether the policies are actually working. But ascertaining whether a given jurisdiction actually has an effective, impactful policy is also an opaque and judgmental process. Even if a city has a particular policy on the books or purports to have an equitable planning process, how to researchers at ACEEE assess, validate and compare the efficacy of these policies? The success of a policy hinges on implementation and follow through, and many promising policies go nowhere or are abandoned. For example, the .report credits Portland with a number of policies adopted as part of its 2015 Climate Action Plan, including a pledge to reduce per capita VMT by 30 percent:
The city’s Climate Action Plan, adopted in 2015, contains a goal to reduce VMT 30% from 2008 levels by 2030″. (Appendix page 167)
The trouble is that Portland’s Climate Action Plan was effectively superseded in 2020, and the 30 percent VMT reduction goal quietly abandoned. That’s a nuance that’s hard to discern from a distance, but is typical of the kind of problem one has in assessing policies.