Portland is utterly failing to reduce greenhouse gas emissions from transportation, but not to worry, its ticking lots of boxes in its bureaucratic check-list.
The city walks away from its 2015 Climate Action Plan after an increase in greenhouse gases, but promises to do better (and more equitably) in the future.
Portland’s greenhouse gas emissions increased by 440,000 tons per year, instead of decreasing as called for in its 2015 plan.
Increased driving due to cheap gas has wiped out all the city’s climate progress in other sectors in the past five years.
We’re frequently told that when it comes to dealing with climate change, if our national government doesn’t step up (and it hasn’t under the current administration), not to worry, because the nation’s cities, and the mayors who lead them are as green as can be.
To be sure, mayors have loudly proclaimed their commitments to (future) greenhouse gas reductions, and fealty to the Paris Climate Accords, but rhetoric and pledges are one thing, and lower rates of carbon emissions are another. While plans are nice, we really need to be focusing on the results that the plans are producing.
When it comes to Portland, one of the self-proclaimed leaders of North American climate change cities, the results are disappointing, and the explanations are, at best, disingenuous.
Portland was one of the first cities in the US, to adopt and explicit grenehouse gas reduction goal in 1993. The city’s website boasts:
Portland is tackling climate change head on. We were the first US city to adopt a carbon reduction strategy in 1993, and our cutting-edge Climate Action Plan put us on a path to reducing emissions by 80% in 2050.
Noble and far sighted, to be sure, but a quarter of a century later, how is the city doing in actually, you know, reducing greenhouse gases?
The answer to that question is supposed to be spelled out in a progress report on the the city’s adopted 2015 Climate Action Plan. The city’s Bureau of Planning and Sustainability last month published “final” report card on the city’s efforts. But rather than being an honest report card, the document amounts to the bureaucratic equivalent of a third-grade participation trophy. The city congratulates itself for its efforts, but the true test of progress, a reduction measured in tons of carbon emissions, shows the plan has been a failure.

The city’s “Final Progress Report” almost completely glosses over the failure to cut emissions modestly in the past five years, and now the City has quickly moved on to a much more ambitious interim goal to cut greenhouse gas emissions by 50 percent from 1990 levels (up from 40 percent), in its new Climate Emergency Declaration.
Let’s get to the heart of the matter: The key element on the plan is reducing emissions. Here’s the report’s summary of our progress:
The 2018 data also shows that carbon reductions have started to plateau and that current emissions trends are not sufficient to meet the needed reduction targets that need to be achieved. To achieve the goal of a 50% reduction in carbon emissions by 2030 as identified by climate science, local emissions must be reduced by an additional 31% in the next 10 years. This is a daunting task.
Actually, the report doesn’t present the actual emissions data; instead, it links to another report (the September 2019 report we wrote about here) that has the data, and that report includes data only through 2017.
A checklist isn’t a climate strategy
The bulk of the city’s self-congratulatory report card consists of describing a laundry list of 247 actions that were mentioned in the previous climate action plan, and briefly rating each as either complete, on track or “facing obstacles. The actions include sweeping and important policies that would make a big difference (like Item 1H: carbon pricing, which is “facing obstacles), and administrivia, like planning for actions with minimal benefits (“Item 6B: explore options intelligent transportation system, complete). Nothing in the report calculates or categorizes the impact of any of these individual actions on the region’s greenhouse gas reduction progress (or lack thereof).

Put another way: If you successfully implemented all or most of your checklist actions, and you’re not making progress on reducing GHG, then something is fundamentally wrong with your plan.
Plans have to be accountable, not just for endless checklists of busy-work tasks, but actually achieving measurable results. Ironically, the plan itself calls for more measurability, but as noted above, it simply failed to report the annual data showing that by the CAP’s own metrics, that its failing.
Mission unaccomplished
Its clear from the tone of the report card, that the City is simply walking away from its 2015 plan–even though its substantive goals haven’t been accomplished. The title of the report is “Final Progress Report.” All of the references to the plan are in the past tense, for example:
The Climate Action Plan was an important roadmap over the last five years to help ensure the City and County continued their progress toward carbon reduction goals. The 2015 Climate Action Plan broke important new ground by including several important elements:
(Report, page 65).
City officials promise accountability, but if they simply walk away from plans after five years, without seriously acknowledging their failure, and analyzing the reasons for that failure, and begin by writing a new plan, de novo, as the city now proposes, there is no accountability. Moreover, the city’s “final report” disappears the few bits of serious number-crunching that were done in the 2015 plan, showing that we’d need to dramatically reduce vehicle miles of car travel in order to achieve our carbon goals.
The 2015 plan was explicit about what would be needed. It laid out a carbon budget that did the math on what we would have to do to reach our goals. Specifically:
For example, by 2030 emissions from the building energy and transportation sector must be approximately 40 percent below 1990 levels (see Table 1). In 2050, residents must be able to meet all of their needs while using 62 percent less electricity and driving 64 percent fewer miles than they do today (see Table 2). (This also assumes a shift to cleaner electricity sources and more efficient vehicles.)
Climate Action Plan, 2015, page 19

In place of tangible, measurable indicators of progress toward our stated goal, the City’s climate emergency declaration offers vague exhortations about future process.
As they walk away from the 2015 plan, there’s as yet no plan to take its place. There are vague statements about process going forward, descriptions of how the city might do something else, but few if any actual policies. The City’s Climate Emergency Resolution directs BPS, by the fall of this year to “co-convene a process” to “identify and implement strategies that will advance a shared solution.”
BE IT FURTHER RESOLVED, that no later than Fall 2020, the Bureau of Planning and Sustainability is directed to work closely with other City bureaus, Multnomah County, frontline communities, and youth-led organizations to establish and co-convene a new and ongoing climate justice initiative that will provide a framework for government and community to work together as equal partners to identify and implement strategies that will advance a shared vision for climate justice and action;
But this new process and the plan it produces, and its specifics are in the future. For now the city has simply closed the book on the 2015 plan, and awarded itself a participation trophy for having done so.
Portland’s 2015 Climate Action Plan has been an abject failure
Its important to look in detail at the data on carbon emissions in Portland for the past decade. They show that the city’s climate change efforts, so far, have failed. In the three years prior to the adoption of the Climate Action Plan (2010 through 2013), the city managed to reduce greenhouse gas emissions by 250,000 tons per year; In the four years between the plan’s baseline and the latest available data, emissions have increased by 110,000 tons per year. In 2013, Portland GHG’s were 7.26 million tons; in 2017, they were 7.7 million tons, an annual increase of 1.5 percent per year, at a time the Climate Action Plan called for an annual reduction of 1.4 percent per year.
In the most basic sense, more greenhouse gas emissions mean your plan isn’t working. The plan characterizes this whopping failure as a “plateauing.”
It also conceals the failure by constantly referring to a 1990 baseline, rather than looking a recent trends (i.e. the past two, five or ten years). In essence, the plan takes credit for emission reductions that happened in the two decades years before the 2015 plan was adopted (i.e. 1990 to 2010), and simply ignores the fact that Portland’s GHG are now going in the wrong direction.
Plateauing is a tacit admission of failure for a plan that depends on large and consistent reductions in emissions. But, to be clear, emissions haven’t plateaued: Portland’s total greenhouse gas emissions as calculated by the city, have risen by 440,000 tons between the CAP baseline year (2013) and the latest year for which data are available (2017).
It’s telling that the report includes no chart showing the needed path of emission reductions between now and 2030 or 2050. Such charts are a staple of climate plans, including the 2015 CAP, which laid out this roadmap for GHG reductions:
 The path laid out in Portland’s 2015 Climate Action Plan
If they’d replicated this chart, with data showing actual progress from 2013 to 2017, and showing their new, much more aggressive goal, it would look like this.
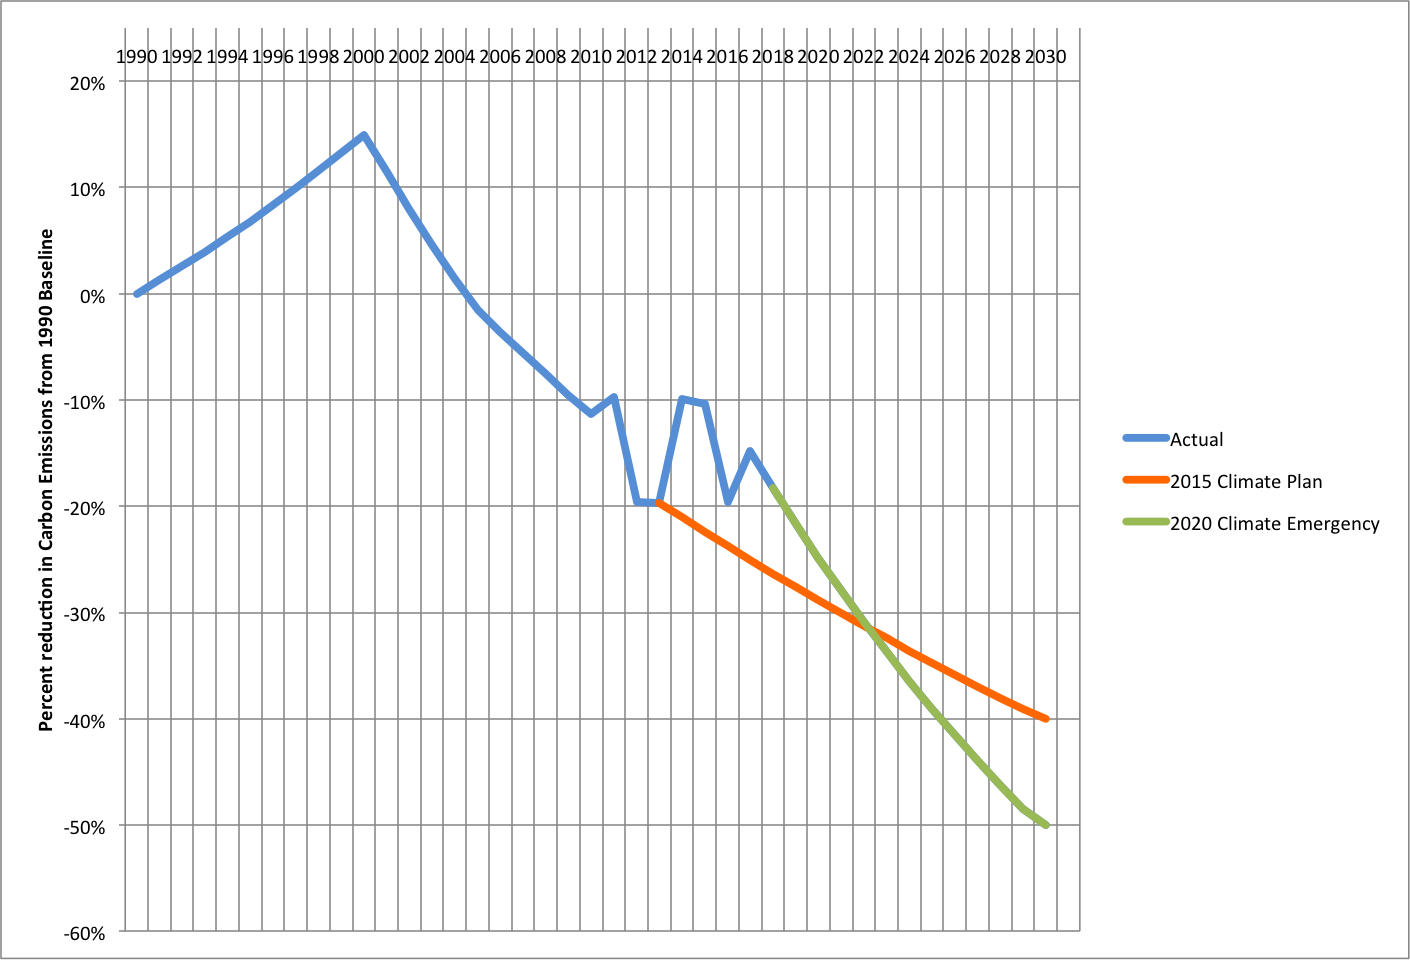
On this chart, the blue line shows actual emissions (as reported by the city), the 2015 plan (the orange line) and the 2020 Climate Emergency Goal (green line). By 2017, in order to be on a path to achieving its 2030 goal, the City needed to reduce greenhouse gases by 25 percent below their 1990 levels; instead, as we’ve noted greenhouse gases rose, and were at 15 percent below 1990 levels. The fact that the blue line is above the orange line shows the city isn’t meeting its previous goal.
And its worth noting just how much more ambitious the new goal of cutting emissions to 50 percent of 1990 levels by 2030 (and to zero net emissions by 2050) is. The much steeper slope of the green line (the new climate emergency goal) implies a vastly bigger lift than the previous (2015) plan, the orange line. Meeting the 2030 goal will require more than twice as much annual reduction (110,000 tons vs 220,000 tons), each year, from now through 2030. The 2015 plan required that the City reduce its emissions by about 1.7 percent per year over 17 years to reach its goal of a 40 percent reduction; its new climate emergency declaration requires a 4.1 percent annual emissions reduction over the next decade to reach its higher 50 percent objective.
The city has raised the bar at exactly the time that its shown that its current efforts simply aren’t working. And unlike the 2015 plan, there’s no detailed calculation of how we’ll achieve this vastly greater level of emissions reductions. Recall that the 2015 plan said we’d need to cut driving in half to achieve a more modest goal over a longer period of time. If the city is serious about achieving this goal, as opposed to just posturing, its essential that they show how the goal can be reached. They haven’t.
What’s needed: A laser like focus on reducing GHG from driving
The startling omission from the report is the fact that it’s been the increase in driving over the past five years that’s undercut our progress toward our stated climate change goals. The report neatly glosses over the fact that emissions, especially from transportation, are rising. It presents one chart showing GHG in 2000 and in 2018 (the year of the latest GHG inventory) and omits data for individual years.

The City’s report card makes it look as if very little has happened—the transportation emissions have gone up, and just a little Leaving out the annual data conceals a much bleaker reality: In the past five years, Portland has recorded huge increases in greenhouse gas emissions. Here are the annual data from the independent, nationally-normed estimates prepared as part of the DARTE GHG inventory, showing the Portland area’s greenhouse gas emissions from transportation. (These data are for the entire metropolitan area).
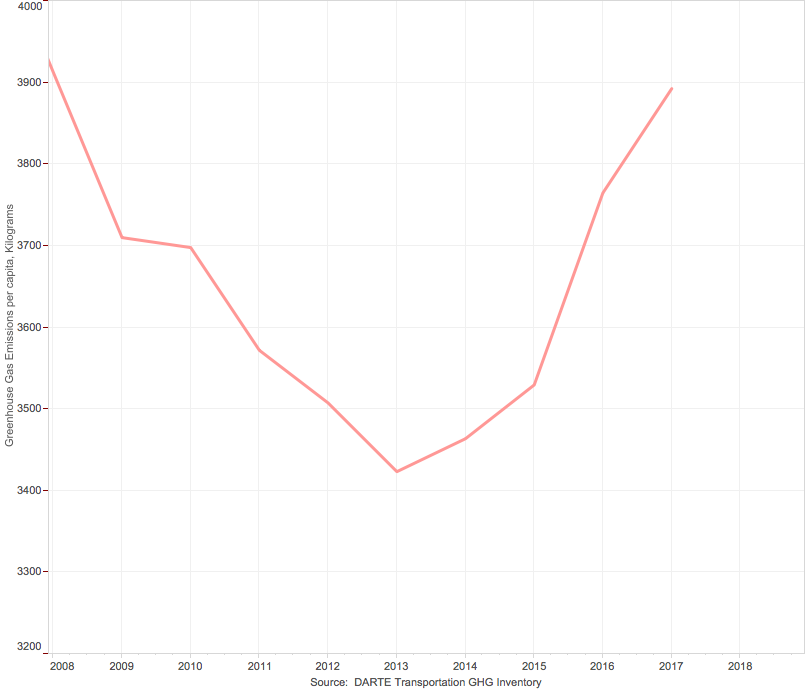
As we’ve noted before at City Observatory, the Portland made good progress until 2013, when increased driving due to cheaper fuel costs produced a surge in vehicle miles traveled and carbon emissions. Portland’s carbon emissions increased by 1,000 pounds per person annually between 2013 and 2018, more than wiping out all the other progress made in reducing greenhouse gases in other sectors.
Portland’s won’t make progress in reducing greenhouse gases until it finds a way to reduce vehicle miles traveled. And it will need to reduce them substantially. As noted above, when it wrote the 2015 plan, the city did the math to figure out how big a reduction in driving would be needed. Then, when transportation emissions were lower (and the city’s climate goals less aggressive) the city’s calculations showed we’d need a 62 percent decline in VMT. Our backsliding combined with a tougher goal means we’ll need to reduce driving even more to achieve the objective laid out in the Climate Emergency Declaration.
Dealing with climate change is a serious existential threat to humanity. Its good that the city is willing to acknowledge this, and that it has an important role to play in reducing greenhouse gases. This will be a challenging task, and it is not made easier by presenting reports that conceal fundamental failures to move forward, that hide key data and analysis that tell us where we really are, and which avoid accountability for failing to make meaningful progress toward our stated goals.