What City Observatory did this week
1. Where are African-American entrepreneurs? A new Census Bureau survey, undertaken in cooperation with the Kauffman Foundation provides a detailed demographic profile of the owners of the nation’s businesses. It reports that there are about 108,000 African-American owned businesses with paid employees (i.e., not counting self-employed entrepreneurs). We look at the distribution of African-American owned businesses in the fifty largest metropolitan areas, and find some surprising patterns.
2. Counting people and cars with Placemeter. We review our experiences using Placemeter—a web cam that when pointed at a road or sidewalk, counts the number of cars, bikes and pedestrians. Its an inexpensive and flexible technology that puts traffic counting within easy reach of businesses, individuals and neighborhood groups. This kind of “little data” can help democratize the planning process.
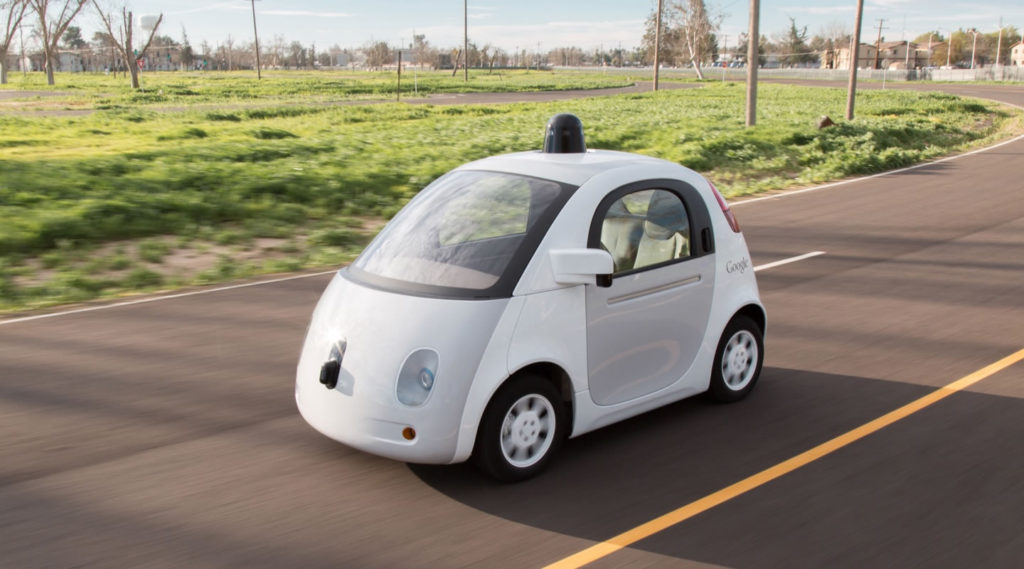
3. How much will autonomous vehicles cost? Its easy to be captivated by the fast pace of technological developments in autonomous vehicles. But the big question that economists—and urbanists—should be focusing on is: how much will these vehicles cost? We assemble some of the studies that have been made so far. They show that initially fleets of autonomous vehicles might cost about a dollar mile to operate. But, as the technology matures and the business scales up, costs are likely to fall. Many estimates fall in the range of 30 to 40 cents per mile—well below the cost of today’s conventional, privately owned cars.
4. The price of autonomous cars: Why it matters. Part 2 of our examination of the likely cost of autonomous vehicles examines the potential impacts of fleets of inexpensive AVs on the nation’s cities. At 30 to 40 cents per mile, AVs would be highly competitive not just with cars, but many transit trips as well. The key limiting factors will continue to be the highly peaked demand for urban transportation and the limited capacity of city streets. A la carte per mile pricing could make travelers more willing to consider alternate modes on a trip-by-trip basis, and may reduce car ownership. Fleets of autonomous vehicles may also disrupt the business models—and fiscal stability—of road-building and transit operating agencies.
This week’s must reads
1. President Obama on zoning: OK urban policy wonks, try to get accustomed, however briefly to the glare of the national media spotlight. On Monday, President Obama proclaimed himself a YIMBY (Yes in my backyard) as his administration weighed in on how local zoning decisions affect housing affordability. The administration released a “toolkit” of policy ideas that will be very familiar to City Observatory readers, calling for fewer limitations on building more densely, as a way of lessening housing costs. Importantly, the toolkit calls for communities to consider eliminating minimum parking requirements. To paraphrase Vice President Biden, this is a big deal.

2. The high price of affordable housing. One component of the solution to housing affordability is building more subsidized housing. But in practice the practical impact of subsidized units is limited due to very high construction costs. In Portland, alt-weekly Willamette Week reports that the city is contracting with non-profits to rehab existing housing units at a cost more than double the per square foot cost of new construction. Private builders say the city fails to put much weight on cost-effectiveness and that it chooses “cool projects with lots of expensive bells and whistles.” The article estimates that if the city could reduce its costs of construction by even 10 percent, it could have built an additional 1,400 units of affordable housing in the past decade.
3. The mythology of HOT lanes. The most widespread practical application of road-pricing is the growing implementation of high-occupancy toll lanes. At Streetsblog, Kevin Posey asks some hard questions as to whether HOT lanes are living up to the high policy expectations that have been set. He appraises the claims that HOT lanes reduce congestion in general purposes lanes, whether they overtax the capacity of high occupancy lanes, and whether they encourage (or discourage) transit and carpooling.
New knowledge
1. The impact of carbon taxes. Since 2008, British Columbia has had a real, live carbon tax. The tax has been gradually raised and now works out to about $30 per ton (rule of thumb: when it comes to carbon taxes, a dollar a ton works out to about 1 cent per gallon–when burned a gallon of gas produces about 20 pounds of carbon dioxide). Werner Antweiler and Sumeet Gulati of the University of British Columbia explore how the carbon tax has influenced driving and vehicle purchases in the province. They find that the carbon tax has accounted for about half of the 15 percent decline in per capita gasoline consumption in BC since 2008, and is the product of both somewhat more efficient vehicles and less driving.
2. Oil prices and housing markets. A new working paper from the Federal Housing Finance Administration looks at how oil prices affect the pattern of home prices within metropolitan areas. Urban economists have long documented the presence of a “rent gradient”: home and land prices tend to decline as distance to the central business district increases. Using zip code level data on home prices, William Larson and Weihua Zhao show that as oil prices increase—increasing the cost of transportation—the rent gradient gets steeper (prices for homes closer to the center appreciate relative to more peripheral homes.
3. Central neighborhood change. Nathanial Baum-Snow and Daniel Hartley undertake an elaborate statistical decomposition of the factors driving population change in urban centers in a new working paper from the Federal Reserve Bank of Chicago. Looking at very small downtown core areas (a 2 kilometer/1.6 mile radius around the central business district), they look at who’s moving in and who’s moving out. While population in these centers declined in the aggregate from 1980 to 2000, they rebounded sharply from 2000 to 2010, driven primarily by the in-migration of white, college-educated residents. Less educated minorities moved out of these neighborhoods throughout the entire 1980-2010 period.
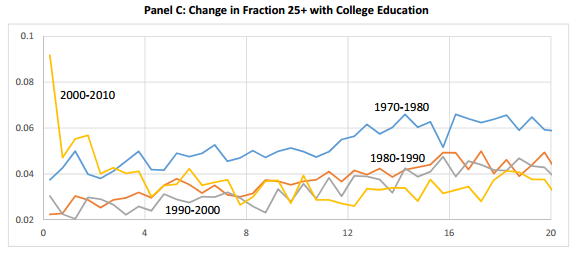
Chart shows change in fraction of adults with a college degree, by distance (kilometers) from the center of the central business district, by decade.
