What City Observatory did this week
1. The long journey toward greater equity in transportation. The observance of Dr. Martin Luther King’s birthday got us thinking about how far we’ve come–and how far we have yet to go–having a truly equitable society. We reviewed two recent studies that address lingering racial disparities in transportation. The first sheds some evidence on “driving while black”: given their higher probability of being pulled over for traffic infractions, blacks seem to be quite cautious drivers, with average speeds 8 percent slower than other drivers. A second study shows that there are racial disparities in ride-hailing services; passengers with black-sounding names were more likely to have rides cancelled.
2. Beer and crowd-sourced data. The number of breweries in the US has nearly tripled in the past decade. We’ve used a variety of data sources, including crowd-sourced directories of microbreweries to plot the density of microbreweries in cities across the country. To this, we’ve added Treasury Department data on the total number of breweries per capita in each state. Some clear regional patterns emerge, with the most breweries in the Northeast and Pacific Northwest and the fewest in the South.
3. Has Louisville figured out how to eliminate traffic congestion? Louisville has just started charging tolls to vehicles using its new multi-billion dollar bridges over the Ohio River. But the tolls only apply to three of the five bridges–which creates incentives for drivers to use the non-tolled routes. While we don’t have actual data on traffic patterns, we were able to take a quick look at area traffic cameras. They show that the 10-travel lanes of the new I-65 bridge were nearly empty at rush hour on a recent Tuesday afternoon. Meanwhile, an older, slower, narrower bridge–without tolls–had substantial traffic.
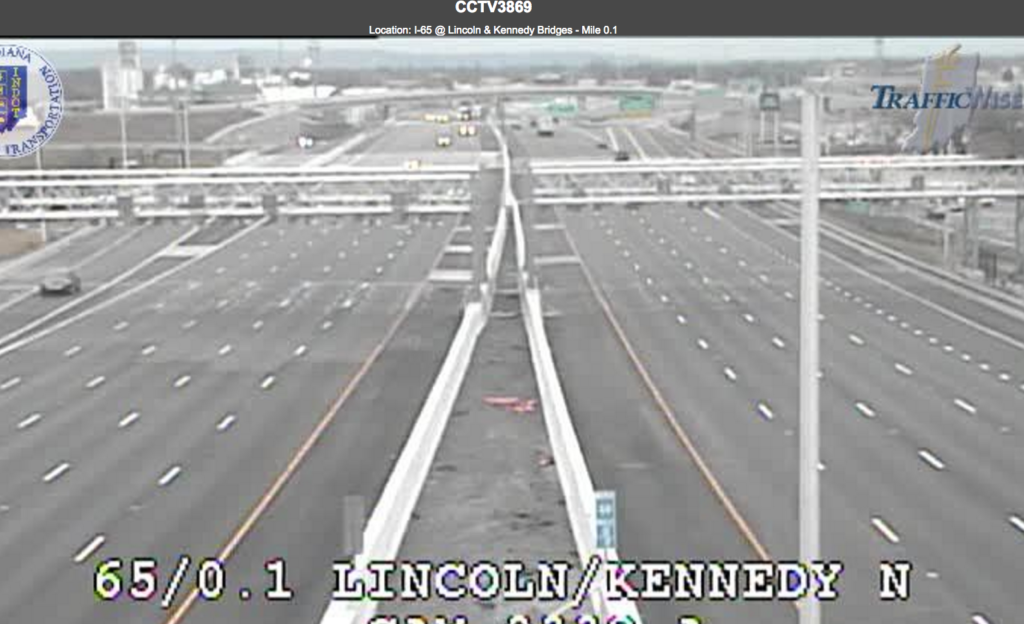
4. An experiment in transportation economics. It turns out that Louisville’s decision to toll some bridges and not toll others creates a kind of natural experiment that will provide some useful data on how much value travelers attach to the time savings associated with highway improvement projects. The economic justification for these investments is that the value of travel time savings exceeds the costs of building new capacity. If users aren’t willing to pay a toll to get these time savings, its a signal that there may be no good economic reason to expand the roads.
Must read
1. What have we learned about the causes of gentrification? Two economists for the Philadelphia Federal Reserve have written a review of recent literature on neighborhood change, published in the latest edition of Cityscape. Jacklyn Hwang and Jeremy Lin explore the causes of gentrification, and offer a comprehensive tour of recent scholarship on the subject. They conclude that the answer to the question posed by their article remains elusive. Socioeconomic upgrading appears correlated with central city job growth, improved urban amenities and declining crime, but the patterns of causality are complicated and unclear.
2. How housing choices impair adult friendships. Writing at Vox.com, David Roberts considers the connections between our low density land use patterns and the nature of our adult relationships. Our lower density communities and auto-oriented lifestyles work against three of the critical ingredients that sociologist believe are key to forming friendships: proximity, repeated and unplanned interactions, and an environment that permits us to let our guard down. The antidote? Wallkable communities and lively public spaces that facilitate spontaneous interactions.
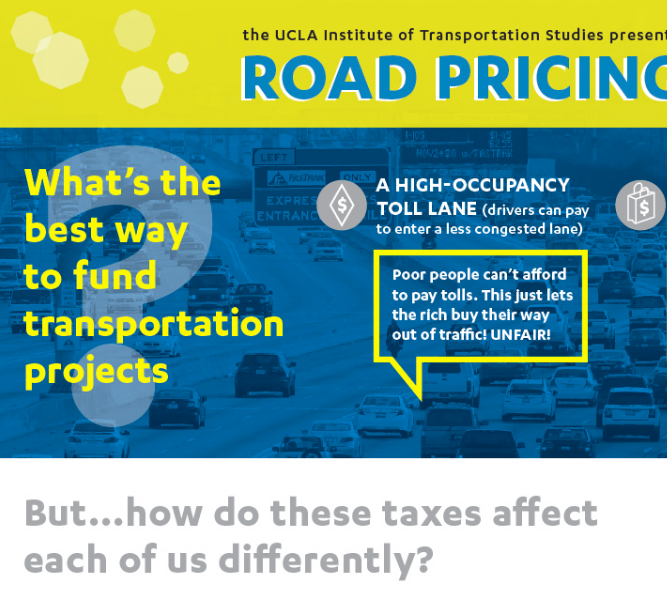
3. Infographic on road-pricing equity. Economists love road pricing, but often seem to be the the only ones. Nobody likes to pay for something they perceive to be free, but frequently the most powerful argument is that road pricing will hurt the poor, because tolls represent a larger economic burden for low income households. A new infographic from the UCLA Institute for Transportation Studies tackles that question head on, comparing who pays and how much for a road widening depending on whether its paid for with road pricing or a sales tax increase. The poor actually pay more–and benefit less–when new roads are paid for from sales taxes. (And the USC analysis leaves out the fact that the poor are much less likely to own cars in the first place). A useful tool for talking about the equity implications of road pricing.
New Research
1. The Changing Shape of Metropolitan America. Luke Juday of the University of Virginia has updated is invaluable dashboard of radius-based measures of metropolitan socio-economic characteristics to include the latest 2015 American Community Survey data. Juday’s work summarizes census data on educational attainment, income, age, and race and ethnicity by distance from the center of the metropolitan area for each of the 50 largest US metro areas. The dashboard shows the difference between 1990 and 2015 values for each of these variables. Here’s the composite analysis of the 50 largest metros of educational attainment by distance from the central business district (you can also see similar charts for individual metropolitan areas, as well).
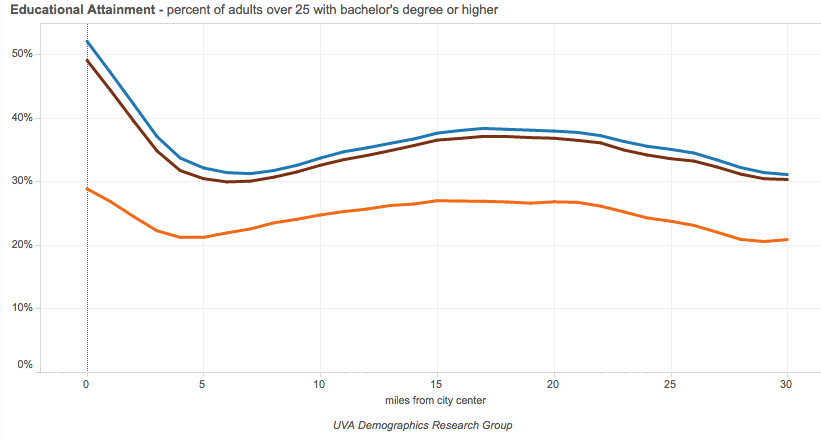
This chart shows the growing concentration of well-educated adults within 3 miles of the center of US metro areas. Adult educational attainment is higher now than in 1990, but has grown most rapidly in these close-in neighborhoods. Not surprisingly, there aren’t large differences between the 2012 and 2015 data; the two series are based on overlapping samples from the American Community Survey. This is an terrific resource for neatly summarizing the geography of change within metro areas.
2. The 2015 American Housing Survey. The Census Bureau and Department of Housing and Urban Development released the results of the 2015 American Housing Survey which provides detailed data on the housing stock and neighborhood characteristics of 25 of the nation’s largest metropolitan areas. The Census website offers a table creator that lets you generate your own cross tabulations of data for particular metropolitan areas. Variables include everything from income, rents, reasons for moving, to the size and amenities of housing units, to data on litter, abandoned properties and whether nearby houses have bars on their windows.
