You know the feeling: you’re thirsty, you’re primed for a cool, refreshing beverage, and the anticipation has your taste buds tingling. But you pop the cap on the bottle only to find that the beer has turned skunky. It’s very disappointing. Well, we had a small taste of funky beer a couple of week back at City Observatory. Today, we want to wipe that taste out of our mouths, and present some other data that helps triangulate the geography of US microbreweries. First, a look back.

Many of you read our post ranking the density of microbreweries in the nation’s 50 largest metropolitan areas. To construct this index, we relied on a GIS tool constructed by BreweryMap.com (which allows us to do radius searches for microbreweries). The BreweryMap.com tool is, in turn, built on top of a database constructed by breweryDB. And while it appears to be one of the most comprehensive sources of detailed information on microbreweries, it is far from perfect. A number of CityObservatory readers, looking at our rankings, and then clicking through to their local cities, found that listings in many cases included breweries that were closed, mis-located and in a few rare cases non-existent (maybe not yet open).
The underlying data for BreweryMap comes from crowd-sourced data. BreweryDB makes it clear on their website:
The team at BreweryMap.com is aware that the database is less than perfect. They invite users to send corrections to breweryDB:
BreweryMap uses BreweryDB to provide information about the beers and breweries. If you find a brewery that is missing or incorrect, please click the edit button on the brewery info window to go to brewerydb.com and add or correct info. The world will appreciate your contribution and you’ll get a nice warm fuzzy feeling in your heart!
State level brewery data
While there’s something deeply democratic about crowd-sourced data, it inevitably comes with a degree of noise and a margin of error that is larger than we find in more professionally curated and quality-checked data. Its always a good idea to cross-check crowd-sourced data against other independent information sources (which is why we dug up some market survey data on microbrewed beer consumption by media market). Another way to triangulate our findings is by looking at data from the Treasury Department’s Alcohol and Tobacco Trade and Taxation Bureau. Breweries have to be licensed by the federal government–they pay a tax on every barrel brewed–and this produces a reliable and comprehensive count of breweries. Unfortunately, the published aggregations of this data re available from ATTTB only at the state level. While these data may be more consistent than crowd-sourced counts, that doesn’t mean they’re perfect: it’s likely that some breweries that closed during a year are still in the database, and some licensees may be counted even though they haven’t yet brewed beer; others may be temporarily inactive.
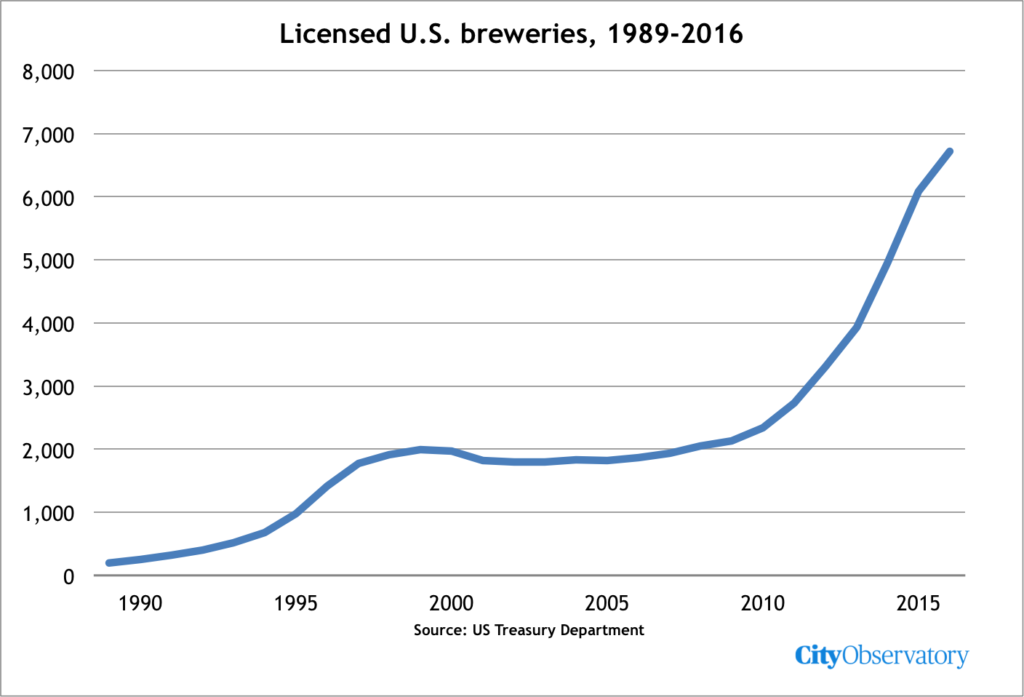
The federal data show a striking increase in the number of breweries in the US, especially in the past eight years or so. While the microbrewery revolution traces its roots to the 1980s, there was a period of fast growth in the late 1990s (as the total number of breweries rose from just a few hundred to nearly 2,000). That number plateaued for most of the decade of the 2000s, but since 2009, has taken off again. The number of breweries in the US has tripled, to nearly 7,000.
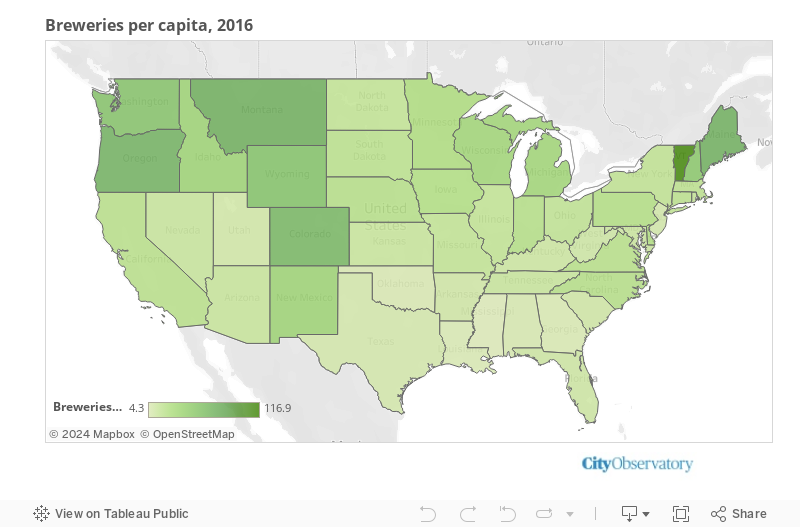
This growth has been widespread. Today, every state has at least a dozen breweries. Overall, California has the most breweries (927) and the District of Columbia, Mississippi, and North Dakota have the fewest (13, 14, and 15 respectively). If we normalize these counts by population, we can identify the states where breweries are most common. The following chart uses the state level data prepared by the ATTTB to compute the number of microbreweries per capita in the US. Vermont leads the list, with more than 116 breweries per million population, followed by Maine, Montana, and Oregon, which each have more than 70 breweries per million population. The typical state has about 20 breweries per million population.
When we map these data, some clear regional patterns emerge. In the following map, darker colors correspond to higher number of breweries per capita, and lighter colors correspond to fewer breweries per capita. Breweries are most common in the Pacific Northwest and in the Northeast, and are least likely to be found in the middle South. (You can scroll over each state to see the number of breweries and our count of breweries per million population.)
Its great, of course, to see the flourishing and spread of local craft brewing. At City Observatory, we really enjoy tracking these numbers (despite their limitations). But like you, we suspect there’s one thing we enjoy more, and it comes in a pint glass. Prost!
