What City Observatory did this week
1. City Report: America’s Most Diverse, Mixed Income Neighborhoods. Our new City Report digs deep into the patterns of racial/ethnic and income segregation in US metro areas. We’ve used an array of census data to identify the places with the highest levels of integration along two dimensions (race/ethnicity and income). The report shows which metro areas have the most diverse neighborhoods, where those neighborhoods are located, and which metro areas have the greatest degree of mixing, given their demographic composition. We’ve also got detailed maps that let you drill down to the neighborhood level to see which neighborhoods meet our criteria (and which don’t).
2. Profiles of diverse, mixed income neighborhoods. As a follow on to our deeply statistical report identifying and counting diverse, mixed income neighborhoods, we’ve assembled a series of profiles of typical highly diverse neighborhoods in different metropolitan areas. They’re all different–each diverse in its own way–and they illustrate what lived diversity looks like on the ground. You’ll want to have a look at our profiles of Hillcrest, Queens, St. Mary’s Park in San Francisco, and Corktown in Detroit, among others.
Must read
1. Why don’t roads pay rent? We’ve long posited that the simplest summary of US urban economics is that “housing is too expensive and driving is too cheap.” David Levinson, who blogs at The Transportist offers a provocative look at the implicit rental cost of urban streets and roads. Whether parked or moving, cars occupy a huge amount of urban real estate, but don’t pay rent for the privilege. Levinson works out how much urban space they use, particularly when on the move: he calculates, for example, the volume of space a car occupies as it moves, including both its space and leading and following distances:
[On a freeway] Each moment a car is in use, it is using 200 m², on which it should pay rent. So for an hour a day, this is 720,000 m² s or 72 ha s. (The meter-squared by second (or hectare second) is a new unit of measurement (a time-volume) that needs a catchier name).
The fact that we don’t charge rent to cars for the space they occupy is a tremendous public subsidy to car ownership and driving. Because we devote this space to cars (and give it away for free) that means the land (and value associated with it) aren’t available for other uses. We need to pay much more attention to this opportunity cost associated with our road system. If we charged road users rent for the space they occupied, they’d undoubtedly shift travel patterns in ways that would make cities both more efficient and more equitable.
2. New York’s latest transportation report card. Congestion is increasing in the Big Apple, with the result that street speeds are dropping. Streetsblog has a great summary of key findings from the latest NYC Mobility Report. One that caught our eye: street speeds in Manhattan south of 60th Avenue (measured by taxi GPS data) have fallen more than 20 percent, from 9.1 miles per hour in 2010 to 7.1 miles per hour last year.
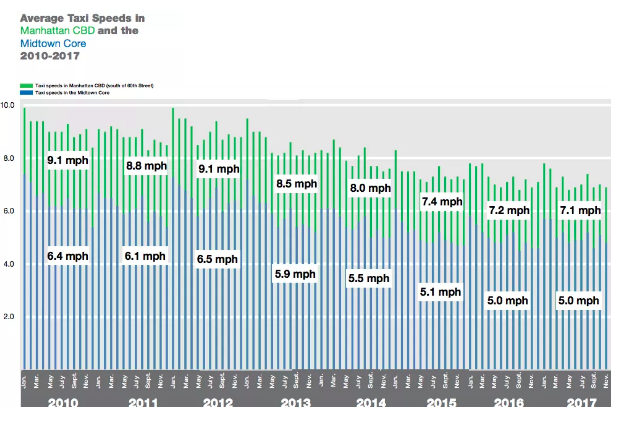 Slower traffic means longer travel times for all street users, but particularly penalizes bus traffic; not surprisingly bus ridership continues to decline. Congestion has been amplified by the growth of ride-hailed traffic, which has grown more than 60 percent in the last year. As Streetsblog argues, the data make a strong argument for immediately adopting congestion pricing, and moving forward with plans to improve transit.
3. Is sprawl making walkable places less affordable? Writing at CNU’s blog Public Square, Robert Steuteville argues that our decision to shift from the traditional gridded pattern of urban development to the hierarchical and winding street patterns that characterize most suburban development has, in effect, made it impossible to grow more dense. Gridded streets more easily accomodate density from the get-go, and also make it easier to redevelop over time. Sprawling suburban development patterns are inherently wired for automobile trips and relatively high speeds; a gridded neighborhood can more effortlessly shift to becoming a pedestrian-oriented environment. The difficulty of re-working the suburban pattern means that more of the growing demand for walkable spaces is shifted to city centers, driving up rents.
New Ideas
Does congestion harm economic growth? It’s a widely touted mantra among highway advocates: if we don’t build more roads, congestion will cause our economy to grind to a halt. While its widely asserted, there’s precious little evidence. The opposite case can be made: congestion is the sign of a healthy economy. A recent paper published in the journal Transportation, “Revisiting the relationship between traffic congestion and the economy: A longitudinal examination of U.S. metropolitan areas,” comes down squarely on the side saying that congestion doesn’t harm economic growth. Authored by Wesley Marshall and Eric Dumbaugh look at data on congestion, productivity and job growth for 89 US metro areas. They conclude:
. . . the results suggest a positive association between traffic congestion and per capita GDP as well as between traffic congestion and job growth at the MSA level. There was a statistically insignificant effect on per capita income.
A positive association means that productivity (GDP per capita) and job growth both were higher in metro areas with higher levels of congestion. That’s the reverse of what one would expect from what we’re told by highway boosters, and implies that congestion not only does no economic harm, but actually is indicative of stronger growth.
In the news
Our analysis of the comparative population growth rates of the nation’s cities and suburbs (and what these numbers mean) was highlighted by Real Clear Markets.
