The biggest single factor determining the success of a city’s economy is how well-educated is its population. As the global economy has shifted to knowledge-based industries, the jobs with the best pay have increasingly gone to those with the highest levels of education and skill.
For a long time, we’ve been talking about the talent dividend–how much an area’s college attainment rate is correlated with its per capita income. Since its such an important touchstone for policy, we think its worth taking a close look at what the data say about the strength and importance of this relationship.
Today, we’ve pulled together the latest metro area data–for 2014–from the Census Bureau (on educational attainment) and from the Bureau of Economic Analysis (on per capita income). The following chart plots the relationship between per capita personal income (on the vertical axis) and the fraction of the adult population who have completed at least a four-year college degree (on the horizontal axis). Each dot on the chart represents one of the nation’s metropolitan areas with at least 1 million population (53 of them, according to the 2014 Census tabulations). You can mouse-over a dot to see the corresponding metropolitan area and its educational attainment rate and per capita income.
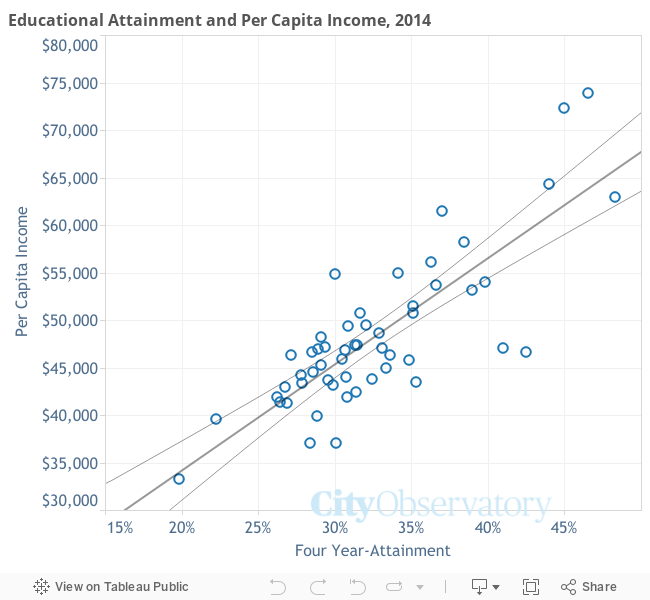
As you’ll immediately notice, there’s a strong, positive correlation between educational attainment and per capita income. The metro areas with the highest levels of education have the highest levels of per capita personal income. Cities like San Francisco, Boston and Washington have the highest levels of per capita income and the best-educated populations. Cities like Riverside and Las Vegas have low levels of educational attainment and correspondingly lower levels of per capita income. The coefficient of deterimination of the two variables–a statistical measure of the strength of the relationship–is .67, which suggests we can explain two-thirds of the variation in per capita personal income among metropolitan areas, simply by knowing what fraction of their adult population has a four-year degree.
This chart tells you the most important thing you need to know about urban economic development in the 21st century: if you want a successful economy, you have to have a talented population. Cities with low levels of educational attainment will find it difficult to enjoy higher incomes; cities with higher levels of educational attainment can expect greater prosperity. As Ed Glaeser succinctly puts it: “At the local level fundamentally the most important economic development strategy is to attract and train smart people.” And critically, because smart people are the most mobile, building the kind of city that people want to live in is a key for anchoring talent in place. And, importantly, the economic research shows that the benefits of higher educational attainment don’t just accrue to those with a better education: people with modest education levels have higher incomes and lower unemployment rates if they live in metro areas with higher average levels of education.
The data presented here imply that a 1 percentage point increase in the four-year college attainment rate is associated with about a $1,100 per year increase in average incomes in a metropolitan area. This is what we call the Talent Dividend. This cross-sectional relationship suggests that if a metropolitan area were to improve its educational attainment by one percentage point on a sustained basis, that it would see a significant increase in its income.
Over time, the strength of this relationship, and the size of the talent dividend effect has been increasing. When we computed the relationship using 2010 data, the correlation coefficient was .60 and the size of the talent dividend was $860 (in current dollars). These data suggest that educational attainment has become even more important in determining economic success than just a few years ago.
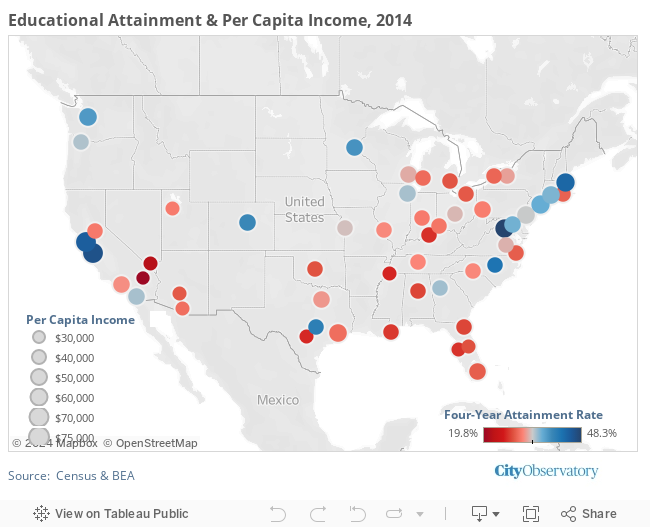
We’ve also mapped the metro level data on the talent dividend relationship. On this map, the color of each circle corresponds to a metropolitan area’s level of educational attainment (red circles have lower than average educational attainment among these metros, blue circles higher educational attainment). The size of circles is proportional to an area’s per capita income; larger circles indicate higher per capita income. (You can mouse over any metro area to see the educational attainment and per capita income figures for that metro area).
Education is a stronger predictor of economic success today than ever before. That’s true for individuals, for private businesses, for communities, and for metropolitan economies. The better educated you are, the more likely you are to be prosperous in a knowledge-based economy. Not only do well-paid and fast growing technology jobs go disproportionately to the better educated, but better educated workers tend to be more adaptable and more innovative, which better prepares them to cope with a changing economy. The policy lessons for city leaders are clear: a successful economy depends on doing a great job of educating your population, starting with your children, and also building a community that smart people will choose to live in.
