What City Observatory did this week
America’s least and most segregated metro areas: Evidence from Census 2020. Racial segregation remains a chronic problem in US metropolitan areas. Data from Census 2020 provides a hyper-detailed, decadal check-in on the state of segregation. The good news is that Black-white segregation continues, slowly, to decline in virtually all US metro areas. The bad news is that it is still at relatively high levels.
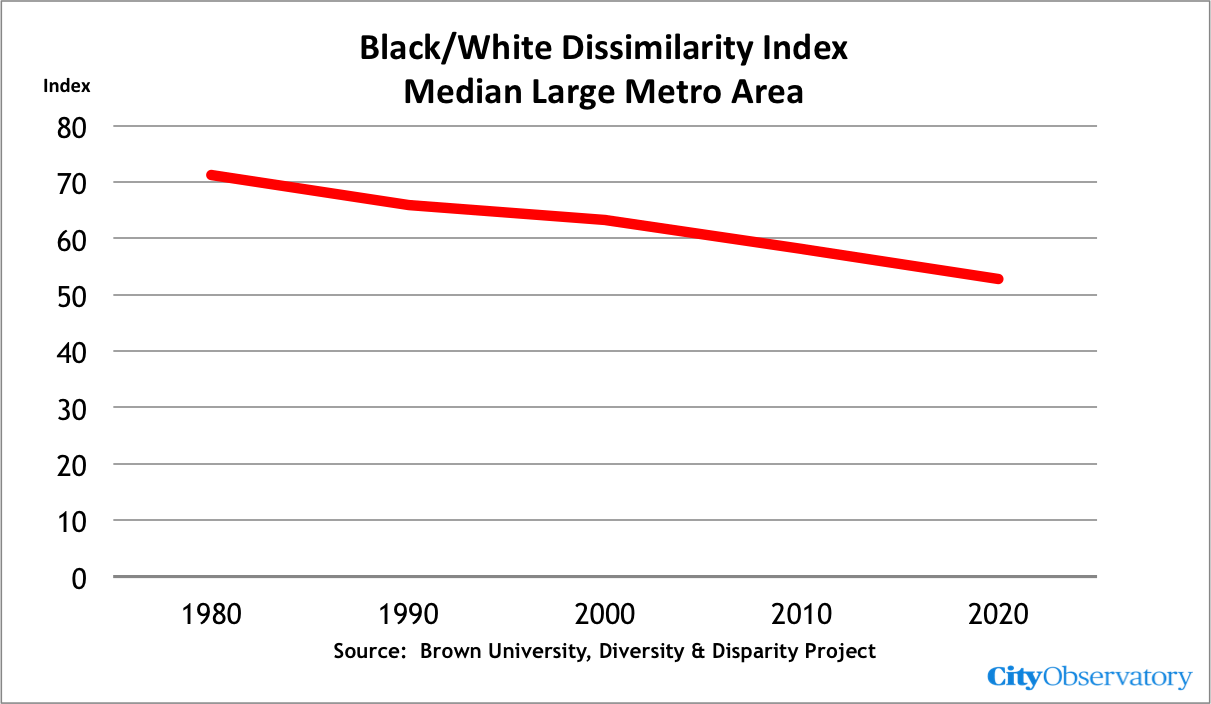
We use data from the Brown University Diversity and Disparity project to rank the 53 most populous US metro areas by their Black-White dissimilarity index. The most segregated large metros tend to be in the Northeast and Midwest (Milwaukee, Detroit, New York and Chicago) Among the nation’s least segregated metro areas: Tucson, Salt Lake and Portland. Some cities have made more progress than others: Portland has gone from more segregated than the typical metro area in 1970, to one of the three least segregated today.
Must read
1. An induced demand calculator for every state and metropolitan area. Over the past decade, a series of research studies have firmly established the science behind “the fundamental law of road congestion.” Widening un-priced roads in urban areas does nothing to relieve congestion because added capacity or increased throughput generates additional peak hour trips in exact proportion to increased capacity. Following on pioneering work byJamey Volker, Amy Lee and Susan Handy at UC Davis, the Rocky Mountain Institute, working with a series of other organizations, has adapted the California induced demand calculator to metro areas and counties across the nation. Here’s a sample output for a 12 lane-mile freeway widening in Portland:
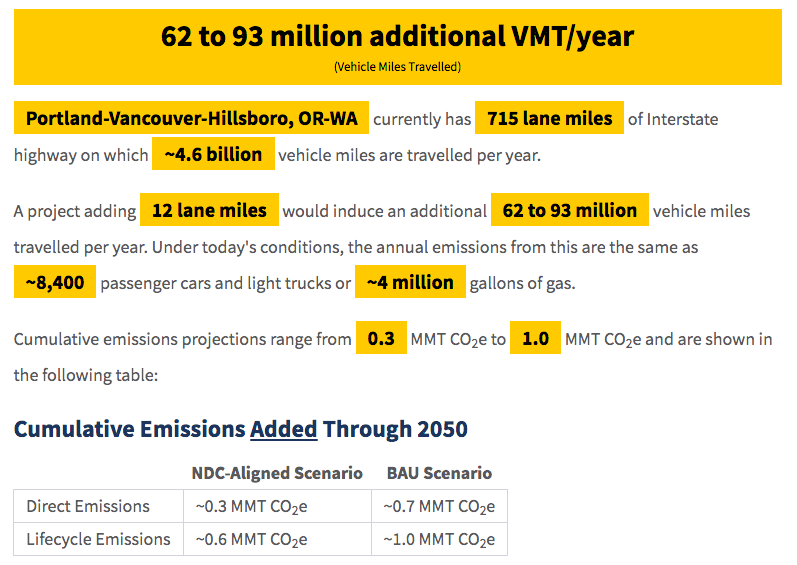
The calculator allows users to estimate the increase in vehicle miles traveled and added greenhouse gas emissions from highway expansion projects in any state. (Full disclosure: City Observatory participating in reviewing this calculator tool).
The state’s computer model claims that widening the Beltway in Bethesda will get rid of traffic jams on US 50 to Annapolis. And it says that feeding three more lanes of cars into the awful Beltway-270 merge at Wisconsin Avenue will reduce traffic there. This model lacks all credibility and is not a legitimate basis for public decision-making, When federal and county planners initially suggested widening the American Legion Bridge and I-270 without adding lanes at the Wisconsin Avenue merge, the Maryland Dept. of Transportation rejected the idea and insisted it would create a new bottleneck at the merge point, But then the political winds reversed, and the new bottleneck somehow vanished. How can anyone who drives on the Beltway believe this model?”
. . . a series of interlocking national, state and local rules will give a group of landowners in an area the ability to essentially override zoning without sign-off from a single elected official.
New Knowledge
Crime rates went down 20 percent during the pandemic. The sensational news of the past year or so has been a spike in homicide rates during the pandemic. The FBI reports that the total number of murders in the US grew an unprecedented 30 percent between 2019 and 2020, to 22,000. That’s led many observers to conclude we’re in a new era of rising crime.
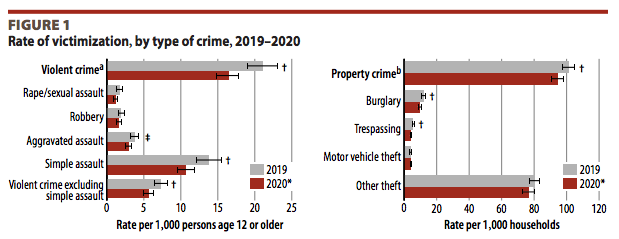
But it appears that the rise in homicides—though tragic and alarming—is not indicative of crime, or even violent crime in general. Data from the national survey of crime victimization, which has been collected on a consistent basis for for than three decades show that virtually every category of violent crime declined in 2020 compared to 2019.
- The violent victimization rate declined from 21.0 per 1,000 persons age 12 or older in 2019 to 16.4 per 1,000 in 2020.
- The number of violent crimes, excluding simple assault, fell from 2.0 million in 2019 to 1.6 million in 2020.
- The number of burglary and trespassing victimizations declined from 2019 (2.2 million) to 2020 (1.7 million).
- About 40% of violent victimizations and 33% of property victimizations were reported to police in 2020.
The victimization survey data are a particularly important measure of crime, because not all crimes are reported to police, and variations in reporting over time and across different jurisdictions makes crime report data somewhat noisy. It’s hard to know how to interpret this decline. With the pandemic, 2020 was an unusual year. Stay-at-home orders and caution prompted many of us to refrain from leaving our homes and participating in a wide variety of social activities. It may well be there was less crime because fewer people were out and about. There are good reasons to be concerned about the increase in homicides, but clearly we need a much more nuanced look at crime to understand what’s going on than headline alarms about a general surge in crime.
Rachel E. Morgan, Ph.D. and Alexandra Thompson, Criminal Victimization, 2020, National Center for Justice Statistics, NCJ Number 301775, October 2021
