What City Observatory did this week
What the Interstate Bridge Replacement Project doesn’t want you to know. The $7.5 Billion Interstate Bridge Replacement project is afraid of what you’ll find out when they release their Environmental Impact Statement. IBR officially determined that “leaking” the project EIS would result in “negative public reaction” to the project. Guess what: We have an advance copy of the draft EIS: You can now see what they don’t want you to see.
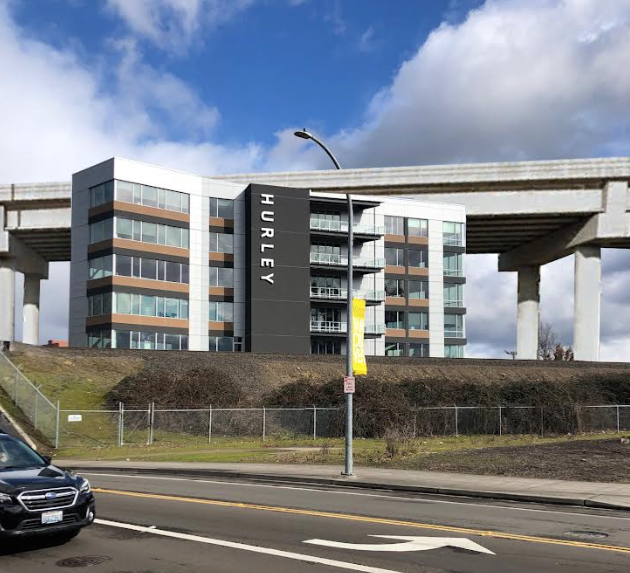
We have reveal some of the secrets hidden in the unreleased EIS. For starters, the IBR project plans to demolish one of the most recent additions to the Vancouver skyline, the six story Hurley Building.
There’s much more. And you can now see what IBR planners didn’t want you to know because community activists at the Just Crossing Alliance have used public record laws to get a copy of the draft supplemental EIS, and have posted it to the web. Take a look at what you’re not supposed to see.
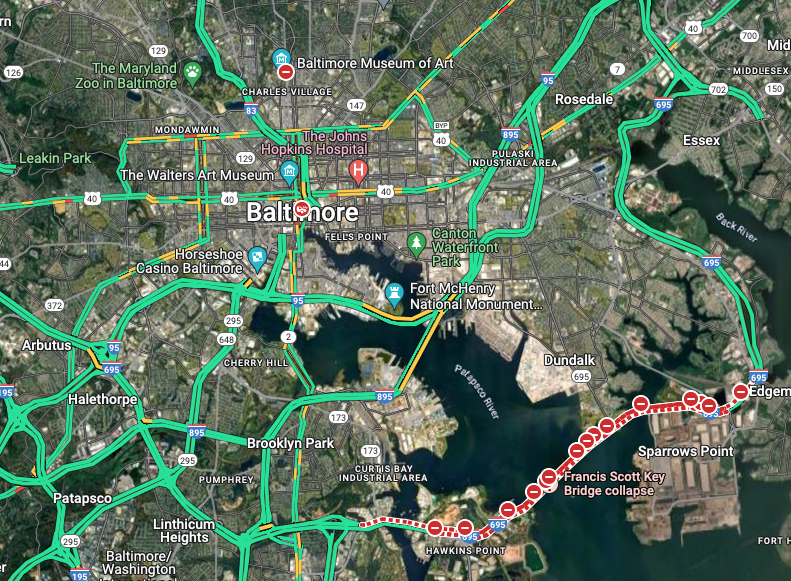
Carmaggedon does a no show, yet again (Baltimore edition). This week, tragedy struck in Baltimore when the containership Dali crashed into the Francis Scott Key Bridge killing as many as six people who were working on bridge maintenance at the time. Fortunately the crash didn’t happen at peak travel times, as the bridge carries about 35,000 vehicles per day. As usual, the media were quick to predict that the collapse would produce traffic chaos. But a quick look at Google Maps traffic data for Wednesday morning (a day after the bridge collapse) shows a few local slowdowns, but most Baltimore traffic exactly like a typical weekday.
This isn’t an anomaly. Time and again, when a bridge or freeway is closed for maintenance, construction, or because of some disaster, traffic patterns quickly adjust to the change in capacity. It’s a powerful illustration of traffic evaporation. Contrary to the beliefs of traffic engineers, travelers are not mindless automatons bound to fixed routes; people quickly and routinely adjust their travel habits to respond to changes in conditions, especially road capacity. This has an important implication for transportation planning in dense urban areas: adding or subtracting capacity may change travel volumes, but absent road pricing, does little or nothing to influence congestion.
Must Read
The Doom Loop that didn’t happen. American cities can offer up their own paraphrase of Mark Twain’s famous remark that reports of his death were greatly exaggerated. The “tdlr” of the doom loop theory is that work from home would depopulate office buildings, commercial tax payments would fall, cities would have to slash services, and cities would become hell-holes. The reality is different in important respects. Office occupancy and values are down, in most cities commercial property taxes are a very small portion of municipal budgets. More importantly, while office populations are down, city populations aren’t: populations are up in the downtowns of 25 of the 26 largest cities. Urban home values are up sharply: at least in part because people are demanding more space for work-at-home offices.
. . . the biggest problem that superstar cities face today is the same one that afflicted them before the pandemic: Too many people want to live in them. Housing prices have skyrocketed over the past four years. In New York, Boston, and Los Angeles, vacancy rates are at or near their lowest levels in decades. Even San Francisco, the paragon of post-pandemic urban decline, is doing remarkably well. Last year, its population grew more from net migration than any other city in California, and its crime rate fell.
Finally, proximity to a job isn’t the only, or necessarily the most important reason we live in cities. Instead, people value the convenience, choice, consumption amenities and opportunities for social interaction that cities provide–things that are all relatively more important if we’re spending less time in the office.
How SUV’s undermined climate progress. Kate Aronoff of The New Republic has an incisive analysis of how a loophole in the fuel efficiency regulations. When the EPA adopted new fuel efficiency regulations as part of its climate change strategy in 2012, it carved out a special provision that set less demanding standards for sport utility vehicles and light trucks. Unsurprisingly, automakers responded by producing ever more trucks and SUVs. And after a collapse in oil prices in 2014, consumers bought more and more of these less efficient vehicles. The result: we’re getting far lower reductions in greenhouse gas emissions than EPA promised when it adopted the efficiency rule. Aronoff reports:
The EPA had projected the rules it implemented that year would result in average targets that were 22 grams per mile lower than those that were actually in place in 2021. And it thereforeprojected its 2012 rules would reduce carbon dioxide emissions by 3.5 percent per year from 2012 through 2021. Instead, the agency found it reduced emissions by about 2 percent per year.
Federal and state greenhouse gas reduction strategies count on a steady decline in greenhouse gas emissions per mile driven, but the actual experience with mileage standards has been that they’ve provided only a little more than half the emissions reductions that were promised. Oregon’s strategy, for example, assumed greenhouse gas emissions, measured in grams per mile, would fall by more than 4 percent per year; the reality is that we’ve only made improvements at half that rate.
The case for decongestion pricing in <your state’s name here>. Kevin DeGood has a guest commentary at Streetsblog Massachusetts calling for the Bay State to adopt decongestion pricing. DeGood starts with the premise that the workhorse of road finance–the gas tax–is on the way out, and the commonwealth will need a new way to pay for roads. While his arguments are specific to Massachusetts, they apply with equal force to most every state. As DeGood points out, a gas tax or mileage fee does almost nothing to reflect back to road users the single greatest cost of the road system: building enough capacity to accommodate everyone who would like to travel at peak hours. He explains:
The only way to ensure the highway system runs smoothly and efficiently is by charging drivers directly for their use of the network. This type of charge is typically called congestion pricing, though it would be more accurate to call it decongestion pricing. An urban highway lane is a valuable—and very limited—commodity. Unlike a simple fuel tax, the technology underpinning decongestion pricing allows for sophisticated management of the transportation system. For instance, highway pricing can vary depending on the level of congestion, size and weight of the vehicle, time of day, location, and direction of travel—among other characteristics.
The longevity of the gas tax suggests that we get a chance to rethink how we pay for transportation roughly once every century or so: If we’re going to make a major change, it is important we get it right. Your state should be looking seriously at decongestion pricing.
The promise and the perfidy of “Reconnecting Communities. Ben Crowther of America Walks has a neat summary of USDOT’s “Reconnecting Communities” grant awards. While the money has seeded funding for some potentially promising ideas to remove the freeways that devastated urban neighborhoods, too much of the money has been captured by state highway departments for slightly warmed-over versions of their long-runing efforts to widen highways everywhere. To its credit, USDOT has made grants to groups like those in Syracuse, New York which are taking on the hard work of actually undoing the damage done by decades of urban highway expansion. A fifth of the money has gone to projects Crowther describes as “problematic” where highway departments are getting more money to just widen highways, with the biggest award going to Portland’s problematic I-5 Rose Quarter Freeway widening, shown below..
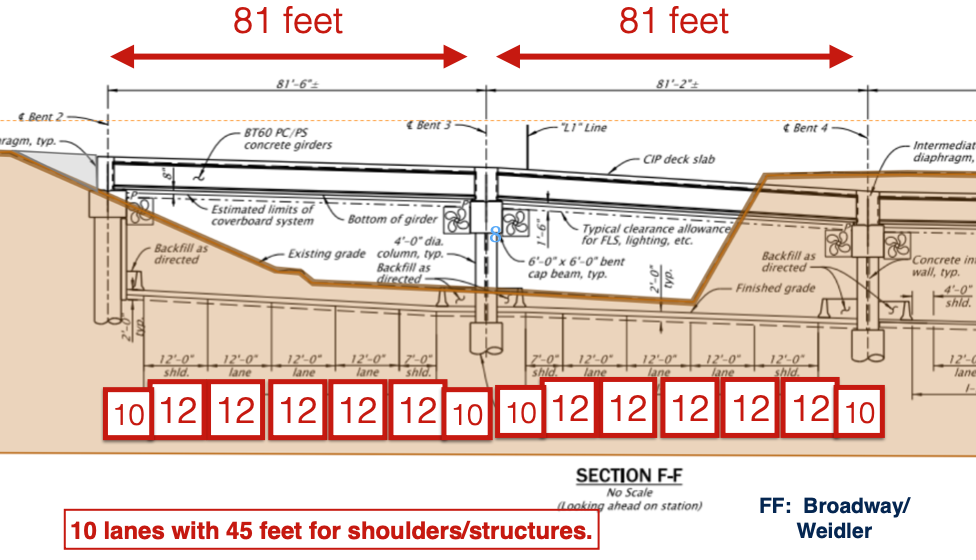
The Oregon Department of Transportation claims that this “reconnecting communities project simply adds one auxiliary lane in each direction on I-5. But their hitherto secret plans show they’re building a right of way to accomodate a ten lane freeway with suburban style shoulders. This plan divides more than it reconnects.
New Knowledge
A dramatic surge in road-building. In the past four years, the amount we spend building new roads and highways has increased by almost 50 percent, from about $100 billion annually just before the pandemic, to nearly $150 billion annually today. Great news if you’re an asphalt or concrete contractor, and welcome news for AASHTO, but definitely headed in the wrong direction if you expect to reduce car dependence and vehicle miles traveled (which is essential to achieving greenhouse gas reductions).
U.S. Census Bureau, Total Construction Spending: Highway and Street in the United States [TLHWYCONS], retrieved from FRED, Federal Reserve Bank of St. Louis; https://fred.stlouisfed.org/series/TLHWYCONS, March 22, 2024.
