Must Read
How CalTrans cheated on its environmental reporting. Some months back, former Deputy Director of CalTrans,Jeanie Ward-Waller blew the whistle on the agency’s effort to evade environmental laws and illegally use maintenance funds to widen I-80 between Sacramento and Davis. Now the National Resources Defense Council has laid out a strong case that the agency’s environmental review is plagued with errors and misrepresentations.
The CalTrans Environmental Impact Report for the I-80 project claims, implausibly, that the widening will result in less travel than leaving the freeway at its current 6-lane width. As NRDC points out, that’s because the CalTrans model assumes that housing, jobs, and travel patterns will be essentially the same in the “Build” and “No-Build” scenarios. The NRDC analysis shows that CalTrans assumed a “build” level of traffic between Sacramento and Davis, regardless of whether the freeway was widened or not–and its traffic models dutifully illustrated roads clogged to capacity, and predicted commuters would take circuitous detours (thus increasing vehicle miles traveld and pollution.
Essentially, CalTrans argued there’d be “induced” demand whether the freeway was built or not. But that’s the opposite of what we know about induced travel: the additional trips (and more sprawling development) occur if the freeway is built, but not if it isn’t. As Carter Rubin of NRDC writes,
Caltrans did not fully disclose and adequately analyze the Project’s impacts. Because the DEIR relied on flawed modeling, Caltrans arrives at erroneous conclusions about traffic impacts, greenhouse gas emissions, air quality, and energy impacts. Next, when it comes to estimating how much additional driving the project will cause, Caltrans still underestimates the impact. The DEIR also fails to adequately measure the additional car-centric sprawl growth that the project will cause.
Exaggerating the volume of traffic in the “No-Build” scenario is a favored DOT tactic, it makes the traffic problem look worse, and falsely creates the impression that traffic and pollution will be less if you build a project. As a growing body of scientific evidence shows, that’s exactly backwards: more highway capacity generates more travel, more congestion and more pollution.
The “clean cars” shortfall. Across the world, climate strategies are pinning their hopes on a “technical fix” for automobile greenhouse gas emissions. Legislating cleaner cars and cleaner fuels is supposed to reduce greenouse gases from driving. A new report from the European Union’s Courtof Auditors, reported by the Brussels Times, shows that the real world reductions in carbon emissions from “cleaner” cars are far less than claimed based on lab results. The report concludes that EU CO2 emissions reduction targets for new passenger cars are unlikely to be acchieved because CO2 emissions are measured in manufacturer’s laboratory tests do not reflect reality. Real-world emissions from conventional cars have not fallen.
Perhaps the most alarming finding is the dirtier performance of hybrid vehicles. In theory, plug-in hybrids ought to rely mostly on clean(er) charging, but in practice they get much more energy from the internal combustion portion of the hybrid-powertrain. The report concludes:
The combustion engine in hybrid cars is used more frequently than expected, in particular for company-owned plug-in hybrids, the auditors explained. . . . “We don’t consider hybrid cars to be low-emission cars and the designation should end from 2025,” the audit team said. “In reality, they don’t pollute less than combustion engine cars and we foresee a phase-out of hybrid cars.”
Several states are counting heavily on hybrid cars to reduce emissions–this report suggests hybrids may do much less that hoped for in reducing greenhouse gas emissions.
New Knowledge
The high cost of crashes. Road crashes cost Americans more than $340 billion in 2019, according to a new report from the National Highway Traffic Safety Administration. That works out to a total more more than $1,000 per person per year, and represents about one and a half percent of the nation’s gross domestic product.
The costs get spread to scoiety in many ways–through insurance premiums, taxes, and the costs borne directly by injured people. Traffic crashes cost taxpayers $30 billion in 2019, roughly 9% of all motor vehicle crash costs. This is the equivalent of $230 in added taxes per household in the United States.
The report notes that their were more than 14 million motor vehicle crashes in 2019, which injured more than 4.5 million people, and killed 36,500.
A key risk factor is the amount of driving Americans do each year. The more we drive, the more crashes, injuries and deaths. As NHTSA notes,
. . . although the 2019 fatality rate per VMT is unchanged from 2010 the incidence of fatalities and injuries has increased, reflecting added driving exposure . .
Crashes are particularly devastating for pedestrians. Pedestrians are far more likely to be seriously injured or killed in traffic crashes that automobile occupants. Overall, pedestrians are about seven times more likely to be killed if involved in an crash.
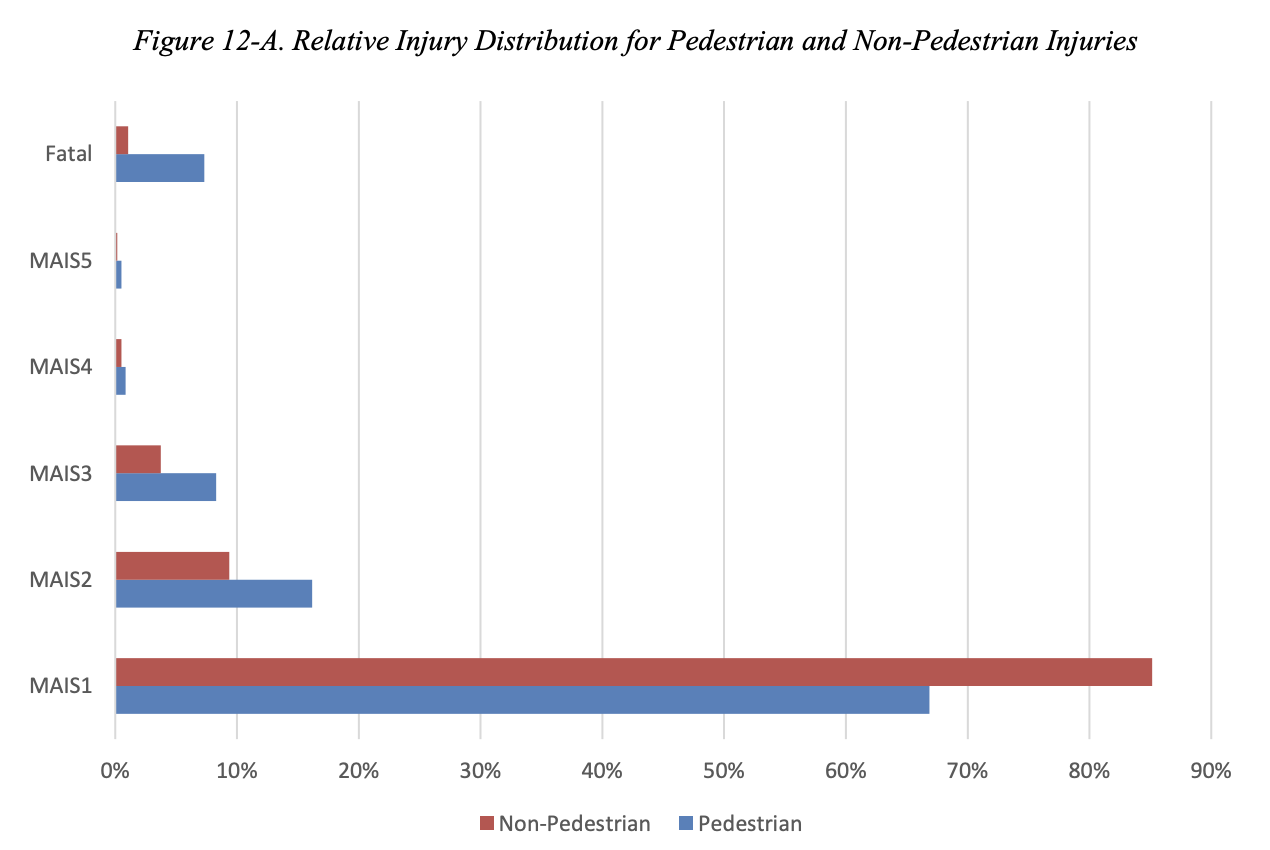
Reducing driving and reducing car dependence can lower the economic, social and human costs of crashes.
Blincoe, L., Miller, T., Wang, J.-S., Swedler, D., Coughlin, T., Lawrence, B., Guo, F., Klauer, S., & Dingus, T. (2023, February). The economic and societal impact of motor vehicle crashes, 2019 (Revised) (Report No. DOT HS 813 403). National Highway Traffic Safety Administration.
https://www.nhtsa.gov/press-releases/traffic-crashes-cost-america-billions-2019?s=09
