What City Observatory did this week
We took the week off to celebrate the Summer Solstice and gorge on Hood strawberries!

We’ll be back next week.
Must Read
The amazing non-appearance of Carmageddon. Echoing the point we made a City Observatory in the days—Carmageddon does a no-show in Philly —after the I-95 freeway closure in Philadelphia, Aaron Gordon of Vice points out that traffic quickly adapted to the decline in freeway capacity. Contrary to folk beliefs (cherished and nurtured by highway engineers) there was no chaos, gridlock or mayhem. Commuters, through traffic, and freight movement quickly adjusted travel patterns and times, and life proceeded just as before. 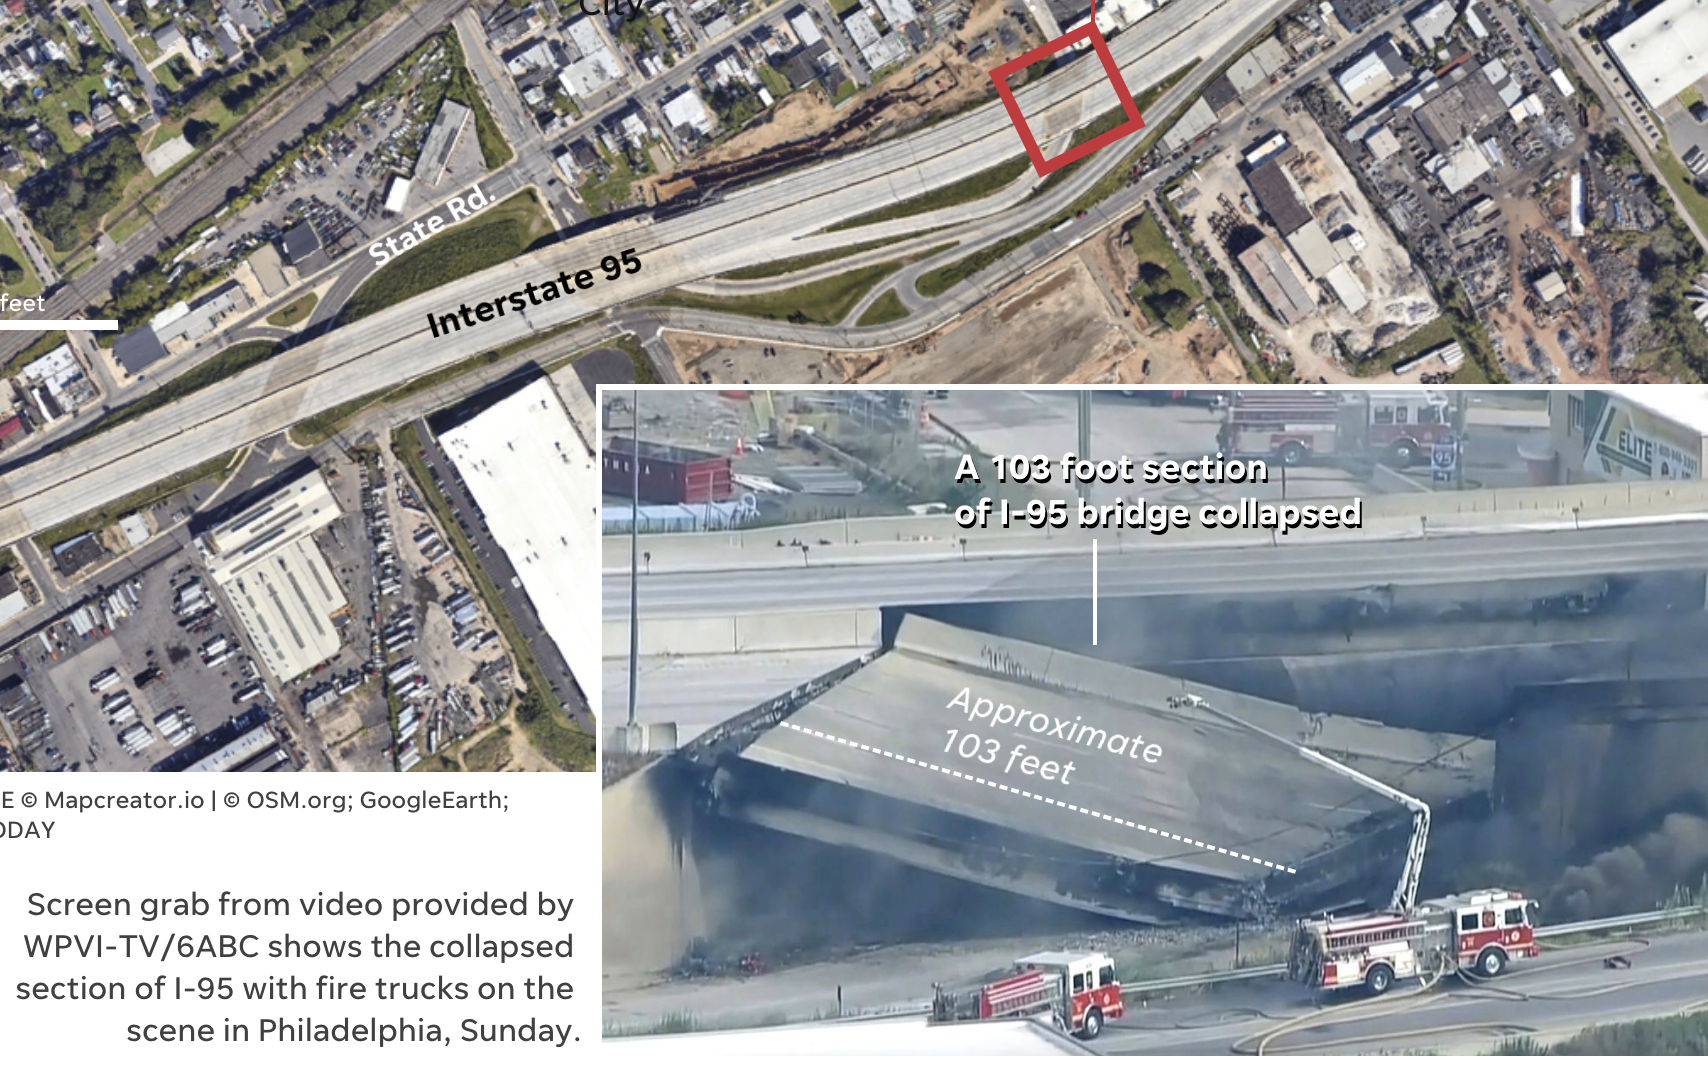
Gordon cites detailed analyses by traffic monitoring firms confirming what our early look at Google traffic maps showed: Travel times and delays post-shutdown were almost identical to pre-crash conditions. As Gordon writes:
Almost two weeks after the collapse, the bridge still isn’t fixed—although it will supposedly re-open this weekend in record time—but it is clear that those dire predictions did not come to pass. Initial surges in traffic in the Philadelphia area eased by the end of the week, according to data collected by HERE Technologies and Inrix, two transportation and mapping companies that use vehicle data to measure traffic flows.
Apocalyptic gridlock did not ensnare the Philadelphia area. Truck traffic did not come to a halt. In fact, more people rode the train or took alternate routes and life marched on. A few key highway junctions are a bit slower than they were two weeks ago and traffic in the immediate area of the collapse remains thick. . . . whether it’s people using public transit, workers working remotely, drivers figuring out better alternate routes, the congestion in the entire region returned to pretty close to normal by the end of this past week.
As we wrote a week ago: this “traffic evaporation” reflects the rapid and resilient behavioral response to changes in road capacity, a fact denied by the premises of the traffic models that are routinely used to justify expensive and ineffective road widening projects.
Work from Home increased the demand for housing. At Axios, Felix Salmon makes an important point: Now that we’re spending less time in commercial office space, people are likely to be demanding more “home office” space. As Salmon explains:
Take New York City as an example. If you look at square feet per resident and per employee in the Big Apple, the average New York household fits about 2.5 people into about 1,000 square feet. If one of those people has access to an external office, that provides another 150 square feet of space for working in. When that person works from home, the household is going to feel more cramped than usual unless it expands by about 150 square feet. If the family demands 150 more square feet, that’s a substantial increase in demand, at 15%.
This is likely to have important implications for housing demand in cities. If an urban household needs room for both its domestic/residential needs, plus additional space for a separate home office, we can expect people to spend more on housing (i.e. shifting their commuter savings to buying more residential space). This will likely reduce average occupancy–for example, two people renting a three bedroom apartment to keep one room as an office. This higher housing demand, in turn, would show up as both higher rents and lower total population.
New Knowledge
Unsafe speeds for pedestrians. New data shows that 2022 was the deadliest year for pedestrians in the US in decades. Speed is a leading factor in pedestrian deaths, and new data from Streetlight data shows a stark contrast in the speeds that pedestrians are exposed to in different cities across the US.
Streetlight has calculated the average speeds on roadways with more than 200 pedestrians per day for each of the nation’s 30 largest cities. The contrast between the best and worst performing cities is dramatic. In New York, average speeds on pedestrian streets exceed 35 miles per hour on only 1 percent of streets. In Phoenix, 65 percent of all these pedestrian frequented streets had speeds average speeds of 35 miles per hour or more.
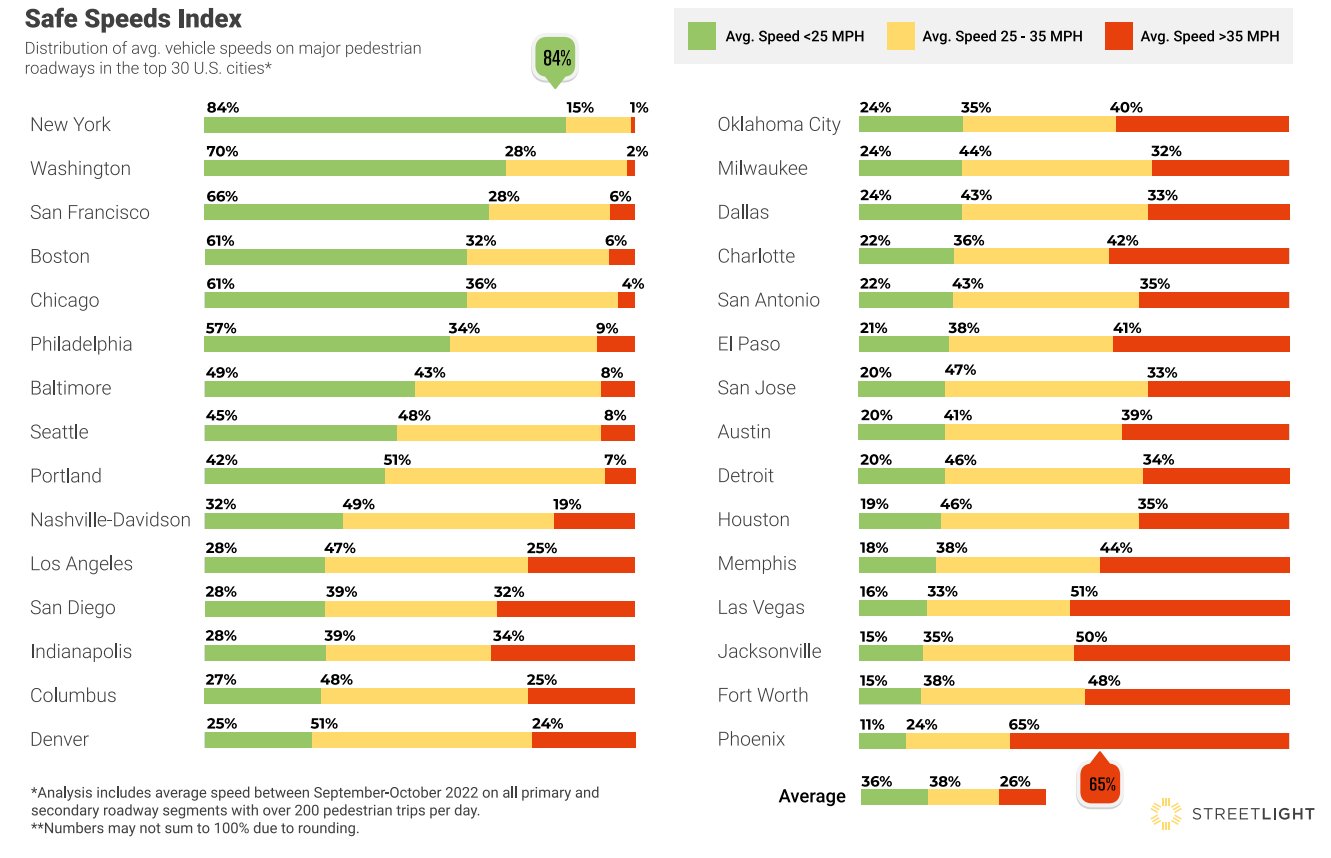
In all nine cities have less than 10 percent of their pedestrian-frequented roads with average speeds of 35 miles or more, while sixteen of the top 30 have a third or more of all such roads with average speeds over 35 miles per hour. In three cities: Phoenix, Jacksonville and Las Vegas, half or more of pedestrian frequented streets have average speeds of 35 miles per hour ore more.
The data are a clear reflection of urbanity and street design. Cities with dense vibrant centers (New York, Washington, Boston, San Francisco, Chicago) have relatively few pedestrians exposed to the most dangerous streets. In contrast, the sprawling cities of the sunbelt, where many streets are wide, multi-lane arterials, expose more pedestrians to dangerous speeding traffic.
There’s also a strong correlation between cities that score well on Streetlight’s “Safe Speed” Index, and the Pedestrian Death Rate, tabulated by Transportation for America.
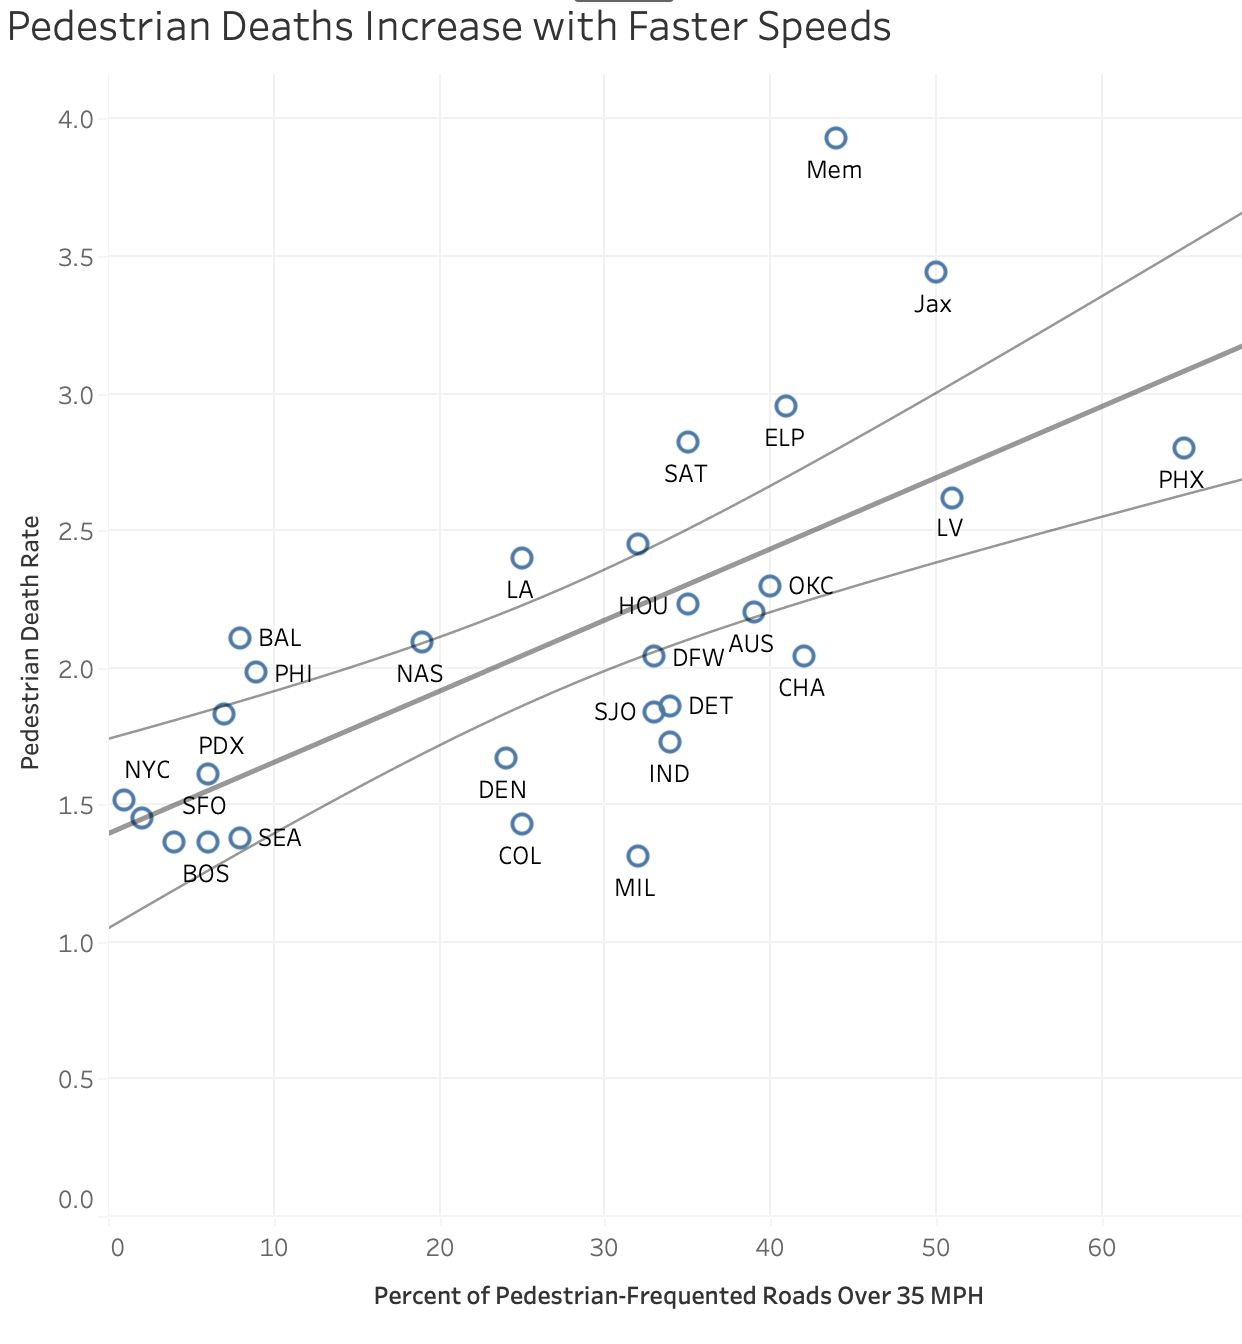
Cities that optimize their land use and transportation networks to speed automobiles create the most dangerous conditions for pedestrians, cyclists and other vulnerable road users.
In the news
Thanks to Streets.MN for pointing their readers to our commentary on the amazing non-appearance of Carmaggedon in Philadelphia.
