What City Observatory did this week
Dr. King: Socialism for the rich and rugged free enterprise capitalism for the poor. We’re reminded this year of Dr. Martin Luther King’s observation that our cities, and the public policies that shape them, are deeply enmeshed in our history of racism.
Whenever the government provides opportunities in privileges for white people and rich people they call it “subsidized” when they do it for Negro and poor people they call it “welfare.” The fact that is the everybody in this country lives on welfare. Suburbia was built with federally subsidized credit. And highways that take our white brothers out to the suburbs were built with federally subsidized money to the tune of 90 percent. Everybody is on welfare in this country. The problem is that we all too often have socialism for the rich and rugged free enterprise capitalism for the poor.
Must Read
Once again, transportation is the leading source of greenhouse gas emissions. StreetsblogUSA reports the latest data on climate change, and as for the past few years, the leading source of greenhouse gases in the US is transportation. Here are the data gathered by the Rhodium Group:
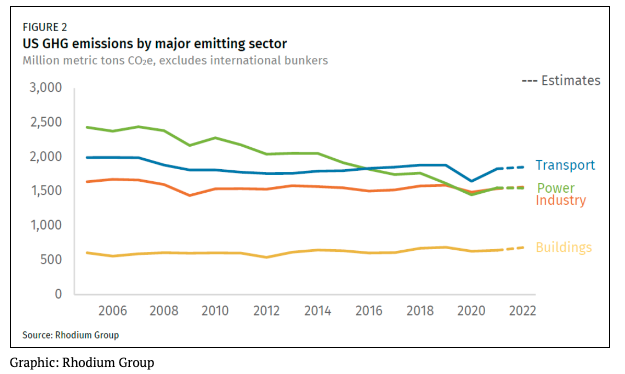
While we continue to make progress, slowly, in reducing emissions from industry, electricity production and buildings, emissions from transportation are not noticeably lower than they were a decade ago (about 2 billion metric tons). In spite of improved fuel economy and vehicle electrification, transportation emissions are contributing little toward achieving greenhouse gas reduction goals. We obviously need to do much more to reduce transportation emissions if we’re to address climate change.
It’s time to stop coddling cars. For too long, we’ve pursued a banal “all of the above” strategy, thinking that just adding a few more alternatives to automobile transportation will fundamentally shift our travel patterns (and reduce our carbon emissions). In a powerful essay at Dezeen, Phineas Harper says we have to be more forthright about discouraging car travel if we’re to make any progress. Cities, he writes, should not just build green transport, but actively dismantle car infrastructure. Car transportation is so privileged and so subsidized that simply creating “alternatives” does little to undermine the automobile’s hegemony over urban space. One of the best ways to break with the past is to simply stop trying to fight automobile congestion; though it may seem paradoxical to some, Harper argues:
Managed strategically, congestion is critical in supporting the transition to safe, sustainable transport.
Frustration with slow and congested automobile traffic creates demand for real alternatives, like walkable urban spaces. In contrast, building more roads to relieve congestion simply prompts more driving and pollution. And there’s no reason to believe in a technical fix for this problem:
Moreover, car-based urbanism, electric or not, is inherently unsustainable, creating low-density, inefficient and dangerous cities. A grieving parent will find little comfort in learning their child was run over by a Tesla Cybertruck rather than a diesel 4×4.
Harper’s advice challenges the widely repeated slogan that we can tackle our transportation problems with “multi-modalism,” which is usually just a marketing gimmick to sanitize a giant highway project with a few token bike-lanes or sidewalks.
New Knowledge
Rent growth in US 100 US cities over the past five years in one chart. The housing market is both national and local. There are big national trends that affect every place, as when we have a pandemic, or there’s a recession or sudden surge in inflation. But every local market is a different from the nation, with some leading and others lagging national trends. You can see the whole pattern of rent price changes in the US in a comprehensive new visualization created by Rob Warnock at Apartment List.
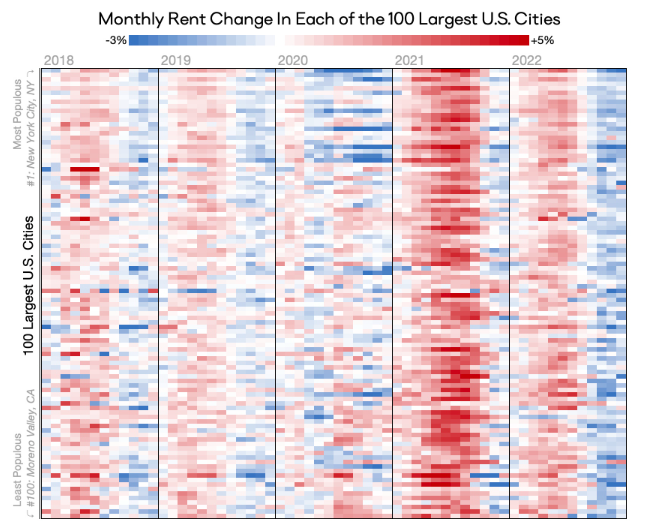
This chart shows the month-by-month price changes in the 100 largest US market from 2018 through 2022. Price increases are shown in red, declines in blue; markets are ordered from largest to smallest on the vertical axis. You can immediately see the surge in rents nationwide in 2021 as a red-band. You can also see a cooling of rental price inflation in the last quarter of 2022 in nearly every US market. Its also obvious that there is an underlying seasonal pattern to rent price fluctuations, which rents generally increasing the first half of the year and declining in the second half.
The Apartment List website has a detailed description of the methodology and explores and explains many of the key trends in the data, breaking down the year-by-year developments. It’s hard to find such a compact and detailed overview of the US rental market. If you want to get some perspective that goes beyond the last month’s or last year’s inflation data, and visualize trends in city rental markets at glance, this is the place to go.
In the News
Streetsblog re-published our “Reporter’s Guide to Congestion Cost Studies,” exposing the flawed premise underlying the claims that we lose billions of dollars each year to congestion.
