What City Observatory did this week
A toll policy primer for Oregon. The Oregon Department of Transportation is proposing to finance billions in future road expansions with tolling. While we’re enamored of road pricing as a way to better manage our transportation system, the movement to raise moeny with tolls, and in particular by borrowing against the promise of future toll revenues raises significant risks. This policy primer sketches out the nature of the underlying transportation problem we’re trying to fix (underpriced roads are over-used, and chronically under-funded), and describes the risks from ODOT’s proposed “borrow and build first, toll later” strategy, which promises to saddle the state with billions of dollars in debt for roadways that are unlikely to be used when we ask drivers to pay for them through tolls. Louisville, Kentucky stands as a cautionary tale: the state spent a billion dollars widening I-65 over the Ohio River, but after it imposed modest tolls traffic fell to half of pre-construction levels, saddling the state with enormous debt for a road that is spectacularly under-used:
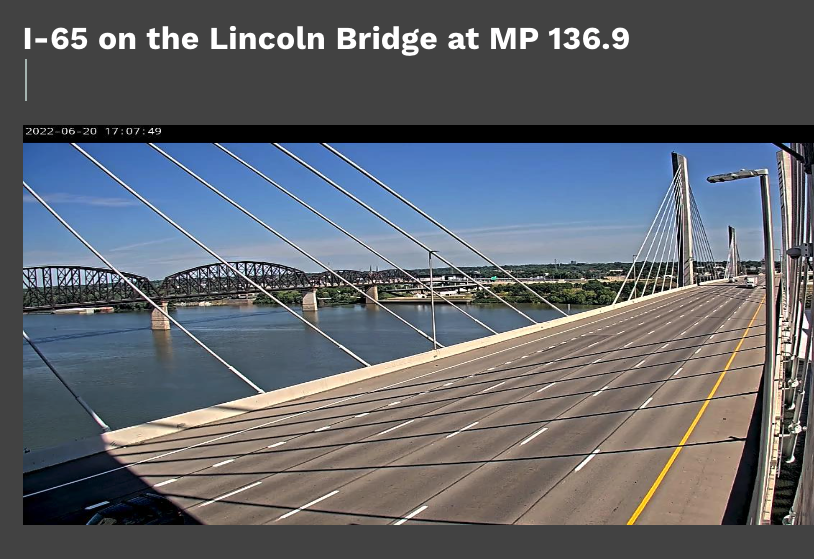
The “borrow, build and toll” scheme runs this risk of putting the state in a position where it has to encourage more driving (contrary to its stated climate goals) in order to pay off construction debt. State policy makers would be well-advised to fully understand the costs and risks of tolling before they pin the state’s transportation future to this perilous source of funding.
Must read
A reform agenda for US DOT. We’re a little bit late to this particular party, but the Center for American Progress produced a terrific report in 2020 identifying some key opportunities to overhaul transportation policy in the US. This comprehensive report addresses transportation finance, climate change, and equity, and is a useful framework for those working to improve transportation at a state and federal level.
. . . current policy and program structures need deep reforms to ensure that federal investments are equitable, sustainable, and targeted to communities facing the greatest need. Simply adding more money to the status quo will not help the United States meet its global climate commitments or redress the harms caused by discriminatory project selection and exclusionary labor practices.
You get what you pay for and housing affordability: Writing at Market Urbanism, Salem Furth has a nuanced take on an oft-overlooked part of the housing affordability puzzle. A big part of our problem is an overall shortage of housing relative to demand. But the problem isn’t just one of aggregate supply. There’s a mismatch between the houses that are available and the characteristics of housing we most value and want to buy. Housing comes bundled with lots of characteristics and amenities, some of which we value highly, and some not so much. One of the effects of zoning regulations is to force people to pay for some things they don’t value highly: Minimum lot sizes require people to “buy” a minimum amount of land in order to be able to have a place to live, and in places where land is expensive, that may make housing to costly for many to afford. Exclusive single family zoning in some neighborhoods means you have to buy a single family home to live in that neighborhood, even though you might prefer a townhouse or apartment (and be able to avoid lawn maintenance). More subtly, zoning and building requirements can create mismatches between the kind or size of housing people want, value or can afford and what’s available. So the more we create flexibility to have different kinds of housing, the more likely we are to have better “matches” between supply and demand and reasonable price points.
Developers push big hgihway package in Sacramento. California public finance has been hamstrung by super-majority voting requirements for many tax increases, but the state Supreme Court recently carved out a provision allowing citizen-initiated taxes to be adopted with a simple majority. In Sacramento, a developer backed group has seized on this provision to package up a $8.5 billion road widening package that would facilitate further sprawl in and around California’s capital. There’s a lot not to like about this proposal: it would not only undercut the region’s and state’s climate strategy, but it is also funded from the sales tax, which means that there’s no connection between how much you travel or drive, and who pays for the road expansion. The Sacramento Bee has an in-depth story on the political maneuvering going on.
New Knowledge
Mapping activity centers in the nation’s metropolitan areas. The spatial structure of metropolitan economies is an under-studied topic. Our friends at the Brookings INstitution’s Metro Center have a new publication that sheds an interesting light on the clustering of economic activity within metro areas. They use a wealth of data on the location of businesses and institutions within cities to identify what they call “activity centers.” Their approach identifies five different kinds of assets or amenities (tourism, community, tourism, consumption, institutional, and economic. They then gather data on the concentrations of those assets in different location and identify three differ kinds of centers. Places with a concentration of just one asset are called mono-centers. Places with some concentration of at least two different assets are secondary centers, and the places with relatively large concentrations of two or more kinds of assets are defined as “primary centers.”
This classification system enables Brookings to map the size and location of activity centers in more than 100 of the nation’s largest metropolitan areas. These maps illustrate the concentration of activity in particular locations. Here is the map for Portland, Oregon:

The largest concentration of activity centers is in an around the city’s downtown (in the center of the map). There are a smattering of other centers in the remainder of the region, with most suburban centers being “mono-centers” (blue).
The Brookings research strategy parallels City Observatory research in developing the “storefront index.” Our index looks at the concentration of common kinds of retail activity, and identifies clusters of storefronts located 100 meters or less from one another. Here we’ve overlaid the storefront index on the Brookings Activity Centers for the Portland Metropolitan area.

On this map, the red dots represents clusters of storefronts. The black circle in the center of the map is a 3-mile radius around the center of the region’s central business district.
The definition of activity centers is just the starting point. The full report looks at the connections between activity centers and employment concentrations, productivity, walkability and vehicle miles traveled. Primary activity centers tend to be among the most disproportionately economically productive locations, tend to be more walkable and people living in or near these centers are less likely to travel by automobile. In addition, as the report points out, because
. . . low-income and racial minority groups tend to live in areas with higher accessibility to activity centers, efforts to focus development in these areas have strong potential to benefit these groups.
We need to know much more about the fabric and dynamics of urban spatial structure. This Brookings report helps us visualize how important this perspective can be.
Tracy Hadden Loh, DW Rowlands, Adie Tomer, Joseph Kane,and Jennifer Vey, Mapping America’s Activity Centers”. the Building Blocks of Prosperous, Equitable and Sustainable Regions. Brookings Institution, October, 2022.
