What City Observatory did this week
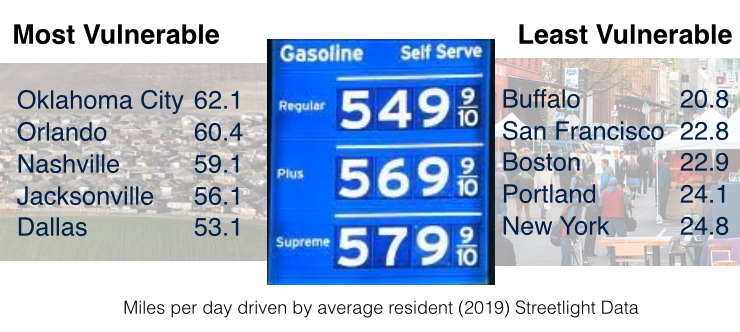
Who’s most vulnerable to high gas prices? Rising gas prices are a pain, but they hurt most if you live in a sprawling metro where you have to drive long distances to work, shopping, schools and social activities. Some US metros are far less vulnerable to the negative effects of rising gas prices because they have dense neighborhoods, compact urban development, good transit, and bikeable, walkable streets. Among the 50 largest metro areas, the best performers enable their residents to drive less than half as much as the most car-dependent metros. Those who live in metro areas where you have to drive, on average, 50 miles or more per day (places like Oklahoma City, Nashville and Jacksonville) will be hit twice as hard by higher fuel prices than the typical household living in a place like San Francisco, Boston or Portland, where people drive, on average, fewer than 25 miles per day. When gas prices go up, it’s easy being green: These compact, less car-dependent metros and their residents, will experience far less economic dislocation than metros where long daily car trips are built-in to urban form.
Must read
Homelessness is a housing problem. Homelessness is a gnarly and growing problem. But what is at it’s root? A new analysis from Gregg Colburn and Clayton Page Aldern summarized at the Sightline Institute looks at some of the statistical correlates of homelessness, but comparing data on “point-in-time” counts of those unsheltered with key socioeconomic variables for different cities. What characteristics and trends are most closely related to high levels of observed homelessness. You might think that variations in poverty across cities would be a major factor, but statistically, that doesn’t seem to be the case. The most powerful observed correlation is between housing prices and homelessness: cities that have very high rents have higher rates of homelessness.

Poverty may be higher in some cities than others, but if rents are low and vacancies are high, then relatively more people, even those with limited incomes, find some shelter. In contrast, in tight housing markets with high rents and few vacancies, there may simply not be enough housing units to house everyone, and those with the lowest incomes find themselves outbid by those with more money. The clear implication here is that bringing down rents and expanding housing supply is central to reducing homelessness.
Seattle’s disappointing new waterfront highway. Seattle is close to putting the finishing touches on the new waterfront roadway that’s being built where the former Alaskan Way viaduct towered over the city for decades. While getting rid of the viaduct was a boon, the finished product looks to be a major disappointment. While the project was sold with parklike, green renderings of the waterfront, the reality is that mostly what has been done is to drop the old elevated highway down to street level. In places, the new highway will be as many as nine-lanes wide, and will separate the city’s downtown from its waterfront with a steady stream of speeding cars. The Urbanist has this critique:
The Washington State Department of Transportation (WSDOT) tore down its hulking waterfront highway viaduct only to place just as many lanes at ground level — and actually more south of Columbia Street, where the road turns into a giant queuing zone for the Seattle Ferry Terminal.
As is so often the case, the project was sold with a glossy bird’s eye view of the project. The ground level reality is something altogether different.

It’s a reminder that the devastation to urban space and urban living isn’t just caused by structures, its a product of the volume of cars, and of prioritizing the movement of those who are traveling through the city over those who actually want to be there.
New knowledge
How to save money on transportation: Don’t own a car. The Urban Institute’s Yonah Freemark has a thoughtful analysis of how higher gas prices affect households with different income levels based on their car ownership. Freemark has examined data from the Bureau of Labor Statistics Consumer Expenditure Survey showing what fraction of a household’s income is spent on transportation, based on car ownership by various income groups.
As the following table makes clear, transportation expenditures are most burdensome for low income households who own a car: those with incomes of less than $25,000 annually who own a car spend close to 25 percent of their household income on transportation. Interestingly, low income households who don’t own cars spent the smallest fraction of their household income on transportation—a little more than 5 percent. For higher income households, those who don’t own cars spend noticeably less (between a half and two-thirds as much) on transportation as those households that own cars.
![]()
In his accompanying commentary addressing the policy implications of this work, Freemark appropriately ties together housing and transportation costs as key drivers of family budgets. While much of the policy response to higher gas prices aims at buffering consumers from higher gas prices, a logical alternative is creating more opportunities for households, especially lower income households, to live in communities where they don’t need to own a car to enjoy a decent standard of living. One key to helping deal with expensive gas is to make sure that we have affordable housing, especially in dense, transit-served urban locations, where households can escape both the high cost of gasoline and the high cost of car ownership.
Freemark’s analysis can be read as a complement to our commentary on variations in miles driven among metropolitan areas. If communities or households make decisions to choose car-free or car-lite options, they’ll spend less on transportation, and be far less vulnerable to economic shocks when oil prices rise.
Yohah Freemark, What Rising Gas and Rent Prices Mean for Families with Low Incomes, The Urban Institute, March 17, 2022
