What City Observatory did this week
1. Lived segregation in US cities. Our standard measure of urban segregation, whether people reside in different neighborhoods, doesn’t really capture the way people from different racial and ethnic groups interact in cities on a daily basis. A new paper uses data gathered from cell phone records to look at the extent of mixing and isolation in the nations metro areas. It finds we’re generally much less segregated during the middle of the day than we are in the evenings, and that a range of public spaces and commercial ones, including parks, restaurants and entertainment venues, have much higher integration that residential neighborhoods.
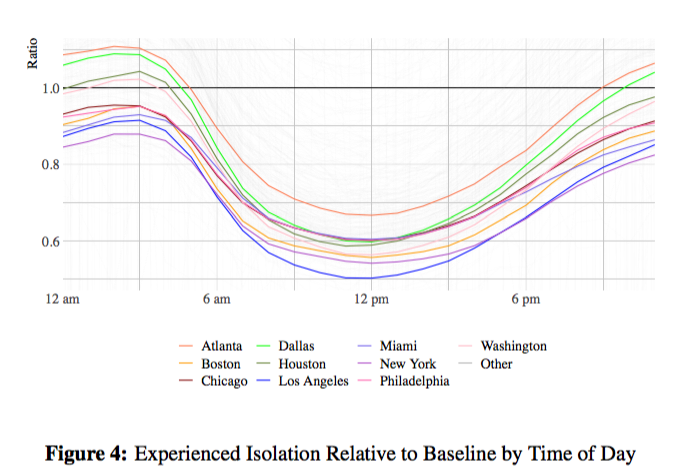
The data also show which cities have the highest—and lowest—levels of “experienced” integration. We have rankings for the largest US metro areas; Portland, Seattle and Minneapolis have the least “lived” segregation; Milwaukee, Detroit and St. Louis have the highest levels of segregation by this measure. The patterns of experienced segregation tend to parallel patterns of residential segregation.
2. Vancouver’s Columbian: “Suburban commuters matter.” After more than a year of working with the Oregon Department of Transportation on the proposed $800 million I-5 Rose Quarter freeway-widening project, a key Black community group pulled out of the project, prompting many local political leaders to withdraw their support. Who jumped in to support the project? The editors of the Vancouver Columbian, a suburban newspaper, who finally said the quiet part out loud: The real beneficiaries of the freeway widening are not local residents, but car commuters from Washington State, who will now be further inconvenienced because the road won’t we widened to allow even more cars to drive faster through this historically African-American community.
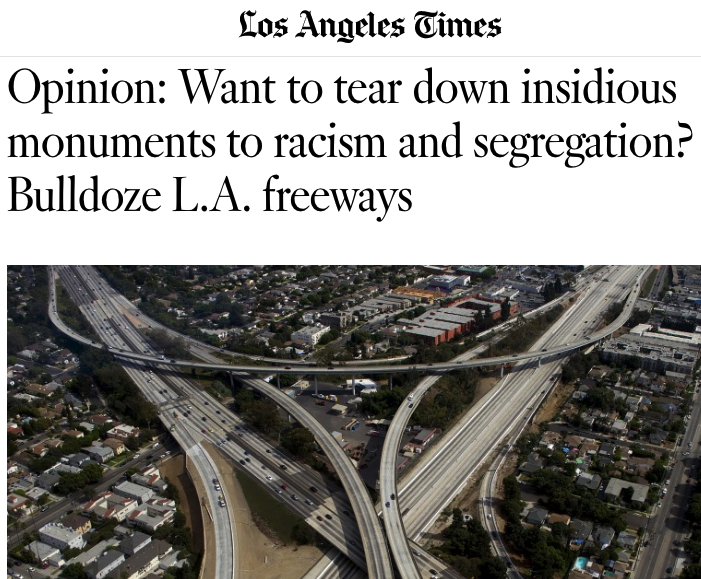
Freeways, and freeway-widening privilege wealthier, whiter suburban commuters over urban residents, who are disproportionately lower income, people of color, and who travel by means other than cars. Plus the $800 million Rose Quarter widening is just a stalking horse for reviving an even larger multi-billion dollar freeway project to add more car capacity across the Columbia River. The racism of freeways isn’t some dim, historic vestige, its a current and continuing reality in urban areas.
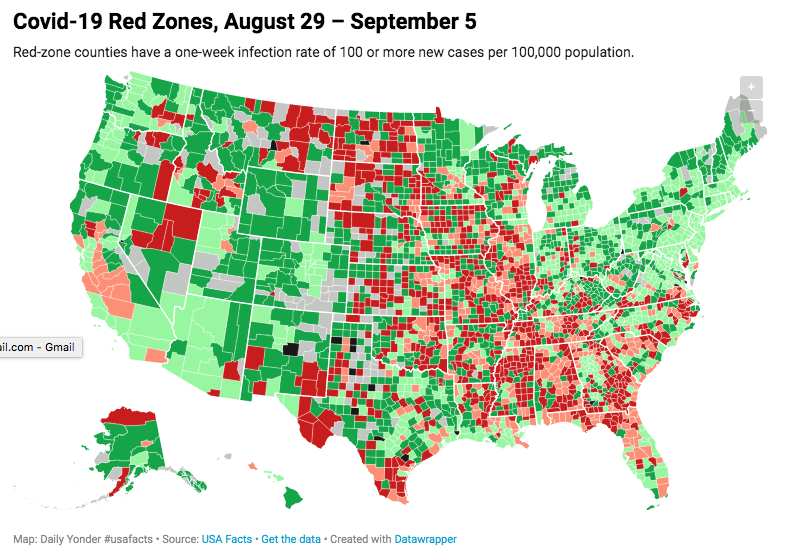
3. Covid is now a rural, red-state pandemic. Early on, people were quick to equate the Covid-19 pandemic with cities, and to incorrectly attribute the virus’s spread to density. That’s been disproven again and again. It’s now the case that the pandemic is worse in rural areas than in large cities. We compile analyses from three different sources (Brookings’ Bill Frey, Indeed’s Jed Kolko, and the Daily Yonder) showing how rural and red the pandemic as become. What’s striking now is that, regardless of city size or urban/rural status, the pandemic is worse in red states than blue ones. What we’re waiting for now is a swarm of media stories chronicling the exodus of people from small towns and red states to avoid the virus.
4. City Beat: No, people are not fleeing Portland for its suburbs. It’s becoming a favorite storyline in the media; frightened by the prospect of the Coronavirus, homebuyers are supposedly fleeing cities for their suburbs or surrounding hinterlands. The fact that the virus has spread to rural and small town America puts the lie to the premise, but its still being repeated, most recently by the Portland, Oregonian. Stories like these are always documented with anecdotes of one or a handful of households moving to the suburbs, or further, but since people are always moving in (and out) of cities, this is meaningless. The data shows that urban markets, including Portland, remain robust.
Must read
1. SUV’s and Climate Change. The sport utility vehicle (SUV) has become the symbol of climate change, but according to new data reported in the Guardian, its more than a symbol, its a tangible cause of increasing greenhouse gas emissions. The data from the International Energy Agency show that SUVs added more than 500 million metric tons per year to carb on emissions over the eight-year period 2010 to 2018, making them the second largest source of the increase in greenhouse gases.
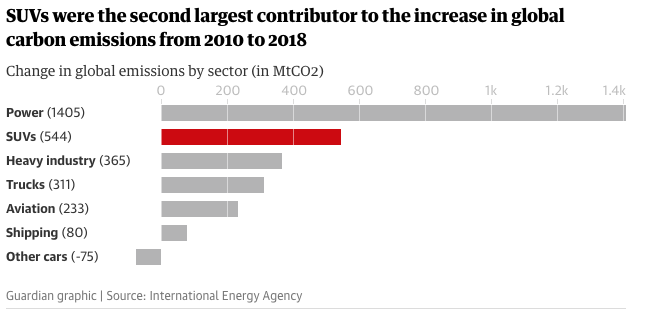
Part of the growth of SUV’s reflects the substitution of SUVs for standard cars in the world’s vehicle fleets; emissions from non-SUV cars actually decreased but were overwhelmed by the increase in SUV emissions.
2. An international perspective on America’s housing affordability problems. It may seem like the price of housing is a purely domestic concern, but the an article by political scientists Sam Winter-Levy and Bryan Schonfeld in the journal Foreign Affairs weighs in on US housing affordability with an informative piece that reminds us that the result of the world has mostly figured out how to deal with housing. The US (and the UK) are virtually alone in the world in allowing NIMBY’s virtually unlimited sway over whether and where to build new housing. Japan, which had a housing crisis two decades ago, implemented national policies to legalize denser housing almost everywhere. As Foreign Affairs explains:
. . . the national government passed a series of reforms assuming control over land use and reducing the ability of local opponents to block new housing construction. The government then eased planning restrictions in Tokyo, allowing taller and denser buildings. Since then, the city’s rate of housing construction has risen by 30 percent. In 2014, construction started on more new houses in Tokyo than in the entire state of California or in all of England. While the average price of a home in San Francisco and London increased by 231 percent and 441 percent, respectively, between 1995 and 2015, in Tokyo it remained essentially unchanged.
Underlying the US problem is the notion that housing ought to be a great investment, which as we’ve pointed out at City Observatory, is a recipe for policies and politics that automatically lead to higher home prices and less affordability. Other nation’s have lower rates of homeownership and much better housing affordability. Perhaps, as the authors argue, its time for a little less American exceptionalism.
3. Driving less, dying more. The Coronavirus has created a powerful transportation safety experiment. The volume of traffic, measured by vehicle miles traveled has fallen nearly 20 percent. But total traffic fatalities, according to data just released for the first six months of 2020, have barely budged. That means that the per mile rate of fatalities has increased significantly:
The National Safety Council (NSC) estimate of total motor-vehicle deaths in the first six months of 2020 is 18,300, up 1% from the preliminary 2019 estimate of 18,200. . . . The estimated mileage death rate for the first six months is 1.37 deaths per 100 million vehicle miles traveled, up 20% from the revised 2019 rate of 1.14. Estimated vehicle miles traveled for the first six months of 2020 indicate nearly a 17% decrease compared to last year from 1,595 billion to 1,331 billion.
The most likely reason: Fewer cars on the road prompts more speeding and reckless driving by those remaining. It’s a reminder that some level of traffic congestion actually saves lives by slowing vehicles and reducing the number and severity of crashes.
New Knowledge
Road safety: Driver error or bad design? You’ll often hear claims that most crashes, and associated injuries and fatalities, should be chalked up to “driver error.” The implication is that the cause is essentially random and uncontrollable. But what if driver’s are actually responding to visual cues in the built environment about how fast to drive, and how carefully to look out for other road users? If such cues are important, then crashes aren’t random or unavoidable, or even necessarily the driver’s fault, but are really attributable to bad road design.
A new study published in the Journal of Planning Education and Research addresses exactly this issue. The full study itself is gated here, but Beth Osborne has a terrific summary of the research published at the State Smart Transportation Institute.
. . . the design of the built environment primes drivers’ expectations about potential conflicts or hazards and to what risks they should be prepared to respond. The embedded conditions in the built environment can cause “inattentional blindness”: situations in which drivers look but still do not see a conflict type that the design doesn’t prepare the driver to watch out for (usually pedestrians, bicyclists or motorcyclists).
The key point here is that we need to evaluate traffic safety from a cognitive and behavioral perspective, recognizing that context and the physical environment condition the way drivers act. Many road design standards that provide more room for error (wider lanes, clear zones, wide rights-of-way, and building setbacks) also send driver’s unmistakeable cues that they can and should drive faster, and that this space is exclusively for their use. Other design choices may prompt safer behavior: We all instinctively tend to drive more slowly and carefully on narrow roads, with limited visibility and many obvious indications that other users are present. As places work to achieve Vision Zero, its worth keeping in mind that rethinking the behavioral cues give to drivers may be more effective in protecting vulnerable road users than added doses of infrastructure.
Eric Dumbaugh, Dibakar Saha & Louis Merlin, “Toward Safe Systems: Traffic Safety, Cognition, and the Built Environment,” Journal of Planning Education and Research. August 2020. doi:10.1177/0739456X20931915
In the News
Flossin Magazine published Joe Cortright’s essay “Restorative Justice: Will ODOT’s $800 million freeway widening restore Albina, or just repeat past injustices?”

Thanks to Greater Greater Washington for pointing its readers to our commentary pointing out that much of what is called “pedestrian infrastructure” is needed only because of the prevalence of cars, and is really infrastructure that benefits car travelers, not people walking.
