The Interstate Bridge Project proposes spending $7.5 billion to widen I-5, but misses the real bottleneck.
A new, independent analysis by national traffic expert Norm Marshall of Smart Mobility, Inc., shows that the proposed IBR project fails to fix the real bottlenecks affecting I-5 traffic.
Traffic problems on I-5 are caused by bottlenecks outside the project area, that aren’t affected by the IBR project.
IBR will make traffic problems worse, especially in the morning peak hour, by funneling more traffic into these bottlenecks.
The limited 3 lanes of I-5 in each direction between the Fremont Bridge and Lombard will continue to cause daily congestion.
The Oregon and Washington highway departments are planning to widen the freeway to ten or more lanes on a stretch of I-5 between Portland and Vancouver, rebuilding seven intersections and five miles of highway. The community group Just Crossing Alliance retained national traffic modeling expert Norm Marshall of Smart Mobility, Inc., to conduct a detailed review of the IBR’s traffic modeling. But Marshall’s analysis shows this added capacity doesn’t address the real bottlenecks on I-5, which are actually further south of the actual project area.
Far from fixing the congestion problem, Marshall’s analysis shows that this will actually make traffic much worse, especially in the morning rush hour. Essentially, the IBR project is building a large funnel to pour even more traffic into the morning southbound bottleneck at about North Lombard. The I-5 freeway narrows to just three lanes between Lombard and the Fremont Bridge, and this is the area where traffic backs up today. Adding even more capacity at and near the bridge simply funnels more cars, more quickly into this bottleneck–and will make traffic conditions even worse.
Marshall’s analysis, using detailed hourly traffic speed data for I-5, shows that traffic actually moves more rapidly across the Interstate Bridge than it does in the area south of the project in both the morning and afternoon peak hours. In the morning, southbound traffic from Vancouver backs up from the Lombard Street exit. These speed maps confirm what regular commuters already know: the slow down doesn’t occur on the I-5 bridge—traffic moves at close to 40 miles per hour on the I-5 bridge and approaches. The real slow down is right at Lombard Street, where traffic slows to less than 20 miles per hour. (Between the purple triangles)

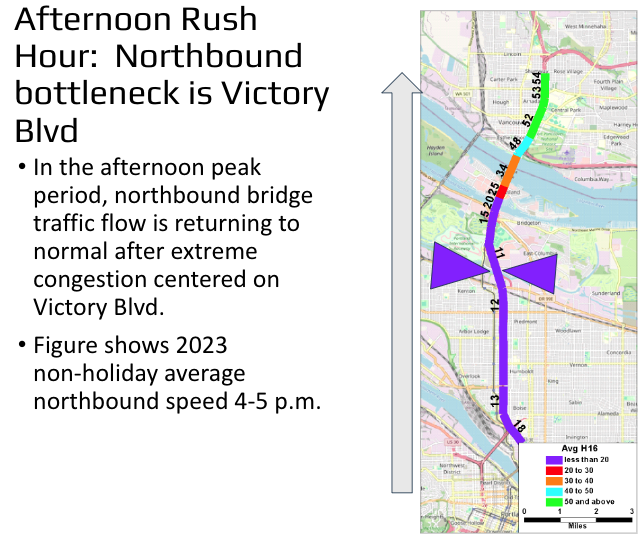
In the afternoon, Marshall’s analysis shows the real bottleneck is at about Victory Boulevard (which is near the southern boundary of the I-5 widening project). Today, traffic accelerates once it gets past this bottleneck. Again–it is the limited capacity of I-5 between Victory Boulevard and the Fremont Bridge, not the width of the I-5 Columbia River Bridges—that is the real bottleneck. Again, these maps show what regular commuters already know, the big slowdowns on I-5 are well south of the I-5 bridge. For several miles between the Fremont Bridge and Victory Boulevard, traffic moves at 11-13 miles per hour. After Victory, traffic accelerates; and once one gets to the I-5 bridge, traffic steadily moves faster, and when exiting the bridge, traffic moves at 48 miles per hour—roughly the speed corresponding to maximum throughput. As Marshall points out this is a classic example of what traffic engineers call “queue discharge”–traffic speeds increase once you get past the bottleneck.
In one of the most memorable scenes from Raiders of the Lost Arc, Indiana Jones and his partner Sallah decipher the instructions from a medallion that shows the location of the Arc of the Covenant, and in the process, see that the Nazi’s seeking the Arc have missed a vital piece of information, Jones and Sallah to exclaim “They’re digging in the wrong place.” In simple terms, that’s exactly what the flawed traffic models generated by the IBR have done. They’re pretending that the bottleneck limiting traffic flow on I-5 between Portland and Vancouver is the width of the I-5 bridge and its approaches. But Marshall’s analysis shows that the real bottlenecks are further south—and won’t be resolved by the added capacity.

How can a sophisticated model get things so wrong?
Despite the trappings of technical expertise, there’s a very clear reason why the models used by the IBR project are wrong. The models use something called “static traffic assignment” or STA, which break the freeway system into separate segments, and estimate the traffic flow on each segment separately and independently. If the STA model predicts traffic that exceeds the capacity of a roadway one one segment, it fails to address how that has the inevitable upstream and downstream effects. In the real world, if a road is jammed to capacity at one segment, traffic backs up onto preceding segments of roadway, and also no more than the maximum amount of traffic on a constrained segment can flow into the next segment. As a result, even though the capacity of the I-5 bridges is no more than about 5,000 vehicles per hour in the afternoon peak direction, the IBR model claims that more than 6,200 vehicles per hour are crossing the bridge. The STA model assumes that traffic doesn’t back up into preceding segments when flows exceed capacity, and also assumes that more traffic flows into succeeding segments than is possible.
This kind of model assumption was necessary forty and more years ago when computer processing power made it hard to allow for these situations. But today, traffic modelers have developed more realistic methods, called “Dynamic Traffic Assignment” that allow conditions on one segment to affect upstream and downstream segments. But IBR modelers have clung to the out-dated, and demonstrably wrong “STA” methodology, even though dynamic traffic assessment models have begun to be developed for other projects in the Portland area, notably modeling traffic flows on I-205.
The Marshall Report
The Marshall Report, a detailed 32-page critique of the IBR’s traffic modeling, was commissioned by the community group Just Crossing Alliance. You can read the entire Marshall report here:
[pdf-embedder url=”https://cityobservatory.org/wp-content/uploads/2024/10/Marshall_SDEIS_Modeling_Review_October2024.pdf”]