What City Observatory did this week
1. The high price of cheap gas. We’ve hit the peak of summer driving season, and also the 103rd consecutive week of falling year-on-year gas prices. Though the 39 percent drop in gas prices over the last two years has led to only 4 percent more driving per person (so far), it also seems to be driving up traffic fatalities (up 8 percent), reducing fuel economy and accelerating damage to the climate. All of these things are bad for the economy in the long run. Cheap gas isn’t worth celebrating.
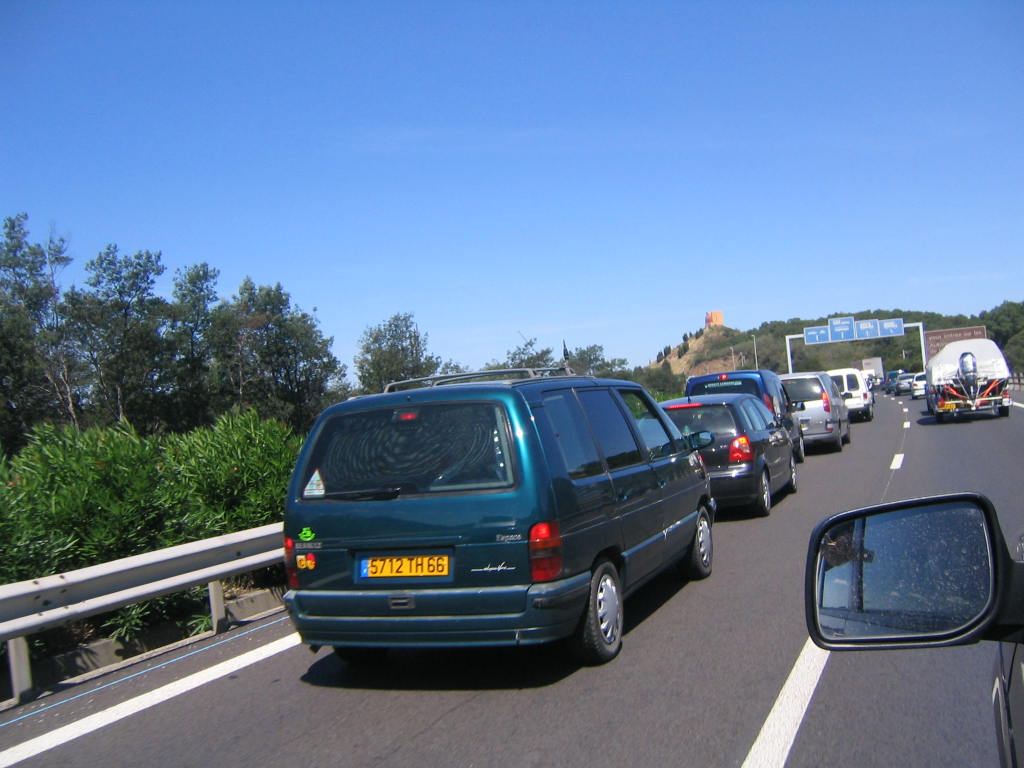
Vacation Traffic (Flickr: Lunavorax)
2. Data-driven planning has serious shortcomings. There’s a subtle but profound bias to our current transportation data: it’s all about vehicle travel, and not at all about walking, biking and how we might have fewer and shorter trips. Traffic engineers can immediately tell us when a road’s pavement has deteriorated, or its level of service has become (or might someday become) degraded. But if you don’t count it, it doesn’t count – and many things that matter to cities are hard to count or uncountable. As Google’s city planning arm, Sidewalk Labs, tries to apply “big data” to urban problems, we must remember that better technology can’t solve bad priorities.
3. How do we know zoning constrains urban development? Some people look at expensive central cities and argue that with no zoning, we’d have more density. Others look at growing suburbs and argue that with no zoning, we’d have less density. Who’s right? An important 2005 study used data from Boston and Atlanta to test this. It found that Atlantans who said they preferred dense areas were much less likely than Bostonians to succeed in living in one – implying a “shortage of cities” in greater Atlanta.
4. More evidence that mixed-income communities connect poor families with opportunity. Chicago children who moved out of very low income neighborhoods were 5-10 percentage points more likely to be employed as adults, according to the long-term outcomes of a randomized voucher program in the early 1990s. Because previous research didn’t draw on a randomized test, it may have understated this effect. The lesson: cities are well-served when neighborhoods have a mix of people from different income groups, rather than being segregated by income.
The week’s must reads
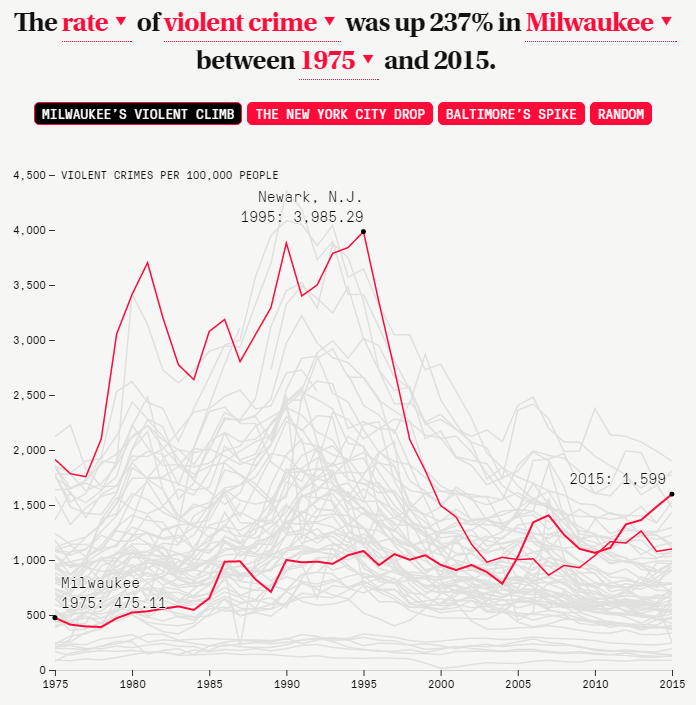
1. Is violent urban crime rising or falling? The question is a football in the presidential race, and the truth is that crime rates fluctuate by year and vary by city. Yes, Baltimore did see a big spike in 2015; yes, the national trend is a huge drop since 1990. The Marshall Project transcribed 40 years of FBI crime data by city to show how much the great crime decline varies from place to place. At the national level, the answer is clear: violent crime is down 50 percent since 1992, and lower now than any time since 1976.
2. Should cities replace population forecasts with vacancy targets? Traffic forecasts have proved horrifically inaccurate in the last 15 years. Why do cities assume they can predict population changes? Shane Phillips argues that (much like cities should set a target curb vacancy rate rather than trying to guess the perfect parking price) cities would be better off setting a target housing vacancy rate and then using tools like zoning and public financing to move it up or down.
3. The bleak future of suburban poverty. More people in poverty now live in suburban areas than in urban ones. In some ways, that’s a reversion to the mean – rich people in the core, poor people further out. But it’s also “hard to imagine a more despotic environment to be poor in than America’s suburbs,” built around the car and around infrastructure that’s hugely expensive to maintain. Strong Towns spent the week examining modern suburban poverty from different angles.
4. One last push for smarter traffic modeling. Ahead of an Aug. 20 deadline for public comments on the U.S. Department of Transportation’s proposed congestion measure, Smart Growth America’s Alex Dodds has an op-ed in The Hill, arguing that federal rules should recognize that a “10-minute commute at 10 miles per hour is better than a 50-minute commute at 50 miles per hour.”
New knowledge
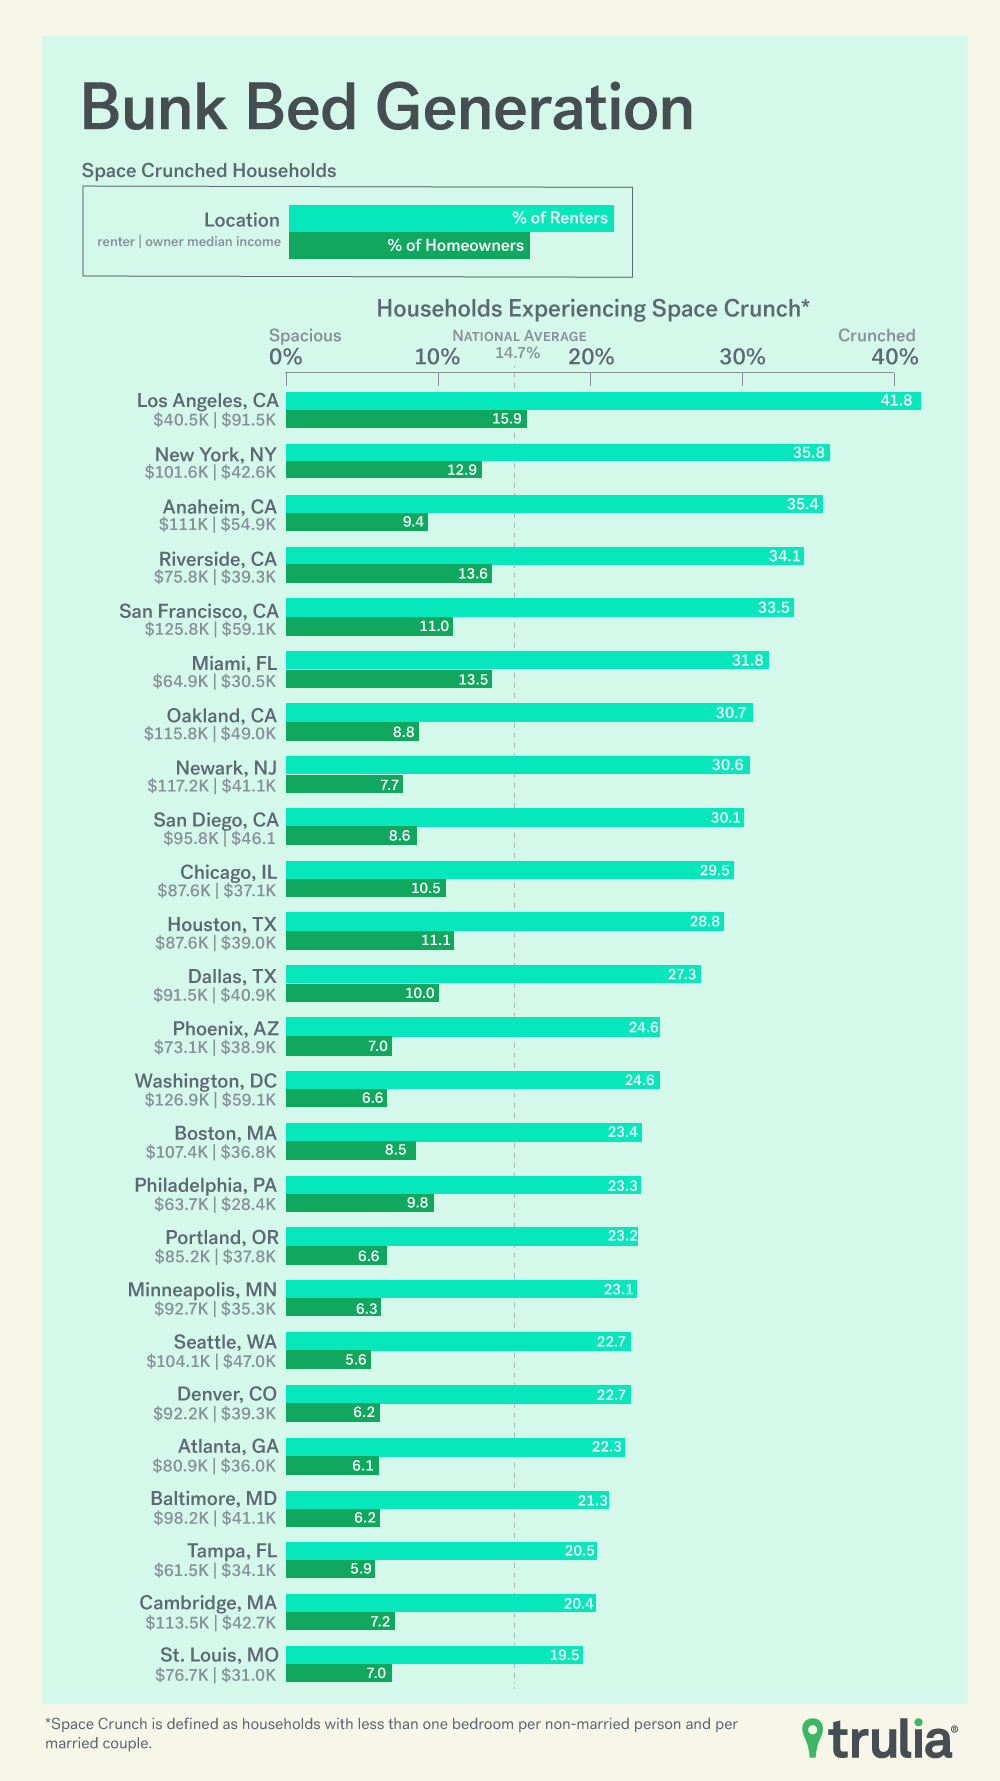
1. Who’s living in crowded bedrooms? Eight percent of homeowner households and 26 percent of renting households have nonmarried household members sharing a bedroom. To make the estimate, Trulia’s Mark Uh used American Community Survey data and started from the assumption that each married couple shares a bedroom and others get their own bedrooms unless they can’t. The ratio varies considerably across metro areas: in higher-priced ones, room-sharing is much more common, with Los Angeles leading the pack among both renters and homeowners.
2. “Economic distress” doesn’t really capture the Trump coalition. Gallup economist Jonathan Rothwell mines a wealth of demographic and polling data to conclude that support for Trump is not strongly correlated with economic distress, as many pundits have suggested. Though Trump supporters are more likely to be blue collar, they tend to have higher than average incomes. And they’re more likely to live in neighborhoods that are less racially and ethnically integrated. It’s the latest sign that residential segregation is closely related to polarized national politics.
The Week Observed is City Observatory’s weekly newsletter. Every Friday, we give you a quick review of the most important articles, blog posts, and scholarly research on American cities.
Our goal is to help you keep up with—and participate in—the ongoing debate about how to create prosperous, equitable, and livable cities, without having to wade through the hundreds of thousands of words produced on the subject every week by yourself.
If you have ideas for making The Week Observed better, we’d love to hear them! Let us know at jcortright@cityobservatory.org or on Twitter at @cityobs.
