What City Observatory this week
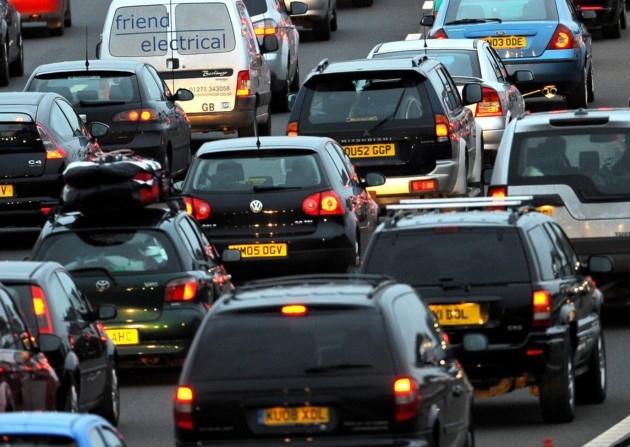
1. The fundamental global law of traffic congestion. For years, urbanists have stressed the concept of induced demand, based on the nearly universal observation that widening urban roadways simply leads to more traffic and recurring congestion. Repeated studies in the United States have confirmed that any increase in urban roadway capacity leads quickly to a proportionate increase in vehicle miles traveled. A new study extends this analysis to several hundred European cities, and find the same result: a one percent increase in road capacity tends to lead in short order to a one percent increase in vehicle miles traveled.

The study finds two factors that ameliorate this pernicious relationship: tolls and transit. Cities that charge a toll for the use of urban roadways have a dramatically lower level of induced demand, as do cities with extensive rail transit systems. In North America, in Japan, and in Europe, all these studies confirm that widening freeways to reduce congestion is inherently futile. We need to stop wasting money on this discredited and environmentally disastrous transportation policy.
2. A new framework for equity in economic development. We’re pleased to offer a guest commentary from Darrene Hackler, summarizing the results of a new report her firm has published on behalf of Pew Charitable Trusts. Equity is the big challenge facing community and local economic development. Everywhere, there are some people and some neighborhoods that are left out or left behind no matter how strong the economy. After surveying development efforts around the country, Hackler outlines three key steps that can guide effective and equitable economic development practices. Her “Determine-Design-Evaluate” framework addresses how to tap local knowledge and support and how to establish accountability for performance.
Must read
1. Alan Durning on the contradiction at the heart of US housing policy. Housing can’t be affordable and also be a great wealth-building investment. Sightline Institute’s Alan Durning echoes a theme we’ve long emphasized at City Observatory: there’s a fundamental and glaring contradiction between our two key housing policy aims. The subsidies we provide to home-ownership (skewed heavily to higher income households) and the restrictions on building more housing in high demand locations, help drive up home prices, which increases the wealth of incumbent homeowners, but simultaneously tends to make housing less affordable for everyone else. If we’re ever going to seriously work on making housing more affordable, we’ve got to confront local land use policies that restrict the supply of housing and drive up rents, and as Durning points out, we’ve also got to re-think the tax treatment of homes and mortgages. As Durning says:
. . . in an affordability-first housing economy, it’s a good bet that housing policy would stop subsidizing mortgage borrowing, property taxes, capital gains, ownership over renting, and the financialized mortgage industry.
While these tax breaks have been regarded as politically sacrosanct for decades, recent cuts to the mortgage interest deduction were included in the 2017 tax reform act, and Durning’s political analysis suggests that this may set the stage for further changes.
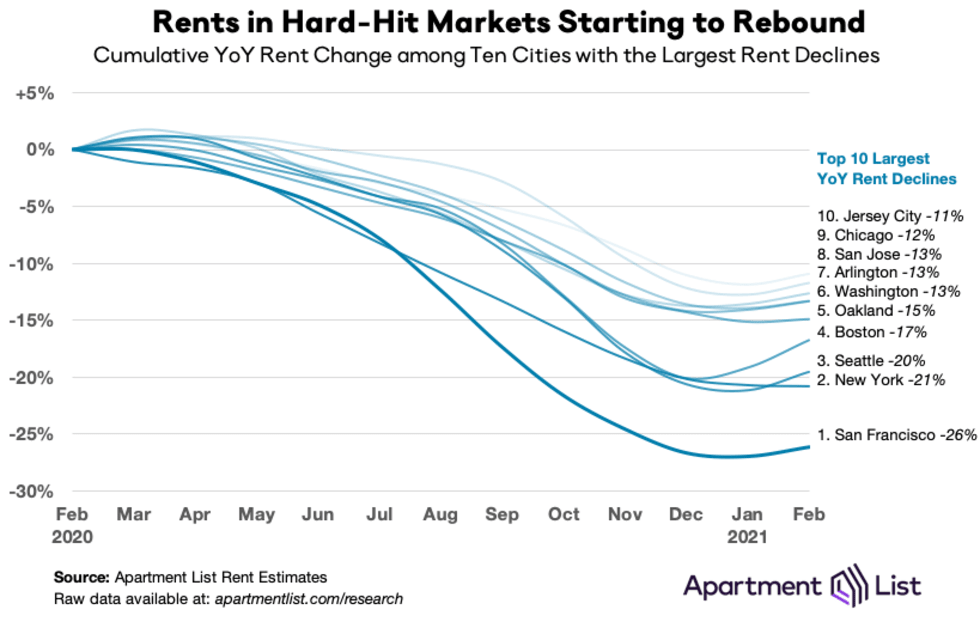
2. Rebounding rents in superstar cities? One of the most striking real estate market changes during the Covid-19 pandemic has been the sharp decline in apartment rents in some of the nation’s strongest urban centers. Rents have gone down in San Francisco, New York and other large cities, leading some to predict a prolonged decline. But Apartment List’s latest rent report suggests that markets in these cities are starting to turn around, as evidenced by upticks in rent levels in large cities at the end of 2020. Cities that saw significant declines in 2020 have seen modest increases in the first part of 2021: San Francisco rents are up 1.2 percent; Boston’s are up about 3 percent. Among the 10 cities with the largest year-over-year declines in 2020, only one, New York recorded declining rents in February, and that was a 0.1 percent decline.
As we’ve noted, housing has been subject to the “K-shape” effect, with higher income households driving up housing prices, while rents have fallen because job and income losses have been concentrated among lower income households. As the vaccine roll out continues, the Coronavirus recession fades, and the economy revives, it is likely that urban housing demand in these superstars will rebound, and rents will make up much of the ground given in 2020.
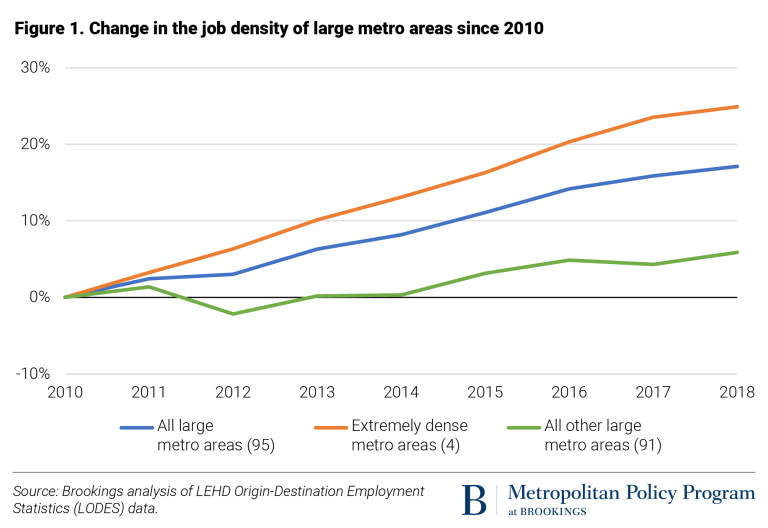
3. Increasing urban job density on the eve of the pandemic. The Brookings Institution has new estimates of the increasing density of jobs in the nation’s large metro areas. Their analysis, based on geographically detailed federal employment data through 2018 shows that, in what turned out to be the penultimate year of the last economic expansion, that employment grew increasingly dense in large cities. The biggest gains in density were recorded by “superstar” cities like San Francisco, New York and Seattle, but the pattern of increasing density held for most of the nation’s large metro areas.
There’s a pronounced industrial pattern to job densification; the biggest gains in job density are attributable to the clustering of information technology, professional service and financial jobs in a relative handful of large metro areas. There’s obviously been much speculation about how work-at-home practices may alter these patterns, but these data show that on the eve of the pandemic, there was a strong tendency for activity to concentrate in dense locations in just a few metro areas.
New Knowledge
Lived Segregation. Most of our understanding of the nature of urban residential segregation comes from Census data on housing, and looks at the extent to which people from different income or racial/ethnic groups live in different neighborhoods. That’s clearly important, but significantly, leaves out how much we mix as we move amoung neighborhoods and in and around cities on a daily basis (or at least the way we used to, in a pre-pandemic world). As with so many things, the mass of big data created by our electronic connections creates a new source of information about patterns of segregation. A new study from Brown University sociologist Jennifer Candipan and her colleagues uses geolocated twitter data to study patterns of movement in 50 large US cities.
In the News
KATU television news has a story reporting on the previously secret plans by the Oregon Department of Transportation to build a 10-lane wide freeway at Portland’s Rose Quarter. An Oregon DOT official concedes that the report shows that the agency has a “trust deficit.”


