What City Observatory this week
1. The thickness of the blue line. Robert Putnam popularized the notion of social capital in his book “Bowling Alone,” which he illustrated with a number of indicators of social interconnectedness, like membership in non-profit organizations and clubs, including bowling leagues. We have our own indices of “anti-social” capital, including the number of security guards per capita, suggesting that we feel like we (and our property) need more protection in some places than others. This week we’ve computed the number of “cops per capita” in different metro areas. Some cities have many more (Baltimore and New York are both in the top five) while others have far fewer police per 1,000 residents (Minneapolis, Seattle and Portland).
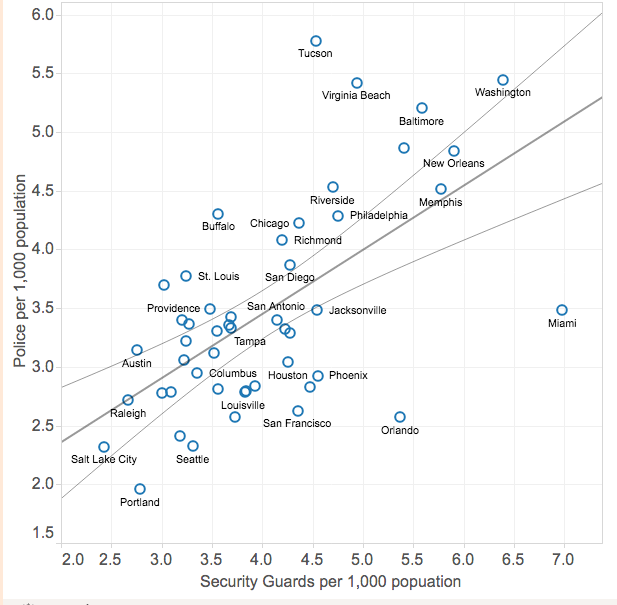 We have a complete ranking of cops per capita for the 50 largest metro areas, and also find that there’s a strong correlation between the number of security guards in a region (per capita) and the number of police, suggesting that some places really are more concerned about safety and security than others.
2. Are Uber & Lyft causing more traffic crashes? A year and half ago, a research paper suggested a correlation between the advent of ride hailing and increased crash rates. We questioned the first draft of the paper, and a new version has just come out, which repeats some of the original claims. We’re skeptical of the case for ride hailing causing more crashes; a better explanation is that the big decline in gas prices–which happened exactly as ride-hailing took off–triggered more driving, which led to an increase in crashes. That’s borne out by the fact that crashes increased even more in rural areas, where ride-hailing is rare. Finally the revised paper now has some data on when crashes occur: the increased rate of crashes occurs both at times when ride-hailing is common (Friday and Saturday nights) and when it is infrequent (weekdays), which suggests that ride-hailing is not the cause of increased crashes. We still regard the case as “not proven.”
Must read
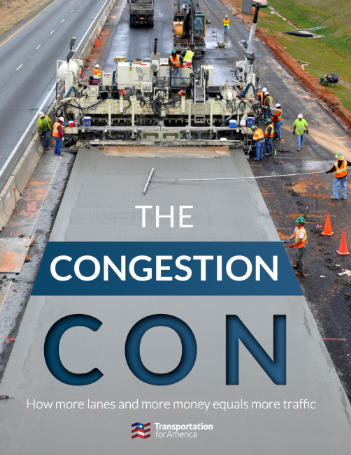
1. You can spell congestion without “con.” Transportation for America has a new report that comprehensively skewers the highway engineer’s conventional wisdom about roads and traffic. Entitled “The Congestion Con: How more lanes and more money equals more traffic,” the report shows that contrary to common belief, we’ve been building roads faster than population has been growing, but the only result is to generate additional car travel and even more congestion. Our obsession with moving cars faster is at the root of these problems, as the report explains:
Car speeds don’t necessarily tell us anything about whether or not the transportation network is succeeding at connecting as many people as possible to the things they need, as efficiently as possible. Yet a narrow emphasis on vehicle speed and delay underlies all of the regulations, procedures, and cultural norms behind transportation decisions, from the standards engineers use to design roads to the criteria states use to prioritize projects for funding. This leads us to widen freeways reflexively, almost on autopilot, perpetuating the cycle that produces yet more traffic.
The culprit, as City Observatory readers know well, is induced demand, which comes in two waves. First, in most urban settings, when new capacity becomes available, motorists rapidly change their travel patterns to occupy it–nature abhors a vaccum, and cars fill empty urban road space. Second, and more insidiously, over a period of years, the pattern of land uses becomes progressively more sprawled, as people move to homes further from jobs, and as businesses decentralize. The result: everyone’s trips become longer and the entire area becomes even more car-dependent. And recurring congestion is then used as an excuse to build even more roads, repeating the cycle at ever larger costs (and scales). It’s a con-game that has hollowed out our cities, lengthened our commutes and menaces our planet.
The Congestion Con is a remarkably comprehensive synthesis of the case against road widening. It shows that we’ve spent nearly half a trillion dollars on roads, and congestion has only become worse. It explains in detail why engineer’s crude mental models, and the obsession with car speeds predictably produces strategies that make the problem worse. It dismantles the pseudo-science behind traffic delay measurements that are often used to justify highway widening. It’s a must, must read.
2. Can hyper local zoning solve our housing shortage? Sightline Institute director Alan Durning is continuing his thoughtful and provocative series into the political of housing, trying to figure a way out of the corner that we’ve painted ourselves into by our dependence on local zoning. The latest installment considers a radical, and in some ways counter-intuitive solution: hyper-local zoning. The idea would be to let the landowners of a single block choose, but some supermajority requirement, to rezone themselves, for example, by increasing the height limit from three-stories to six. The idea is that if everyone on the block can benefit from higher values, that they would bear both the costs and the benefits of the action. It’s an interesting thought experiment in how we might change the incentives and rewards in redeveloping neighborhoods.
3. Confused and conflicting definitions of gentrification. Everyone knows what gentrification is, right? In concept, maybe. But when it comes time to mark down the status of particular neighborhoods, there’s widespread disagreement. Sidewalk Labs Eric Jaffe reports on a new paper comparing several different academic studies of gentrification. It finds that depending on the methodology one uses, you get very different pictures of the extent and pattern of gentrification. Here are maps of Boston, using the definitions of gentrification from four different studies; red hues indicate gentrifying areas. (All the maps are of Boston; the city names in the upper right hand corner of each panel identify the source of the methodology used to compute gentrification or gentrification risk).
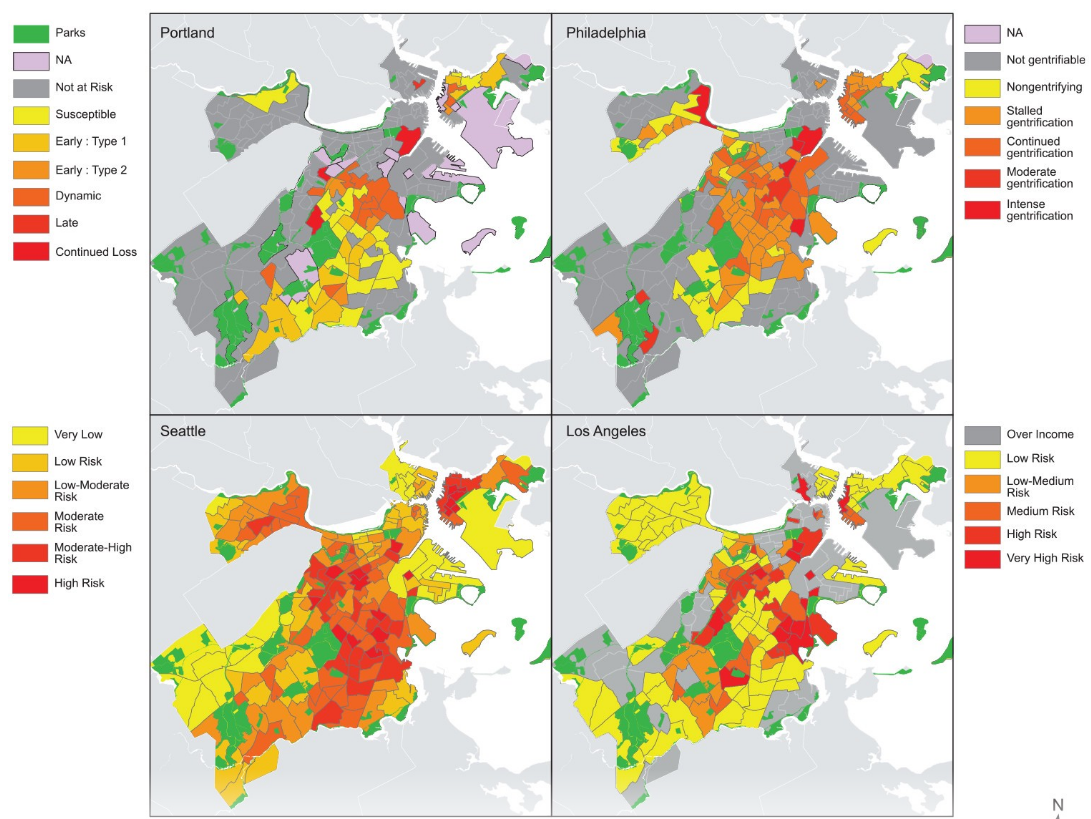
As Jaffe explains, the four different methods produce very different pictures:
There was very little overlap in terms of gentrification areas, with only seven common census tracts (out of 180 tracts in all of Boston) marked as gentrifying or “at risk” of gentrifying across the four map methods. There was also a very wide range of map coverage: the most conservative map method identified 25 at-risk tracts, while the most lenient identified 119.
This study complements a similar analysis published last year by Rachel Bogardus Drew of Enterprise Community Partners. If we can’t fully agree on what constitutes gentrification, and when, where, and whether its happening, its difficult to have a useful conversation, and perhaps impossible to reach a well-informed consensus about what to do. Gentrification may be one of those terms which has goes from obscurity to meaninglessness with no intervening period of clarity.
New Knowledge
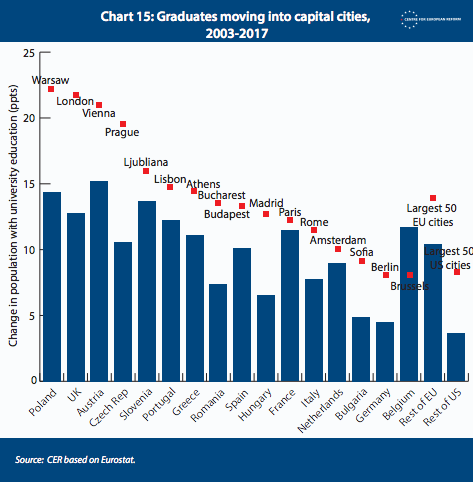
The most important question is: what makes a successful region? With a new regression analysis, we show that high productivity levels in regions are associated with three factors: they are part of – or geographically close to – successful cities; a larger proportion of their workforce are graduates; and their populations are younger. The association of a high share of graduates with productivity levels is also rising over time.