What are cities worth? More than big private companies, as it turns out: The value of housing in the nation’s 50 largest metropolitan areas ($22 trillion) is more than double the value of the stock of the nation’s 50 largest corporations ($8.8 trillion).
Market capitalization is a financial analysis term used to describe the current estimated total value of a private company based on its share price. It’s a good rough measure of what a company is worth, at least in the eyes of the market and investors. The market capitalization—or “market cap,” as it is commonly called—is computed as the current share price of a corporation multiplied by the total number of shares of stock outstanding. In theory, if you were to purchase every share of the company’s stock at today’s market price, you would own the entire company.

In roughly similar fashion, we can compute the market capitalization of cities—or at least of their housing stock. We start with Zillow’s estimate of the market value of owner-occupied housing in each of the nation’s largest metropolitan areas which is computed by estimating the current market price of each house in a metropolitan area, and sum that value over all of the owner occupied houses. We also estimate the value of rental housing. For rented units we use a commonly accepted technique of estimating current values based on the income generated from rent. (Americans paid about $535 billion in rent in 2015, according to data compiled by Zillow; we can use this data and some financial formula to estimate the value of rental housing. Details of this calculation are explained below.) Then we add together the value of all owner-occupied housing and the value of rental housing to compute the total market cap of housing in each metropolitan area in the US.
Together, the 50 largest publicly traded private corporations in the United States had a market capitalization of $8.8 trillion at the end of 2015. The total market value of housing in 2015 in the 50 largest metropolitan areas was $22 trillion. For reference, the gross domestic product—the total value of all goods and services produced in the US in 2015—was estimated at $18 trillion. It’s hard to find things measured in trillions of dollars, so we’ve juxtaposed GDP against the market cap of housing and businesses. Keep in mind that the GDP is a flow (trillions of dollars per year) while the value of corporations and housing is a stock (trillions of dollars in value at one-point in time).
The following table shows the market value of housing in each of the nation’s 50 largest metropolitan areas and the current market capitalization of the nation’s 50 largest publicly-traded private sector businesses.
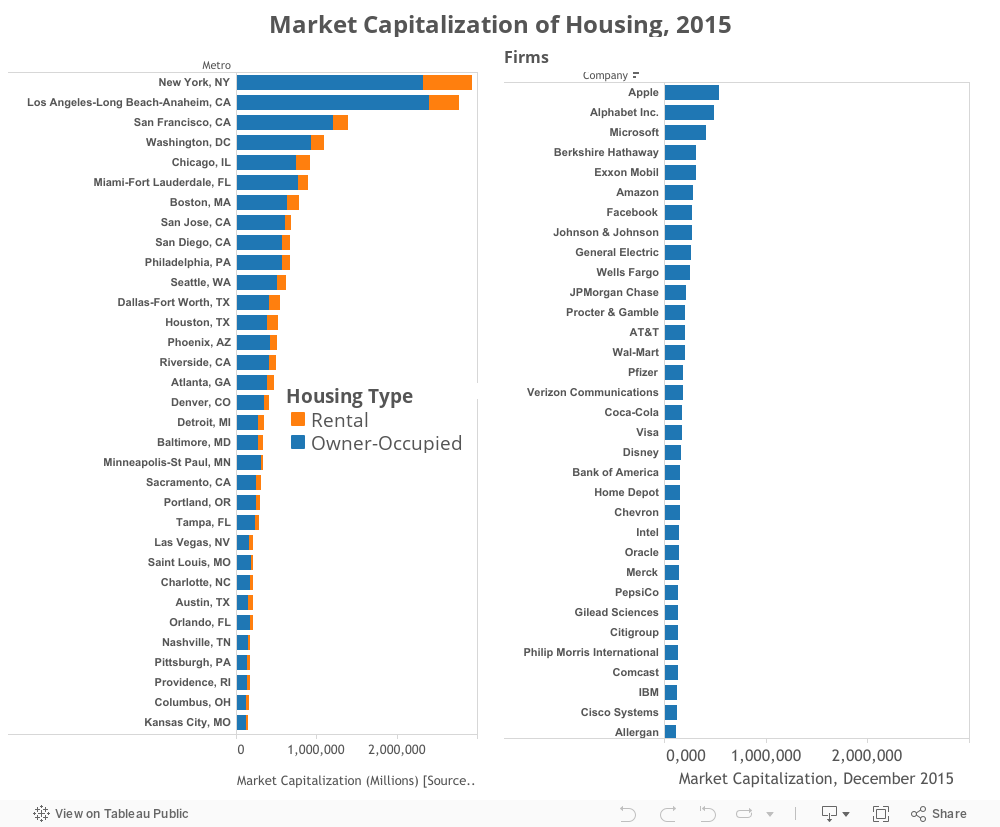
For metro areas, the value of housing is divided into two components (owner-occupied housing) shaded blue, and rental housing (shaded orange).
The most valuable company is Apple, with a market cap of $541 billion; the most valuable metro area is New York, where the market value of owner-occupied and rental housing is $2.9 trillion—more than five times higher. The current market value of Apple is about the same as the current market value of housing in Seattle (the twelfth most valuable market on our list).
Some modest-sized metros have housing that’s worth as much as the entire value of some very well-known corporations: IBM’s market cap ($128 billion) is about equal to Indianapolis housing ($138 billion). Orlando’s housing ($208 billion) is valued at more than 25 percent over all of Disney ($164 billion). Three Seattle-based companies (Microsoft, at $418 billion; Amazon, at $285 billion; and Starbucks, at $84 billion) are worth more combined ($787 billion) than all the housing in Seattle (about $617 billion).
The differences are smaller at the bottom end of our two league tables. The fiftieth largest firm, the oil services company Schlumberger, is worth about $15 billion more than the fiftieth most valuable metro housing market, Buffalo: $82 billion versus $67 billion.

It may seem strange to compare the market value of houses with companies, but this exercise tells us more than you might think. Just as the share price of a corporation reflects an investor’s expectations about the current health and future prospects of a company, the price of housing in a metropolitan area also reflects consumer and homeowner attitudes about the quality of life and economic prospects of that metropolitan area. So, for example, as the price of oil has fallen, weakening growth prospects in the oil patch, it’s quickly translated into less demand and weaker pricing for homes in Houston. Just as stock market investors purchase and value stocks based on the expectation of income (dividends) and capital gains from their ultimate sale, so too do homeowners (and landlords)—they count on the value of housing services provided by their home as well as possible future capital gains should it appreciate.
In fact, these two commodities—housing and stocks—are among the most commonly held sources of wealth in the United States. And while the financial characteristics of the two investments are dramatically different the underlying principle is the same, making market cap is a useful common denominator for assessing the approximate economic importance of each entity.
Each day, the financial press reports the market’s assessment of the value of individual firms, through their stock prices. But viewed through a similar lens, the housing markets of the nation’s cities are by this financial yardstick an even bigger component of the nation’s economy.
Technical Notes
How we computed the value of rental housing. In real estate, the value of rental housing is usually estimated using a “cap rate” capitalization rate, that approximates the rate of return on capital that real estate investors expect from leasing out apartments. To estimate the current market value of apartments, we take Zillow’s estimate of the total amount of rent paid in each market and deduct 35% to estimate “net operating income”—the amount the investor receives after paying maintenance, other operating expenses, and taxes—and then we divide this number by a capitalization (cap) rate of 6%. Both of these figures (net operating income and capitalization rates) are rough estimates—values vary across different times of properties, different markets, and over time with financial conditions (such as with the change in market interest rates).
Many thanks to Zillow’s Chief Economist Svenja Gudell and Aaron Terrazas for doing the hard work here of estimating property values and rental payments. For more keen insights on housing markets, follow their work at Zillow’s Real Estate and Rental Trends blog.
