The Interstate Bridge Replacement Project simply can’t tell the truth about current traffic levels or recent growth rates.
IBR reports inflate the current level of traffic on I-5 bridges by nearly 5,000 vehicles per day
IBR reports falsely claim that I-5 bridge traffic is growing twice as fast as ODOT’s own data show
IBR officials have exaggerated traffic levels and traffic growth rates to try to sell an over-sized, over-priced project.
It’s important to note that this is actual, recorded data, gathered by the Oregon Department of Transportation, and published on its traffic counting website. If IBR officials can’t be trusted to accurately report current and historical data, and when they instead choose to inaccurately inflate traffic counts and claim traffic is growing twice as fast as their own data show, it raises serious concerns about whether they can be trusted to accurately project future traffic levels–a process that is inherently more difficult, and critically, largely shrouded from public view.
The Interstate Bridge Replacement (IBR) project, a massive $7.5 billion undertaking to replace the I-5 bridges over the Columbia River, is built on a foundation of questionable traffic projections. As we’ve seen time and again with megaprojects, errors in traffic modeling can lead to overstated needs, financial boondoggles, and understated environmental impacts. The IBR project seems to be following this well-worn path.
The importance of getting traffic numbers right
Traffic counts and modeling aren’t just a technical exercise—they’re the cornerstone of the entire project. Traffic levels define the need, justify the size, evaluate alternatives, and determine financing. Understanding present and future traffic levels are also crucial for assessing environmental impacts. As the Federal Highway Administration notes, “travel and land use forecasting is integral to a wide array of corridor and NEPA impact assessments and analyses.” In other words, if the traffic forecasts are wrong, the entire environmental impact assessment is compromised. Current traffic data and recent traffic growth trends need to be accurate in order to create accurate forecasts of future activity–and IBR officials have exaggerated traffic levels and traffic growth to sell their project.
IBR can’t even report current traffic count data accurately
One would think that counting cars on a bridge would be straightforward. Yet, the IBR project can’t seem to agree with itself—or with the highway department’s own traffic recorders—on how many vehicles cross the I-5 bridge daily.
The IBR has variously claimed 142,400 or 143,400 vehicles per average weekday in 2019. Meanwhile, ODOT’s automatic traffic recorder reports 138,780 per day for the same year. That’s a discrepancy of up to 4,620 vehicles per day—not exactly a rounding error when you’re justifying a multi-billion dollar project.
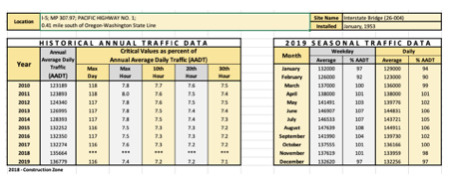
Average weekday traffic for each month in 2019 is shown in second column of the right-hand panel of this table, downloaded from ODOT’s own traffic reporting website. The average weekday traffic for the twelve months January through December 2019 is 138,780 vehicles per weekday.
This isn’t the first time ODOT and WSDOT have played fast and loose with traffic numbers. During the Columbia River Crossing project from 2008 to 2011, they overstated 2005 traffic levels —a fact they were forced to admit in federal court.
IBR exaggerates recent traffic growth
Not only does the IBR technical work get recent traffic levels wrong, it also grossly overstates the rate of growth in traffic across the I-5 bridge. The study focuses on the four-years prior to the pandemic—2015 to 2019. The IBR’s “Level 2” traffic study claims traffic on the I-5 bridge increased by 1.1 percent annually between 2015 and 2019. However, ODOT’s own official data shows the actual growth rate was only 0.55%—half of what the IBR claims. This isn’t just a minor discrepancy; it’s a fundamental misrepresentation of traffic trends that could significantly impact the project’s justification and design.
The inaccurate traffic count data leads the Stantec Level 2 study to overstate the recent rate of growth across the I-5 bridges. The Level 2 study claims that between 2015 and 2019, traffic increased by 1.1 percent per year.
The average weekday river crossings along the I-5 and I-205 Bridges since 2015 are presented in Figure 2-6. Between 2015 and 2019, the traffic on the I-5 Interstate Bridge increased at an annual rate of approximately 1.1% . . .
Stantec, Level 2 Report, page 2-9
According to the average weekday traffic data reported on the ODOT automatic data recorder website, the actual rate of increase was only half as much—0.5 percent. We examined actual data reported on ODOT’s website (https://www.oregon.gov/odot/data/pages/traffic-counting.aspx) for the Automated Traffic Recorder for the I-5 Interstate Bridge. In 2015, average weekday traffic was 135,696 vehicles per day. In 2019, average weekday traffic was 138,700 vehicles per day. This represents an annual rate of increase of 0.55 percent per year, half the rate claimed in the Stantec Report.
The difference in growth rates is a crucial point that highlights potential issues with the IBR project’s traffic projections. The failure to accurately report recent traffic growth has important implications and consequences:
-
- The IBR’s claimed growth rate is twice the actual rate based on official ODOT data.
- This discrepancy is significant because growth rates are often used to project future traffic volumes, which in turn justify the need for and scale of transportation projects.
- Overestimating the growth rate leads to inflated projections of future traffic.
- This could result in overbuilding infrastructure, wasting public resources, and potentially creating unnecessary environmental impacts.
- It might also affect the financial viability of the project, as toll revenue projections are based on these inflated growth rates.
This difference in growth rates is not just a minor statistical quibble. It represents a fundamental issue with how the IBR project is analyzing and presenting traffic data. If the project is consistently overestimating traffic growth, it could lead to a significantly oversized and more expensive project than what is actually needed. This highlights the need for transparent, accurate, and verifiable traffic data and projections in planning such a massive infrastructure project.
With a price tag of up to $7.5 billion, the IBR would be the most expensive transportation project in the region’s history. It’s crucial that decisions about such a massive investment are based on accurate, consistent data. Yet, what we’re seeing is a pattern of inflated numbers, inconsistent baselines, and opaque methodologies. The discrepancies and inconsistencies in the IBR’s traffic modeling raise serious questions about the project’s foundation. If we can’t trust the basic traffic counts, how can we trust the complex projections built upon them?