The Covid Corridor: The pandemic is worst in the NE Corridor
By Joe Cortright
The incidence of reported Covid-19 cases, and their daily growth is higher in the metros of NE corridor than the rest of the country.
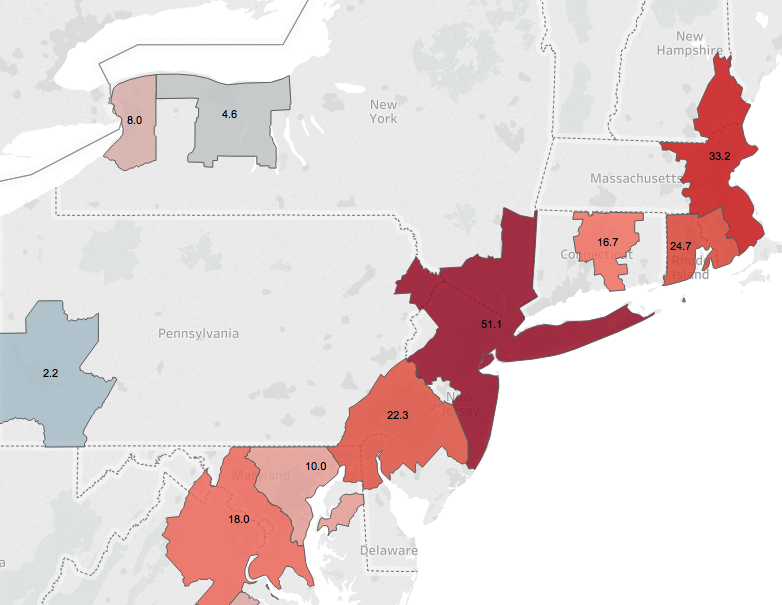
The Northeast Corridor has all four of the cities with the highest rate of newly reported cases.
New Cases per 100,000 population, April 17
A new metric: New cases per 100,000 population
For the past several weeks, we’ve been tracking the cumulative number of reported Covid-19 cases per 100,000 population in each of the nation’s 53 largest metropolitan areas. Today, we tweak that measure just a bit to focus on the number of cases reported in the past day in each of these metro areas. This daily increase measure signals what’s happening right now. It can be a bit noisier due to day-to-day variations in reporting lags across metro areas, but the cumulative measure is now increasingly telling us about past reported cases, rather than what’s going on right now.
Here’s a bar chart showing the number of new cases per 100,000 on April 17 for each metro area with a million or more population. New York had about 50 new cases per 100,000 population, about ten times the level reported in the median large metropolitan area (5 new cases). (Northeast Corridor metros are highlighted in red).
What’s striking about this chart is that all four of the metros with the highest number of new cases–New York, Boston, Providence and Philadelphia–are all in the Northeast Corridor. The corridor also accounts for six of the top eight metros on this measure (adding Hartford and Washington). Each of these metro areas is reporting new cases per capita at a rate 2-3 times higher (and in Boston’s case, 6 times higher) than the median large metro area in the US.
In contrast, some cities that had experienced an earlier surge in cases have seen a significant reduction in reported new cases. Seattle had just 3.7 new cases per 100,000 on April 17, well below the median for large metro areas.
These data signal a wide disparity among metropolitan areas in the current spread of the Corona virus. Some metropolitan areas are seeing very low levels of growth (seven metro areas had 2 or fewer new reported cases per 100,000 on April 17). Meanwhile the pandemic seems much more pernicious and continues to spread at a much higher rate in other parts of the country. While the New York metropolitan area has (appropriately) drawn attention as the epicenter of the pandemic, it actually appears to be a problem that disproportionately affects the entire NE Corridor, from Washington to Boston.
The Covid Corridor: The pandemic is worst in the NE Corridor
The incidence of reported Covid-19 cases, and their daily growth is higher in the metros of NE corridor than the rest of the country.
The Northeast Corridor has all four of the cities with the highest rate of newly reported cases.
New Cases per 100,000 population, April 17
A new metric: New cases per 100,000 population
For the past several weeks, we’ve been tracking the cumulative number of reported Covid-19 cases per 100,000 population in each of the nation’s 53 largest metropolitan areas. Today, we tweak that measure just a bit to focus on the number of cases reported in the past day in each of these metro areas. This daily increase measure signals what’s happening right now. It can be a bit noisier due to day-to-day variations in reporting lags across metro areas, but the cumulative measure is now increasingly telling us about past reported cases, rather than what’s going on right now.
Here’s a bar chart showing the number of new cases per 100,000 on April 17 for each metro area with a million or more population. New York had about 50 new cases per 100,000 population, about ten times the level reported in the median large metropolitan area (5 new cases). (Northeast Corridor metros are highlighted in red).
What’s striking about this chart is that all four of the metros with the highest number of new cases–New York, Boston, Providence and Philadelphia–are all in the Northeast Corridor. The corridor also accounts for six of the top eight metros on this measure (adding Hartford and Washington). Each of these metro areas is reporting new cases per capita at a rate 2-3 times higher (and in Boston’s case, 6 times higher) than the median large metro area in the US.
In contrast, some cities that had experienced an earlier surge in cases have seen a significant reduction in reported new cases. Seattle had just 3.7 new cases per 100,000 on April 17, well below the median for large metro areas.
These data signal a wide disparity among metropolitan areas in the current spread of the Corona virus. Some metropolitan areas are seeing very low levels of growth (seven metro areas had 2 or fewer new reported cases per 100,000 on April 17). Meanwhile the pandemic seems much more pernicious and continues to spread at a much higher rate in other parts of the country. While the New York metropolitan area has (appropriately) drawn attention as the epicenter of the pandemic, it actually appears to be a problem that disproportionately affects the entire NE Corridor, from Washington to Boston.
Related Commentary