A picture of metropolitan growth: Sprawl then, stagnation now.
We’re in awe of Issi Romem’s prodigious data skills. Romem is the economist and big data guru BuildZoom, the web-based marketplace for construction professionals. His latest report is a multi-decade look at the growth (and non-growth) of housing at the neighborhood level in the nation’s largest metro areas. What Romem has done is gathered data from 1940 through 2016 on the number of housing units built in each census tract in large metro areas. Then, for each of a series of multi-decade periods (1940 to 1960, 1960 to 1980, 1980 to 2000 and 2000 to 2016), he’s classified those census tracts depending on the number and kind of housing units built in that tract. His coding system shows which neighborhoods built primarily single-family homes, which built smaller multi-family buildings, and which built large (50-unit plus) multi-family buildings. In addition, he also flags census tracts where little or no new housing was built. (It’s this latter category that’s a real eye-opener, as we’ll see shortly.)
The new report is called “America’s New Metropolitan Landscape: Pockets Of Dense Construction In A Dormant Suburban Interior.” That’s an accurate title, but the we think a shorter, catchier alternative might be “Sprawl, Stagnation and NIMBYism.” Let’s explore some of the highlights of this report.
Instinctively, we know that the footprint of metro America has expanded greatly in the automobile era. This report paints a vivid picture of that process. The secret sauce in this data exercise is animation: Romem has crafted maps that show how, decade after decade, development proceeds in each of the nation’s largest metro areas. Here, for example, is the Los Angeles map:
There are similar maps of each of the nation’s largest metro areas on the BuildZoom website. Helpfully, you can also download metro summary data as well. A note on the color coding: Red and orange areas are those census tracts where most new housing was in the form of multi-family units. Light blue is tracts where single family housing predominates. And dark blue are those tracts that had no significant housing construction during the time period in question, using a definition of a net increase of less than one-tenth of a housing unit per acre per decade. There are maps for all the nation’s largest metro areas, and they show similar patterns. During the two earlier periods, (1940 to 1960, and 1960 to 1980) metro areas are expanding, hugely you might say. The expansion continues after 1980 in most metros, though at a generally slower pace. Since 2000, outward expansion has become more muted. The really big change over this nearly eight decade period is the increase in the area in nearly all metros that has seen little or no new housing construction. This widespread stagnation of residential development is really the signal finding of this report.
Two suspects: NIMBYISM and economic stagnation
There are two different forces at work behind the dark blue areas where little or no housing is being built. In some cases, its the lack of supply: there’s little vacant land in a neighborhood, and zoning restrictions make it costly or impossible to build new, denser housing. In tracts where most of the land is designated for single family homes, once a home has been built, it’s not possible to replace it with apartments, and there may be little reason to tear down one single-family home and replace it with another. In large parts of Los Angeles, NIMBY land use restrictions explain the dark blue. Between 1960 and 1990, according to Greg Morrow of UCLA, Los Angeles downzoned most of its residential areas, lowering its population capacity by 60 percent from 10 million to about 4 million.
The other competing explanation is a lack of demand. Some struggling industrial cities (Cleveland, Detroit) also have large swaths of dark blue neighborhoods, but not because of NIMBY restrictions. Instead, the problem in these places is declining demand for housing. Little or no new housing is being built because so few people live there (and want to live there) and prices are low.
For both of these reasons (a limited supply in growing metro areas; limited demand in shrinking ones), a bigger share of the US metro area consists of these dark blue neighborhoods where little development is happening. Over time, more and more of US metropolitan areas consist of neighborhoods (Census Tracts) where little if any new housing is being built. In our Los Angeles example, the area with little or no new housing construction increased from less than one percent between 1940 and 1960, to 5.8 percent between 1960 and 1980, to 24.1 percent from 1980 to 2000, and fully 52.3 percent in the most recent period, through 2016.
Which cities have the most land area with little or no new housing?
Let’s focus in on the big increase in “no new housing” neighborhoods in the past 16 years. There’s considerable variation across metropolitan areas in the amount of land that’s experienced little or no residential development since 2000. The chart below shows Romem’s estimates of the percentage of the land area in developed census tracts in each of the nation’s largest metropolitan areas. (In contrast to the data we usually present at City Observatory, Romem’s work uses “consolidated statistical areas” to define most large metropolitan areas. These areas are slightly larger that the metropolitan areas we routinely use; they generally include adjacent metropolitan and micropolitan areas just beyond metro area boundaries).
The areas with the highest levels of land with little new housing construction include Hartford, Buffalo and Boston. In these cities, more than three-fourths of all developed neighborhoods have seen little or no new housing construction since 2000. Unsurprisingly fast-growing and sprawling sunbelt metros, like Las Vegas and Austin have the smallest amount of land area that not seen new residential development in the past couple of decades. In these places, few neighborhoods are untouched by development; in Austin for example, fewer than a fifth of all neighborhoods are classified has having had little or no new housing built.
One of the biggest factors driving housing growth at the metropolitan level is overall population growth. Fast growing metros have a higher demand for housing, and are both adding more housing at the fringe, and seeing more infill housing in close in neighborhoods. We’ve plotted each metro area’s 2000 to 2016 population growth against the percentage of land area that experienced little or no housing construction. The vertical axis of this chart shows the percentage of each metro areas land that had little or no housing development and the horizontal axis shows the percentage growth in population. Each dot corresponds to a metropolitan area (mouse-over dots to see metro area names and data values). As expected, there’s a strong negative correlation, places with less growth had larger shares of the metro area unaffected by development; fast growing areas had a proportionately smaller area untouched by residential construction.
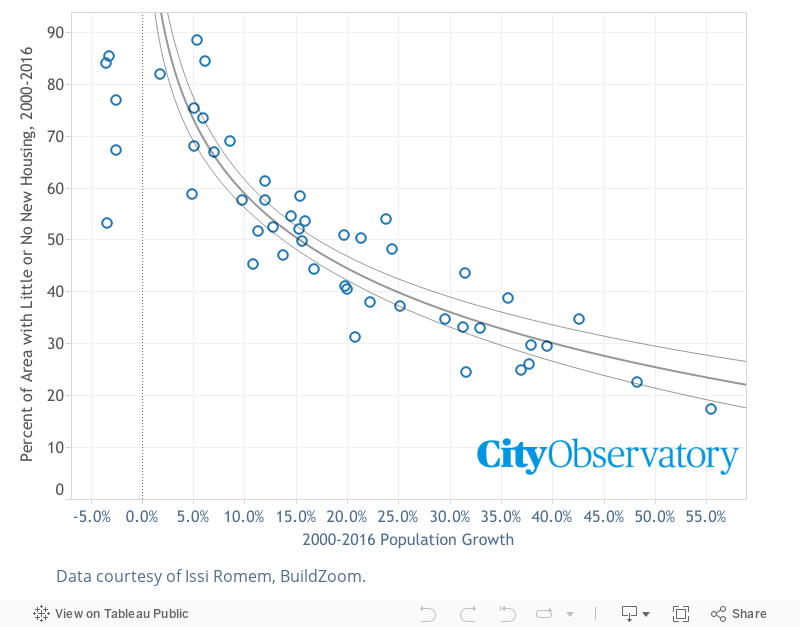
The regression line in this chart shows the typical relationship between metropolitan growth and areas with limited or no new housing construction. You can think of communities that are above the regression line as being communities where even less area was touched by development, and communities below the line as ones where a larger portion of the area was affected by development, in both cases, controlling for the level of growth in the metropolitan area. In a sense, the deviation from this line reflects in part the stringency of local land use controls in the metropolitan area. A likely reason that some areas are above the line is that local zoning or NIMBYISM more greatly limits the extent of new residential development. Conversely, areas that are below the line seem to have land use regimes that allow more widespread development than is typical. These data show that the Portland area, famous for its urban growth boundary, has a much higher fraction of neighborhoods affected by residential development than is typical for a metro growing as rapidly as it is. Portland grew by 21 percent between 2000 and 2016, but only 31 percent of its area was classified as having little or no new housing development, which is about 10 percentage points less than one would expect given the typical relationship between growth and area affected by housing. Washington, DC, which grew at about the same rate as Portland, had more than half of its land area unaffected by development.
A very useful resource
BuildZoom’s mapping of long term development trends in US metro areas is a huge resource for planners, and those looking to get a handle on sprawl and housing development. You should definitely take a look at your metro area to see how its changed, and compare its development patterns with those of other metro areas. The data analysis here provides a rich picture of the extent and pace of urban expansion, especially during the 1960s and 1970s, and, in sharp contrast, the relative paucity of change in the housing stock in most neighborhoods since then. As we think about how America might change in the decades ahead, this is indispensable framing for understanding the path that’s brought us to where we are today.
