The case for the $7.5 billion Interstate Bridge Replacement Project is based on traffic projections from Metro’s “Kate” travel demand model. But there’s a huge problem: Kate doesn’t accurately model even current levels of traffic.
The model has a high overall error factor, and importantly, consistently over-estimates traffic on the existing I-5 bridges.
Metro has prepared a validation report—not published on its website—showing the Kate model assigns vastly more traffic to I-5 than actually use the bridge.
The model essentially adds 20,000 non-existent cars and trucks to I-5 each day in 2019—more than 6 million vehicles annually.
The Metro forecast prepared for the Columbia River Crossing showed the same problems, over-predicting traffic growth by a factor of four between 2005 and 2019. The model claimed growth would be 1.3 percent per year; the reality was 0.3 percent growth.
Ironically, Oregon and Washington have paid private sector firms to develop much more accurate models of regional traffic–but they’ve excluded these more realistic models from the IBR environmental impact statement–in likely violation of the National Environmental Policy Act.
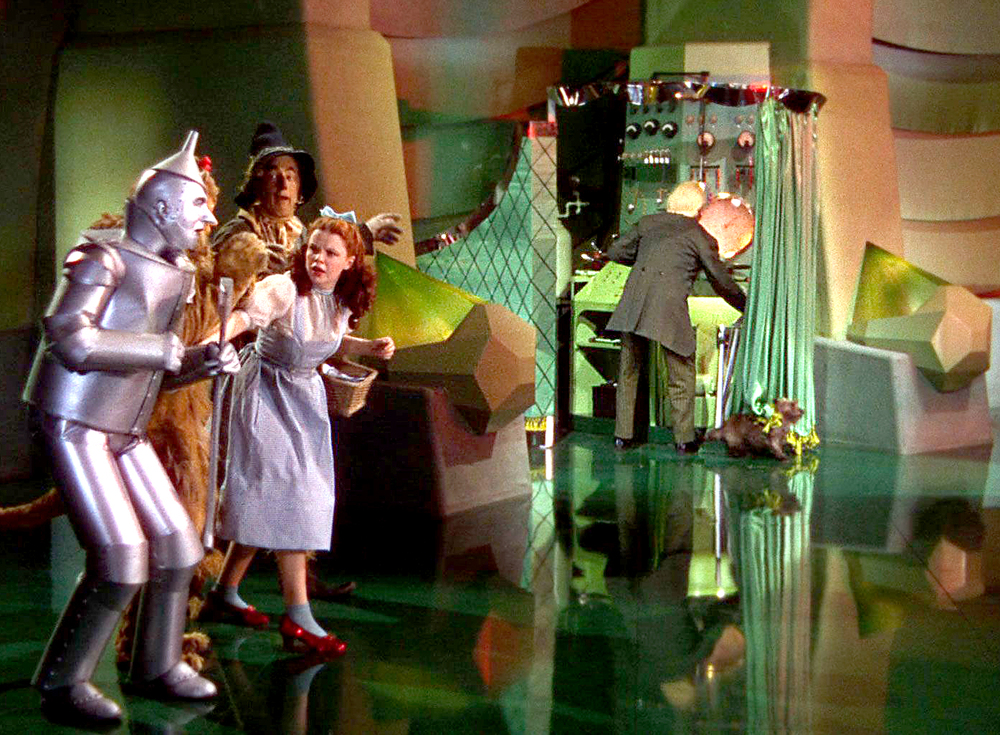
An indispensable part of the sales pitch for wider highways is the seemingly precise and statistically intimidating results of computerized travel demand models. These models purport to predict, with great certainty, future traffic levels decades from now. In the hands of state highway departments, such models are routinely used to “prove” that traffic is increasing inexorably, that if nothing is done, congestion will become intolerable, and paradoxically, that wider roads won’t actually stimulate any more traffic. In reality, the models are an intimidating fiction, like the Wizard of Oz’s flaming avatar, designed to frighten and cajole. And just as in Oz, the real manipulation is being done by the man behind the curtain.
In the high-stakes game of justifying multi-billion dollar infrastructure projects, traffic forecasts are a computer-driven trump card for project proponents. Traffic modelers use complex and impenetrable computer models to generate seemingly precise estimates of future traffic levels, which they use as a cudgel to push for over-sized highways. But a close look at the models shows that they are biased and wrong, and systematically over-state traffic, not just in the future by now. Metro’s much-hyped “Kate” regional travel demand model dramatically over-estimates current levels of I-5 traffic, as well as projecting physically impossible growth in future years. The Interstate Bridge Replacement (IBR) project offers a textbook case of modeling gone awry, with potentially far-reaching consequences for taxpayers and the environment.
Kate doesn’t accurate describe the present, and can’t predict the future
At the heart of the IBR’s justifications lies Metro’s regional travel demand model–dubbed “Kate.” But our analysis reveals that Kate has a penchant for fiction especially when it comes to I-5 bridge traffic.
Poor Calibration. The test of a model is whether it can accurately reflect reality. For transportation models, professionals talk about “calibration” whether the predictions of the model match actual real world traffic counts. Metro’s Kate Travel Demand model has a high overall error factor. We measure overall modeling error using a statistical metric called “Room Mean Squared Error”—RMSE—which tells how far off the overall model is in matching actual data. Metro’s Kate model has a RMSE of 14.5 percent, meaning that on average, the model gets current traffic levels right within only about a 15 percent margin. Keep in mind that calibration asks whether a model can accurately predict current traffic levels. Importantly, the 14.5 percent RMSE for the Metro model is much higher than for other Portland area transportation modeling efforts. Here’s a table showing the RMSE for several other models.
| Comparison of Travel Demand Model Validation | ||||
| Model (Year) | Calibration Year | Scope | Metric | Error (RMSE) |
| Metro/Kate (2017) | 2015 | 32 Regional Cutlines | AWDT | 14.5% |
| Stantec/IBR Level 2 (2023) | 2015 | 32 Regional Cutlines | AWDT | 2.5% |
| CDM Smith/CRC IGA (2013) | 2010 | 11 Regional Cutlines | Hourly | 2.5% |
| CDM Smith/CRC IGA (2013) | 2010 | I5, I205 Bridges | Hourly | 0.8% |
The other models shown here, which cover the same geography as the Kate model, have RMSE error factors of less than one percent to two-and-one-half percent. That means the error factor in the Kate model is six to fifteen times larger than for these other models. Metro’s Kate model is demonstrably less accurate and less well-calibrated than other models. Yet IBR officials have chosen to rely on Kate in their environmental analysis.
Overestimation: As bad as it is in predicting overall traffic levels in the region, Kate is demonstrably worse in predicting traffic on the bridges across the Columbia River. Kate consistently overestimates traffic on the I-5 bridge, by almost 20 percent. In 2019, for instance, the Kate model says there were 164,500 average weekday trips across the I-5 bridge. The reality? A much more modest 138,530, according to ODOT’s own traffic recorders.
Estimates of Calendar year 2019, Average Weekday Traffic, I-5 Bridge
| Source | Estimate | Error |
| ODOT, Traffic Count data | 138,530 | 0 |
| Metro, Kate Travel Demand Model | 164,500 | +18.7% |
This fact is buried in a technical report—not published on Metro’s website—which shows that the Kate model dramatically overstates the current level of traffic. This shows the model is poorly calibrated and can’t even reflect current reality—much less accurately predict the future.
Exaggerated Growth Rates: Kate is the just the latest version of Metro’s traffic-inflating models. Kate’s predecessor “Ivan” predicted that if the Columbia River Crossing project (the predecessor to IBR) weren’t built (spoiler—it wasn’t) that I-5 bridge traffic would grow at a rapid 1.3% annual growth rate from 2005 to 2030. The actual growth rate from 2005 to 2019? A paltry 0.3% per year. Metro’s travel model predicts four times as much traffic growth as actually occurred: That’s not just missing the mark; it’s not even in the same ballpark. The current Kate model also wildly over-estimates future traffic growth.
Millions of Phantom Cars and Trucks: The discrepancy between Kate’s predictions and reality isn’t just a statistical anomaly. It translates to over 20,000 “phantom” vehicles per day that exist only in the model’s imagination. That’s more than 6 million non-existent trips per year.
A better calibrated model produced dramatically different results
While IBR officials take pains to paint the “Kate” travel demand model as an objective, scientific mechanical predictor, its actually anything but. The complex system of equations that compose the model depend on settings and inputs chosen by modelers. In this respect, its not unlike an Excel spreadsheet: If you enter different numbers in one cell, you get different results elsewhere. Other modelers, starting with the same Metro Regional Travel Demand model, plugged in different parameters, and produced a vastly more accurate forecast of I-5 traffic growth. In 2013, Oregon and Washington DOTs paid modeler CDM Smith model, commissioned for an investment-grade analysis of the Columbia River Crossing, tells a different story. After recalibrating Metro’s model, CDM Smith’s predictions aligned much more closely with reality, forecasting a 0.3% annual growth rate that matches observed data. More recently, IBR hired Stantec to produce a version of the model to estimate toll revenues; it too is vastly more accurate than the Metro model. (See Table above). The big question for public officials–and ultimately the courts–is why are ODOT and WSDOT using a model with a vastly larger error factor to plan a multi-billion dollar project, instead of more accurate models Oregon and Washington have already paid for?
Biased traffic projections to justify a bloated project
Why does this matter? Because these inflated numbers are being used to justify a massive, expensive project. The supposed reason that $7.5 billion in wider highway lanes and rebuilt interchanges are needed is to accommodate phantom traffic that exists only in the model. More realistic traffic projections would enable a much cheaper, less environmentally devastating project. By overstating current traffic and future growth, the IBR project is:
- Exaggerating the need for expanded capacity
- Potentially overbuilding infrastructure at taxpayer expense
- Understating the environmental impacts of the “build” alternative by comparing it to an inflated “no-build” scenario
Concealing Kate’s inaccuracies
Metro and IBR staff are aware of the problems with the “Kate” model, but have largely buried information about its bias and inaccuracy in other technical documents. Metro produced a “validation” report for Kate in 2017, but does not publish this crucial document on its website. For those who want to see the report, we’ve attached a copy we obtained via public records request below. And despite these glaring issues, Metro and the IBR continue to use the poorly calibrated Kate model “for planning purposes.” It’s hard not to conclude that they prefer these higher forecasts because they justify a larger project and conceal the travel-inducing effects of expanded capacity.
When questioned about these discrepancies, one can almost hear the IBR planners channeling the Great and Powerful Oz: “Pay no attention to that man behind the curtain!” But unlike in the movie, the wizard behind IBR’s curtain isn’t a harmless humbug. Instead, it’s a flawed modeling process with the potential to waste billions in taxpayer dollars and reshape our region’s transportation landscape based on fantasy rather than fact.
Time for a reality check
The IBR project is betting billions of taxpayer dollars on traffic forecasts that don’t stand up to scrutiny. It’s time for a reality check. We need:
- An independent audit of the traffic modeling proces
- Transparent reporting of model inputs, assumptions, and output
- A reevaluation of the project’s scope based on realistic traffic projections
Until then, the IBR project risks building a bridge to nowhere – or more accurately, a bridge to a future that exists only in the realm of faulty models and phantom traffic. It’s time to pull back the curtain and expose this “wizard” for what it really is: a collection of flawed assumptions and inflated projections masquerading as a scientific process.
Appendix: 2017 Kate Validation Report
Here is a copy of Metro’s “2017 Kate v1.0 Trip-Based Demand Model Validation Report for Base Year 2015.” This report does not appear on the Metro website (oregonmetro.gov). The report is still marked “DRAFT” years later, and no “final” version has ever been released.
[pdf-embedder url=”https://cityobservatory.org/wp-content/uploads/2024/10/Kate_Validation_Report_August2017.pdf”]