Reducing segregation does seem to result in much more social interaction, as intermarriage patterns demonstrate
Change doesn’t happen fast, but it happens more frequently and more quickly when we have integrated communities
One of the regular critiques of urban integration is that while we might get people from different backgrounds to live in the same neighborhood, that doesn’t necessarily mean that they interact socially on a regular basis. Earlier, for example, we took a close and critical look at Derek Hyra’s claim that mixed-income, mixed-race communities fell short of improving the lot of the disadvantaged because of the persistence of what he called “micro-segregation.” Even though they might live in the same neighborhood, people from these different groups still associated primarily with other people with similar backgrounds. We thought there were a lot of problems with this argument (most notably, that the data show a strong positive impact of mixed income neighborhoods for the lifetime prospects of poor kids, notwithstanding micro-segregation).

While we have some useful measures of residential segregation (compiled from Census data), its harder to come by data that illustrate the extent to which people from different racial and ethnic groups spend time associating with each other. A new report from the Pew Charitable Trusts sheds an interesting light on the most personal inter-group interaction: racial/ethnic intermarriage. It has been half a century since the Supreme Court struck down state bans on interracial marriage in Loving v. Virginia. The data show that intermarriage has increased five-fold from 3 percent of newlyweds in the 1960s to about 17 percent today. The trend has been propelled in part by the nation’s growing diversity, and also due to changing attitudes about intermarriage. Pew used data from the most recent American Community Survey to calculate the rate of intermarriage between people from different racial and ethnic groups in each of the nation’s metropolitan areas. Pew’s ranking shows that intermarriage is much more common in some metros than in others. In the West, intermarriage rates tend to be much higher, for example, than they are in the South. (Urban areas have higher intermarriage rates than rural ones, as well).
In part, these differences reflect the regional variation in attitudes toward intermarriage. But the opportunities for intermarriage also hinge directly on the racial and ethnic composition of a metropolitan area. More diverse areas tend to have greater opportunity for intermarriage than more homogenous ones. The University of North Carolina’s Philip Cohen took the Pew data and compared it to the racial and ethnic diversity of each metropolitan area, and computed an adjusted intermarriage score for each metro area. Given an area’s racial and ethnic composition, how much intermarriage did it exhibit. This ranking gives us a much clearer idea of where intermarriage is common and apparently socially acceptable, and where different racial and ethnic groups are, in practice, mixing. (See Cohen’s blog for full details).
We thought we’d use these data to look at the correlation between metropolitan segregation and intermarriage. Given an area’s racial and ethnic diversity, are people from different groups more (or less) likely to intermarry depending on the segregation of the metro area? The following chart shows the white-non-white segregation index for each metro area (on the horizontal axis) compared to the demographically adjusted intermarriage rate (from Philip Cohen). Higher values on the white-non-white segregation index correspond to higher levels of segregation; the index shows the percent of persons in a region who would have to move to a different census tract so that each tract would have the same white/non-white balance as the metropolitan area of which it was a part. (We extracted the segregation index data from an excellent commentary on housing diversity by Trulia’s Cheryl Young.)
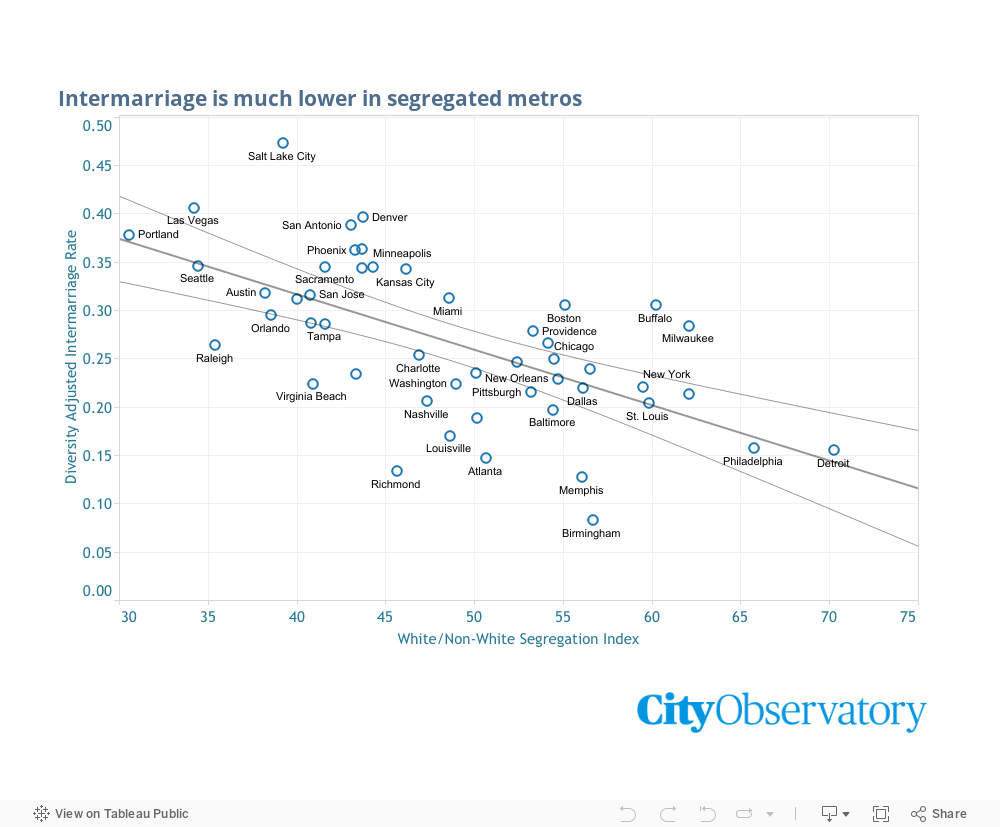
These data show a strong negative correlation between segregation and intermarriage. People who live in highly segregated metropolitan areas are much less likely to marry someone from a different racial and ethnic group than those who live in the least segregated areas. Compare, for example, Philadelphia and Austin. Philadelphia is one of the most segregated large cities (dissimilarity index .65); Austin one of the least segregated (.38). Philadelphia’s intermarriage rate is about half that of Austin’s (.16 vs. .32).
Its possible to imagine that the correlation between segregation and intermarriage reflects both personal opportunities and social values. In less segregated communities, people from different racial and ethnic groups are–by definition–more likely to come into close proximity to one another. But segregation may also reflect (or influence) broader social attitudes about whether interracial relationships are tolerated. These data are very consistent with the notion that greater physical integration of people from different racial and ethnic groups is associated with greater inter-personal interaction.
Of course, the usual caveats about correlation not proving causation apply to this analysis. But it is nonetheless striking that after controlling for the diversity of metropolitan population, intermarriage is much more common in places with low levels of segregation than in places that are more highly segregated. This evidence is highly consistent with the thesis that social interaction among people from different racial and ethnic groups is enhanced by greater integration.
