Part 4. Are racially and economically homogeneous cities and suburbs in a segregated metro “inclusive?”
Looking only at disparities within cities misses the often far larger disparities across cities within in single metropolitan area.
(Editor’s note: This is the fourth in a five-part series examining a recent Urban Institute report measuring and ranking city-level inclusiveness. Please read part 1 for an introduction to the report, and an overview of the issues it raises.)
The Urban Institute’s “Measuring Inclusion” report looks at both racial inclusion and economic inclusion, and ranks US cities based on a series of factors. As we’ve suggested, cities are far from ideal units for measuring inclusion; city boundaries are varied, and in many cases were constructed to divide metropolitan areas by race; often times city policies produce exclusionary results.
In the Urban Institute report, racial inclusion is defined as a composite of a segregation index (confined to looking at segregation within city limits), and the disparity between people of color and whites in homeownership, educational attainment and poverty. These measures ignore the level of indicators (whether education is high or low) and only look at differences between groups. So if whites and people of color have have similarly low levels of say educational attainment, a community is regarded as more inclusive.
Let’s just zero in on the Detroit metropolitan area. Keep in mind: Metro Detroit is by one common measure–the black/white segregation index–the most segregated large metro areas in the US. Here’s the 2010 ranking of US metro areas from Brown University’s US 2010 project:
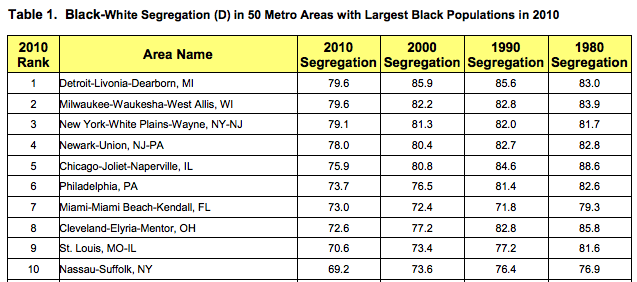
According to the Urban Institute analysis, the City of Detroit is a paragon of racial inclusion (ranking 11th of 274 cities), and so too, are its suburban cities of Dearborn (49th) and Sterling Heights (43rd). Detroit is 90.9 percent persons of color, and Dearborn is 12.4 percent persons of color (271st) and Sterling Heights 17.3 percent persons of color (264th). To look at these cities in isolation is to pretend that they are different worlds, not connected to one another in any meaningful way. But anyone with a casual familiarity with the politics of local government and racial history in the US will know that is parsing willfully blinds us to the underlying problem.
The broader region–Detroit and all its surrounding suburbs–is profoundly segregated, moreso than every other major metropolitan area in the US. You cannot find any central city with a share of persons of color differs more from that of its suburbs than Detroit. But to read the UI report, one would believe that both the City of Detroit, and its surrounding suburban cities are exemplars of racial inclusion among American cities, all ranking in the top 20 percent of American cities in racial inclusion.
What’s driving the high racial inclusion ranking for Detroit and many of its suburbs is the fact that there are very small racial gaps in poverty rates, educational attainment and homeownership. The City of Detroit ranks in the lowest 10 percent of US cities for the poverty gap, education gap, and homeownership gap. But this is only because the city’s population, regardless of race, is so poor, and because so many people with choices, regardless of race, have moved away, leaving a poor, but equal population. Detroit is inclusive in its immiseration.
Nor is this peculiar to Detroit: other industrial cities experiencing population losses, such as Gary, Indiana, and Camden New Jersey also score highly on Urban Institute’s measure of racial inclusion–16th and 13th respectively, again out of 274.
The disparity between metropolitan and principal city scores for segregation extends to economic segregation as well. Again, let’s focus on Detroit. The City of Detroit, according to the Urban Institute report has the lowest level of income segregation of any of the principal cities in the 50 largest US metro areas. But the Detroit metropolitan area is one of the five most economically segregated large metropolitan areas, according to the data compiled by Reardon and Bischoff.
The city of Detroit scores well on economic segregation because it is uniformly poor. The Detroit metro area scores poorly on economic segregation because the region’s poverty is concentrated in the principal city, and its higher income households are concentrated in suburbs. Looking just at segregation within city limits conceals the region’s high level of economic segregation.
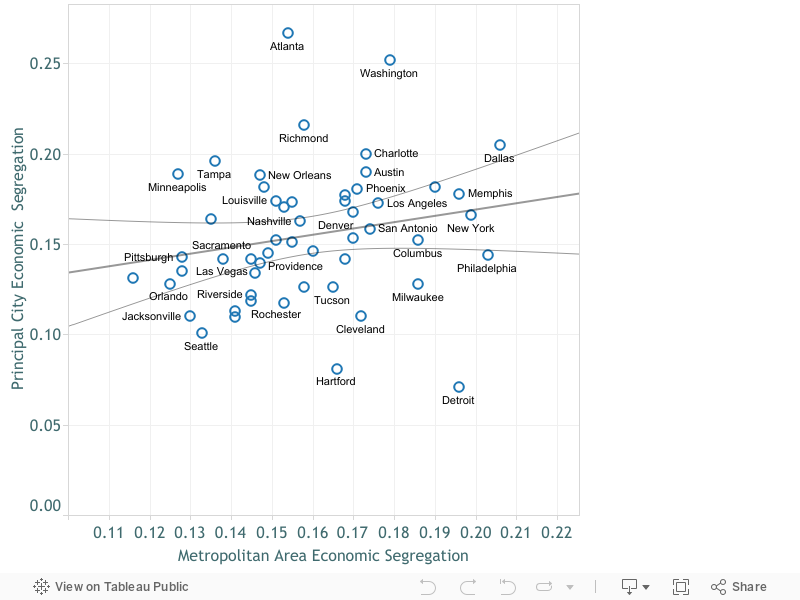
Overall, there’s actually very little correlation between principal city economic segregation and metropolitan economic segregation. As a result, city level data don’t serve as a proxy or parallel for regional economic polarization. Looking just at city level segregation data misses big variations in regional income segregation. The following chart shows principal city economic segregation from the Urban Institute report on the vertical axis and metropolitan economic segregation on the horizontal axis. Larger values on both axes correspond to higher levels of economic segregation.
In our view the high racial and economic inclusion rankings that the Urban Institute report assigns to Detroit (and similar cities) are a clear sign that its methodology is not well-aligned with our understanding of what really constitutes inclusivity. Looking only within individual city boundaries, and ignoring the larger metropolitan context, especially the patterns of segregation among cities within a metropolitan area, produces a highly distorted view of which places are inclusive and which aren’t.
