The case for the $7.5 billion Interstate Bridge Replacement project is based on deeply flawed traffic models that ignore the bridge’s capacity limits, and predict plainly unrealistic levels of traffic growth if the bridge isn’t expanded. These grossly overestimated projections make future traffic look worse and overstate the need and understate the environmental and financial costs associated with freeway expansion.
The current I-5 bridge can carry no more than 5,000 vehicles northbound in the afternoon peak hour. All of the available statistics, and every one of the experts that has looked at the bridge has concluded that it is already operating at its maximum capacity.
But, Metro’s regional travel demand model, Kate, pretends that the bridge now carries more than 6,200 vehicles per hour–a thousand more cars and trucks per hour than can actually fit across the bridge.
And the Kate model, used for the IBR environmental analysis, makes the absurd prediction that peak hour PM traffic will increase further beyond its capacity—even if the IBR project isn’t built.
And IBR officials altered the outputs of the Metro model to produce an event higher—and more preposterous–prediction that the “No-Build” version of the bridge would somehow carry 6,900 vehicles per hour in the northbound peak in 2045.
Forecasting the impossible
IBR traffic modeling is blind to the real capacity limits on the I-5 bridges; this is a common flaw in the kind of “static traffic assignment” models that Metro and IBR used;
Models that don’t accurately account for capacity limits are broken, and worthless for analyzing traffic conditions and deciding how to spend billions of dollars. But the Oregon and Washington highway departments have chosen to use these flawed models to sell an oversized bridge.
These over-estimates-pretending that traffic volumes wildly exceed actual capacity are a critical gimmick for falsely portraying what happens if the $7.5 billion Interstate Bridge Replacement Project isn’t built. They’re critically a way of hiding the “induced travel” that will come if the bridge is expanded: by pretending that traffic will increase whether or not the I-5 highway is widened, IBR officials are concealing the pollution and traffic that comes from wider roadways.
The decision to use a traffic model that ignores the capacity constraints on the existing I-5 bridges exaggerates future traffic growth and congestion, and falsely conceals the negative environmental effects associated with a wider crossing. Using an inaccurate, unscientific model, blatantly violates the National Environmental Policy Act.
The most obvious feature of the existing I-5 bridges over the Columbia River is the two narrow three-lane wide structures that carry highway from bank to bank. There are just so many vehicles that can be fitted into these lanes. The traffic data–confirmed by every expert that has looked at the bridge–is that the maximum peak hour capacity of the bridge has been reached, and can’t increase further. For example, afternoon peak hour crossings on the bridge have been stuck at less than 5,000 vehicles per hour for the past two decades.
In spite of this obvious and well-documented limitation, Metro’s Kate travel demand model, which is the basis for the IBR’s environmental analysis, asserts that even if nothing is done, more and more cars will cross the bridge at the peak hour each year. In fact, as we’ve documented previously, Metro’s Kate model—the basis for IBR traffic projections–simply fails to correctly estimate even the current levels of traffic on the I-5 bridges, assigning nearly 20,000 more daily trips to the bridges than they actually carry.
The problem of these over-estimated volumes is most acute for the peak hour. Metro’s Kate model over-estimates the current level of traffic on the bridge–asserting that it carries over 6,000 vehicles per hour in the Northbound PM peak, even though traffic data show that flows are always less than 5,000 vehicles per hour.
The problem here is that Metro’s model simply fails to realistically account for the physical limits on traffic flow on the bridge. The model creates a fictional alternative reality where the bridge somehow carries more and more peak hour traffic–even though the data, and the modelers themselves admit the bridge has long since reached its capacity.

That inflated “no-build” estimate is a critical foundation of the phony case being made for expanding the I-5 bridges. By exaggerating peak hour growth if nothing is done, the model makes it appear that traffic will be worse than it will actually ever be. In addition, because environmental analyses use this exaggerated no-build traffic level (and resulting pollution) as their basis for comparison, they create the false perception that the “build” alternatives (which add massive amounts of road capacity) won’t stimulate additional trips, vehicle miles of travel, and pollution.
The Interstate Bridge Replacement (IBR) project, with its multi-billion dollar price tag, is founded on traffic projections that defy physical reality. This discrepancy between modeled predictions and actual capacity raises serious questions about the project’s justification and potential environmental impacts.
The I-5 Interstate Bridge is at capacity, and can’t add more traffic
All experts—and IBR—agree the I-5 bridges are at capacity at peak hours. Every analyst who has looked at the I-5 bridges has concluded that they are effectively carrying as many vehicles per hour during peak periods as is possible.
- Traffic count data show that PM peak hour volumes have been steady for the past twenty years.
- Afternoon northbound peak hour volumes have been stuck at less than 5,000 vehicles per hour since 2000.
- The project’s Environmental Impact Statement concedes that the maximum hourly capacity of the I-5 bridges is no more than 1,850 v/l/h or about 4,550 vehicles per hour (IBR Traffic Technical Report, Appendix A, Transportation Methods Report.).
- IBR forecast officials explain that traffic levels on I-5 have grown more slowly than on I-205, “due to capacity constraints and extensive congestion over the Interstate [I-5] Bridge.”
- CDM Smith, the national traffic expert hired by ODOT and WSDOT in 2013 to forecast traffic concluded, “Traffic under the existing toll-free operating condition on the I-5 bridge reached nominal capacity several years ago, . . . The I-5 bridge has little or no room for additional growth in most peak periods.”
- None of this is a recent revelation: peak traffic growth has been capacity constrained for decades. Clark County’s Regional Transportation Council reported in 2018 that “The Interstate Bridge reached capacity during peak hours in the early 1990s.”
In spite of the universal agreement that the current bridges are at peak capacity during rush hours, Metro’s model claims that peak hour volumes will continue to increase even if nothing is built. Let’s focus on the afternoon rush hour—northbound traffic from Portland to Vancouver, between 4 and 6 pm—the period of maximum daily traffic congestion. State traffic count data show that about 4,800 vehicles crossed the I-5 bridges in the afternoon peak hour Northbound each day in 2019. But Metro’s traffic model, Kate, which is the basis for IBR’s justification, and environmental analysis makes a false claim that more than 6,000 vehicles crossed the I-5 bridges northbound in the PM peak hour.
Projected peak hour exceed physical capacity
The Metro model, which forms the basis of IBR’s planning, consistently predicts peak traffic levels on the I-5 bridge that exceed its demonstrated physical capacity of the bridge.
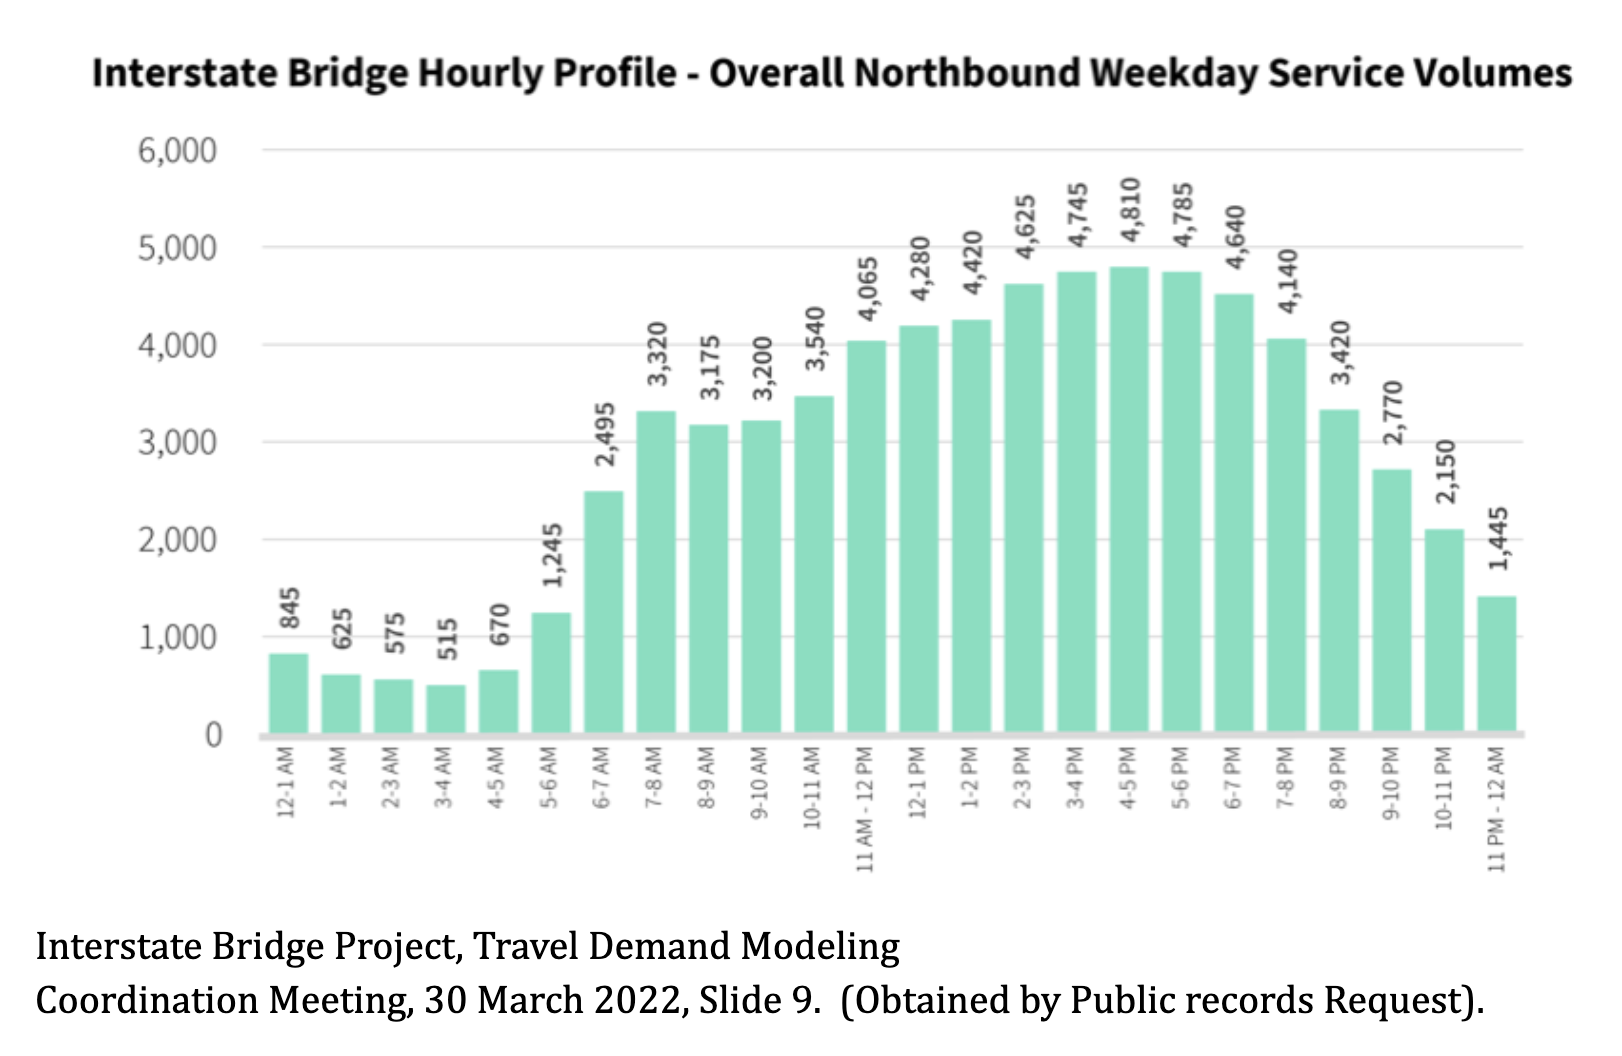
1. Current Capacity: The I-5 bridge can carry approximately 5,000 vehicles northbound in the PM peak hour, as evidenced by traffic count data. Here is a typical chart from IBR. Maximum northbound traffic flows at 5pm were 4,810 vehicles.
2. Model Overestimation: Metro’s “Kate” model claims current traffic is currently (2019) over 6,290 vehicles per hour and predicts this will increase slightly to 6,375 by 2045. Here is a screenshot of an Metro Excel spreadsheet summarizing the peak hour volumes for I-5 in 2019. Northbound volumes for single occupancy cars, multiple occupancy cars, and medium and heavy trucks are highlighted and total 6,290 vehicles in the PM peak hour in 2019:
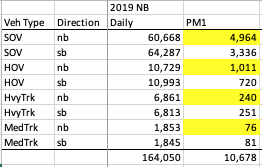
Metro spreadsheet obtained by public records request. Highlighting not in original. PM peak hour volume of 6,290 is the sum of 4,964 single occupancy cars, 1,011 multiple occupant cars, 240 heavy trucks and 76 medium trucks.
3. IBR’s Inflated Growth Estimates: Consultants for the Interstate Bridge Replacement project altered the estimated traffic levels from Metro “Kate” model, something they call “post-processing.” They recognized that Metro’s Kate model over-estimated current (2019) NB peak hour traffic levels–which they lowered to 5,740 vehicles from Kate’s 6,290. The 5,740 figure still greatly exceeds actual traffic counts. But while Metro’s Kate model allowed almost no growth in peak traffic in the No-Build through 2045, IBR’s “post-processing” allowed growth in the No-Build to increase to 6,905 vehicles per hour–more than 2,000 vehicles per hour beyond the actual physical capacity of the bridge.
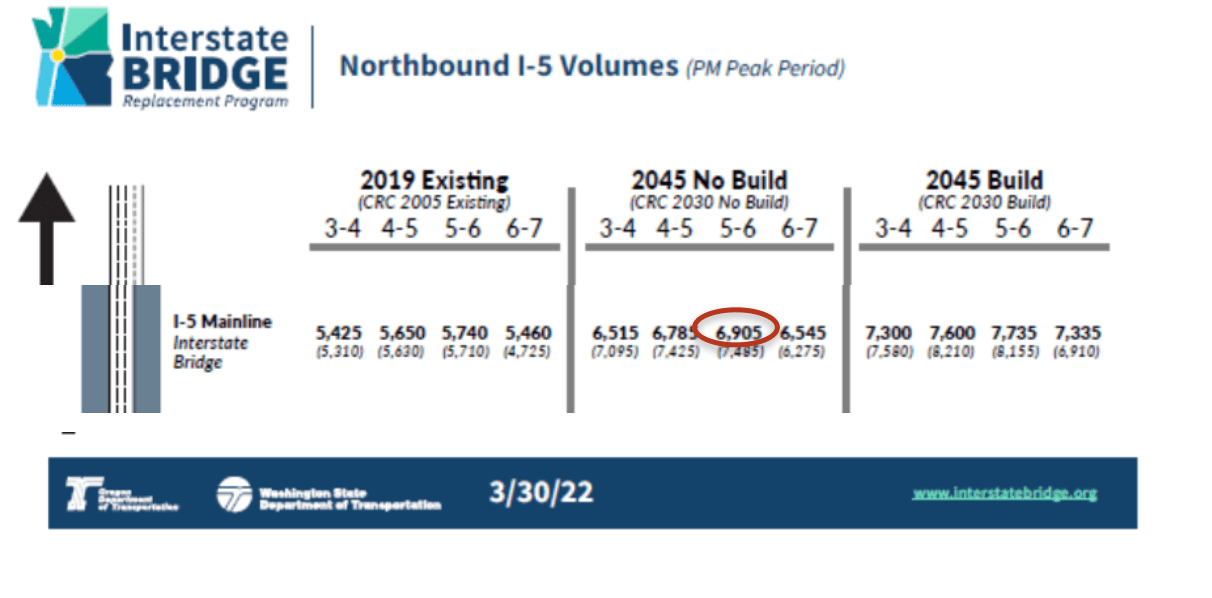
IBR traffic modeling presentation, obtained by public records request (detail). March 30, 2022, Slide Number 21.
In sum: the IBR’s claims about peak hour traffic don’t mesh with actual data from traffic counts. The Metro Kate Model and IBR “post-processed” data over-state current traffic levels significantly. Both models assume that peak hour traffic will grow further in excess of capacity, and IBR’s “post-processing” while partly correcting for base year over-estimates, has an even higher predicted growth rate. These projections are not just optimistic; they are physically impossible given the current infrastructure.
As traffic expert Norm Marshall says, models like these that fail to recognize capacity limits are “Forecasting the Impossible.” He explains Static Traffic Assignment modeling technique used by Metro and IBR
. . . allows modeled traffic volumes to exceed capacity. This misrepresents traffic not only on the over-capacity segment, but on downstream segments that the excess traffic could not really reach because it either would divert to other routes or be queued upstream.
Marshall, N. “Forecasting the impossible: The status quo of estimating traffic flows with static traffic assignment and the future of dynamic traffic assignment,” Research in Transportation Business and Management, https://doi.org/10.1016/j.rtbm.2018.06.002
Violating Federal Highway Administration guidance
Transportation experts have long known that failing to realistically account for capacity limits leads traffic models to grossly over-estimate traffic growth. The Governmental Accountability Office and the National Academy of Sciences have both criticized this limitation of the traffic models of the type used by Metro and IBR. The Federal Highway Administration (FHWA) explicitly requires that demand estimates realistically account for capacity limitations.
“Constraining demand to capacity. . . care must be taken to ensure that forecasts are a reasonable estimate of the actual amount of traffic that can arrive within the analytical period . . . Regional model forecast are usually not well constrained to system capacity”
IBR clearly hasn’t taken care to assure its forecasts predict only as much traffic as the roadway can handle. The current modeling approach violated FHWA guidance, raising questions about the validity of the entire planning process.
Implications of overestimated peak hour traffic
Correctly estimating future peak hour traffic levels are the critical planning parameter for this project. The consequences of IBR’s inflated peak hour traffic projections are far-reaching:
1. Unjustified Expansion: By predicting traffic levels that exceed capacity, the model artificially creates congestion scenarios used to justify expanding freeway capacity.
2. A Distorted Environmental Assessment: Overstating traffic in the “no-build” scenario leads to an underestimation of the environmental impacts of the “build” option, potentially violating NEPA requirements. By exaggerating traffic and congestion in the “no-build” scenario, the IBR understates the true enviornmental effects of the build scenario.
3. Ignoring Historical Trends: The models disregard the fact that peak hour I-5 bridge traffic has not increased since 2005 due to existing capacity constraints, a point acknowledged by IBR itself.
IBR uses the euphemism “demand volumes” to hide its predictions that traffic will exceed capacity
IBR uses the term “demand volumes” to describe traffic levels that exceed physical capacity. This is a euphemism to conceal the fact that these are not predictions of actual levels of travel, but are modeled predictions of the number of vehicles that might use the bridge if there were no capacity constraints. The Metro RTDM model allows predicted traffic levels to exceed highway capacity. The SDEIS repeatedly uses the term “demand volumes” in its Purpose and Need Statement (two instances) and in its Traffic Analysis (four instances). This terminology allows for projections that exceed physical capacity, but it’s a concept at odds with reality. In practice, traffic demand is always constrained by available capacity.
False models are no basis for multi-billion dollar decisons
The IBR project’s reliance on traffic projections that exceed physical capacity undermines its credibility and raises serious questions about its necessity and environmental impact. As stewards of public resources and our environment, we must demand planning based on reality, not inflated projections.
It is imperative that the IBR team address these discrepancies and provide a clear, factual basis for their projections. Without this, we risk allocating billions of dollars to a project that solves imaginary problems while potentially creating real environmental and fiscal issues.
The future of our regional transportation system and the responsible use of public funds depend on a honest, data-driven approach to infrastructure planning. It’s time for the IBR project to align its projections with reality and provide the transparent, accurate analysis that the public deserves.