Last week, we looked at some of the growing body of academic evidence that shows that mixed income neighborhoods play a key role in helping create an environment where kids from poor families can achieve economic success.
One of our key urban problems is that economically, we’ve grown more segregated over time: the poor tend to live in neighborhoods that are substantially poor, and the better off live in neighborhoods with few poor residents. As a result, one of the key metrics we ought to be paying attention to the level and change in economic segregation in our metropolitan areas.
There are a variety of different facets to economic segregation. It encompasses the segregation of poverty (the concentration of the poor in predominantly poor neighborhoods), the segregation of affluence (enclaves of high income households) and the separation of the middle class from high income and low income households. Also, in any metropolitan area, segregation levels will be influenced by the degree of overall income inequality.
The most comprehensive analyses of trends in economic segregation come from the outstanding research by Kendra Bischoff and Sean Reardon, whose report is worth diving into if you want more details.
Over the past four decades, economic segregation trends are extremely easy to summarize: they’re up. American cities are far more segregated by income today than they were in 1970 by every measure we’re aware of, indicating more “secession of the successful,” more concentrated poverty, and even more sorting among the lower-middle and upper-middle income tiers.
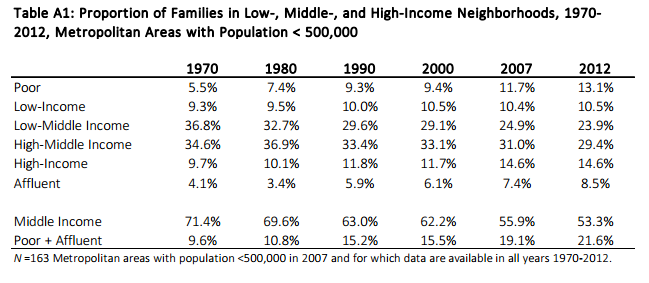
In large metro areas, in 1970, just 5.5 percent of families lived in “poor” neighborhoods (where median income is below 67 percent of the regional median), and 4.4 percent lived in “affluent” neighborhoods (where median income is more than 150 percent of the regional median). By 2012, those figures had both more than doubled, to 13.1 and 8.5 percent, respectively—meaning that over a fifth of all families lived in either poor or wealthy neighborhoods, as opposed to one in ten in 1970.
So that’s how things have changed over the last 40 years. What about the last five? In their most recent paper, Bischoff and Reardon focus on changes between 2007 and 2012. (For sticklers, these are actually averages of 5-year American Community Survey results from 2005-09 and 2010-2014). Over that period, income segregation has continued its rise, but the trends look somewhat different than they have over the longer term.
Over the last five years, the proportion of families in low- and high-income neighborhoods has continued to increase—but a more sophisticated look at the numbers suggest that’s more about changing income than actual segregation. Rather, Bischoff and Reardon show that most of the rise in income segregation between 2007 and 2012 came from the increasing segregation of lower-middle-income families (those between the 10th and 50th percentile of income) and upper-middle-income families (those between the 50th and 90th percentiles). The growing inequality of income overall is one factor fueling economic segregation.
There are several different ways to measure economic segregation–and the Bischoff and Reardon paper has measures for the segregation of the poor from everyone else, the segregation of the rich, and a combined measure showing how much the rich and poor are segregated from the middle class. Their most comprehensive measure of aggregate segregation is an indicator called “H”, which is an entropy index that captures the degree of dispersion from an even distribution at all income levels. We use this measure as the single best indicator of overall levels of income segregation. While values of H don’t have a simple intuitive description, higher levels correspond to greater segregation; lower values correspond to less segregation.
Using Reardon and Bischoff data, we’ve ranked all of the 51 largest US metropolitan areas according to their degree of income segregation from 1970 to 2012. The most segregated areas are shown at the top of the table (you can use tools in the table to re-sort rankings for different years). The final column in the table shows the change in the value of “H” for each metro area between 1970 and 2012.
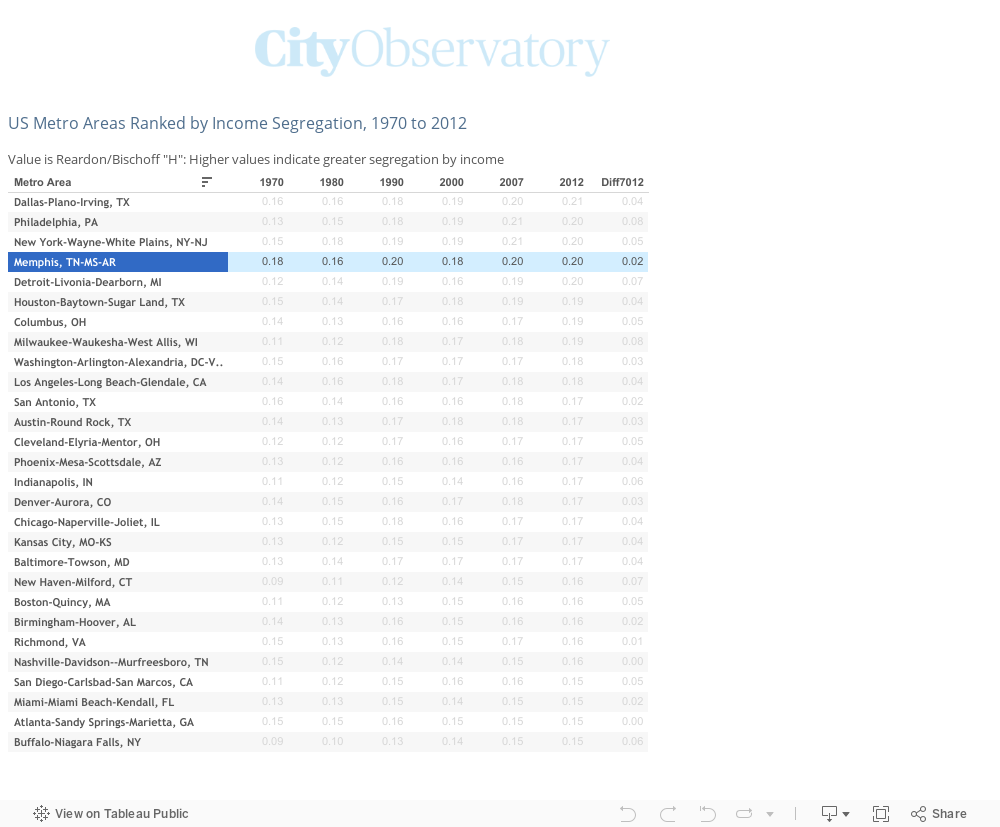
Several findings stand out. First, income segregation increased almost everywhere. Only two of the 51 largest metro areas–Raleigh and New Orleans–didn’t experience an increase in income segregation over the past four decades. In addition, the rankings of metro areas are relatively stable over time–income segregation is an enduring and slowly changing feature of the built environment. Among the metro areas with the highest levels of income segregation are Dallas-Fort Worth, Philadelphia and New York. The three metros with the lowest levels of income segregation are Portland, Orlando and Minneapolis-St. Paul
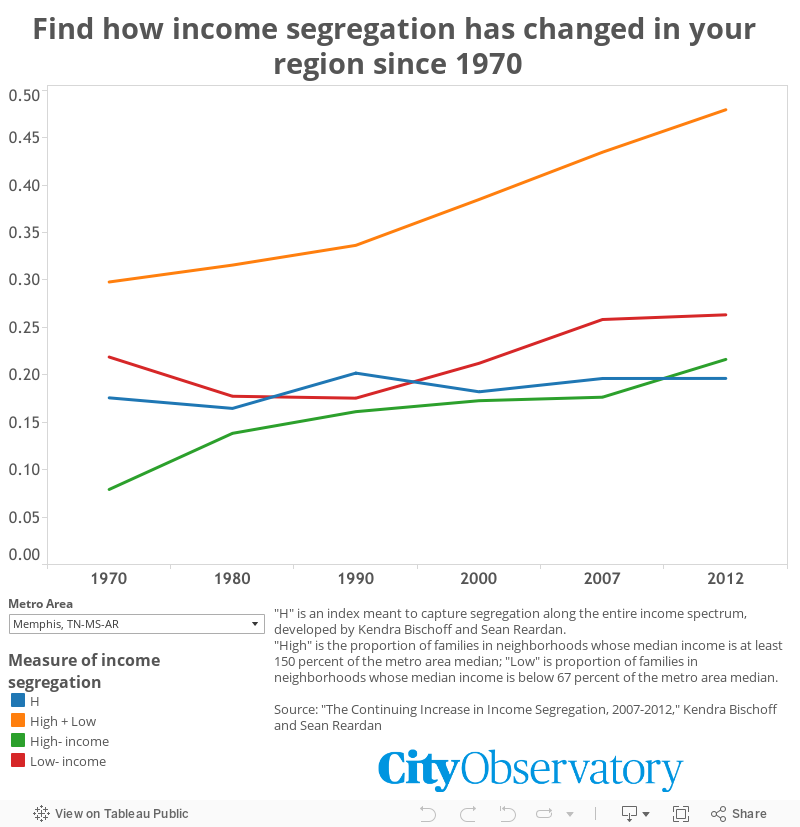
To see how an individual metropolitan area has performed over time, you can also select it on the following chart. The chart shows graphically, the value of H and other segregation indicators for a single metropolitan area for each of the years in the Bischoff Reardon database. In addition to H (blue), the chart illustrates the percent of population in poor neighborhoods (red), the percent in high income neighborhoods (green) and the combined percent in high income and poor neighborhoods (orange). For each indicator, higher values indicate greater segregation. These other measures help show the extent to which segregation in any place is driven more by concentration of poverty or secession of the successful.
The Bischoff and Reardon data confirm both the prevalence and growth of income segregation in American metropolitan areas. This data is an important tool urban leaders can use to understand how their region performs on this important dimension, and also lets us see which communities might be good places to examine to understand the policies and characteristics that have fostered higher levels of economic integration.
