Black-owned homes are valued at a discount to all housing, but the disparity is worst in highly segregated metro areas
There’s a strong correlation between metropolitan segregation and black-white housing wealth disparities
More progress in racial integration is likely a key to reducing Black-white wealth disparities
It’s long been known that US housing markets and policy have combined to produce a huge disparity in housing wealth between Black and white families in the US. Andre Perry and his colleagues at the Brookings Institution, for example, have estimated that owner-occupied homes in Black neighborhoods are undervalued by $48,000 per home on average.
The racial/ethnic home value gap
A new report from real estate analytics firm Zillow drills down on the racial/ethnic home value disparity. Using a combination of home sales data and information from the American Community Survey, they estimate the average home value in different markets around the country for several racial/ethnic groups—Blacks, Latinx, Asian, non-Hispanic whites, indigenous people and Pacific Islanders. Home values are systematically lower for most people of color, with Black households experiencing the biggest gap, with their homes being valued about 15 percent lower than all homes in the US.
The Zillow data also track the trends in the racial home value disparity over time. The collapse of the housing bubble caused racial disparities to widen, but they’ve narrowed a bit in recent years. Zillow explains:
Prior to the Great Recession, the gap between Black-owned home values and all home values was about 15% — if the typical U.S. home at the time was worth $1, the typical black-owned home was worth $0.85 — according to a Zillow analysis of home values in communities with different racial compositions. The gap grew to 20% by March 2014 after years of job losses and elevated foreclosures. Similarly, the ratio of Latinx home values to all home values hit bottom in May 2012 at 86% — down from 88% before the housing bubble. It has taken almost a decade for the typical home owned by a Black or Latinx homeowner to roughly get back to where it was relative to the standard U.S. home in 2007.
While the overall average is a 15 percent devaluation for Black-owned homes relative to all homes, there are wide variations among metropolitan areas. As the Zillow report notes, the disparity is as little as 1 percent in some metropolitan areas (Riverside, CA) and more than 40 percent in others (Birmingham, Buffalo and Detroit). It’s apparent that the pattern of variation across metro areas isn’t random. Cities in the West, as a rule have lower disparities than cities in the Northeast and Midwest.
How segregation drives the housing value gap
One thing we know about race and US cities is that there is a wide variation in the level of housing segregation. As we noted last year, some US cities have much lower levels of white/non-white segregation than others. We investigate the relationship between segregation and racial home value disparities by looking at data for large US metro areas. We draw on metropolitan level estimates of the black-white dissimilarity index computed by the Brookings Institution, and compare them to Zillow’s estimate of the gap between Black-owned home values and all home values for those same metro areas.
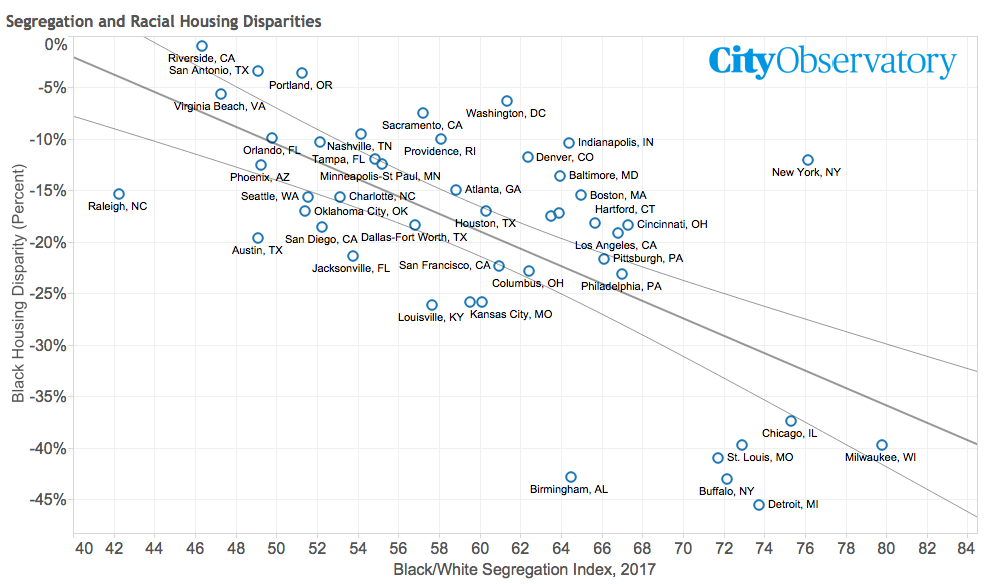
This chart shows the level of Black-white segregation on the horizontal axis (with higher levels of segregation corresponding to higher values on the index) and the relative value of Black-owned homes to all homes on the vertical axis (all the values are negative because in every market, Black-owned homes are valued at a discount to all homes. These data show a clear negative relationship between segregation and the home value gap: The more segregated a metro area, the greater the gap in housing values. Black households who own homes in more segregated metro areas suffer a greater housing value gap that Black households who live in less segregated metro areas.
These data show that there are seven metro areas—Birmingham, Buffalo, Chicago, Cleveland, Detroit, Milwaukie and St. Louis— that have particularly high levels of segregation and a particularly wide racial housing value gap. These metros are clustered in the lower right of our diagram; all have Black-white segregation index values of 70 or more, and in every metro, Black-owned housing is valued at at least an 37 percent discount to all housing.
At the other end of the spectrum, metro areas with low levels of segregation have very small racial housing value gaps. San Antonio, Riverside, Portland, and Virginia Beach have Black/white segregation scores of less than 51 and have racial housing gaps that are less than 6 percent.
But even excluding these extreme cases, there’s still a noticeable relationship between the racial housing value gap and segregation in less segregated metro areas: In general, the less segregated a metro area, the small the racial housing value gap.
We are rightly concerned about the wealth gap between people of color and the nation’s non-HIspanic white population. We have a system where homeownership is a large fraction of wealth for most households, especially those who do not have high incomes. These data suggest that making continuing progress in promoting neighborhood integration is key to ameliorating the housing value gaps that underlie the observed wealth gap.
